0371
Clinical evaluation of patients with recurrent glioblastoma using hyperpolarized carbon-13 metabolic imaging1Radiology and Biomedical Imaging, UC San Francisco, San Francisco, CA, United States, 2Bioengineering and Therapeutic Science, UC San Francisco, San Francisco, CA, United States, 3Neurological Surgery, UC San Francisco, San Francisco, CA, United States, 4Neurology, UC San Francisco, San Francisco, CA, United States
Synopsis
Keywords: Tumors (Post-Treatment), Hyperpolarized MR (Non-Gas)
Motivation: Despite aggressive treatments, patients with GBM have a median overall survival of 14-16 months and a need for noninvasive evaluation of therapeutics is apparent.
Goal(s): To assess whether treatment-induced metabolic changes can be observed in patients using parameters derived from hyperpolarized 13C metabolic imaging data.
Approach: 19 patients with recurrent GBM were followed for at least 6 months following treatment initiation and evaluated at various timepoints using HP-13C imaging.
Results: A difference in trends following treatment was observed in pyruvate-to-lactate conversion for patients who received anti-angiogenic treatments as compared to those who received a protein kinase inhibitor.
Impact: Given the challenges associated with evaluating progression and response to therapy in patients with glioblastoma using conventional MRI, this study provided evidence that hyperpolarized carbon-13 techniques can detect serial changes in dynamic metabolism which might help predict disease status.
Introduction
Despite aggressive treatment, patients with glioblastoma (GBM) have a median overall survival of 14-16 months[1]. As such, there is a need for investigational therapeutics[1] to be developed and evaluated. Advanced MR methods are also needed to better characterize disease status to inform response to therapy and treatment plans. Previous data have demonstrated that hyperpolarized carbon-13 (HP-13C) metabolic imaging can capture the Warburg effect in recurrent GBM[2]. In this study, we used HP-13C metabolic imaging[3-7] to follow patients with recurrent GBM for at least six months from initiation of treatment to assess metabolic changes during and after treatment.Methods
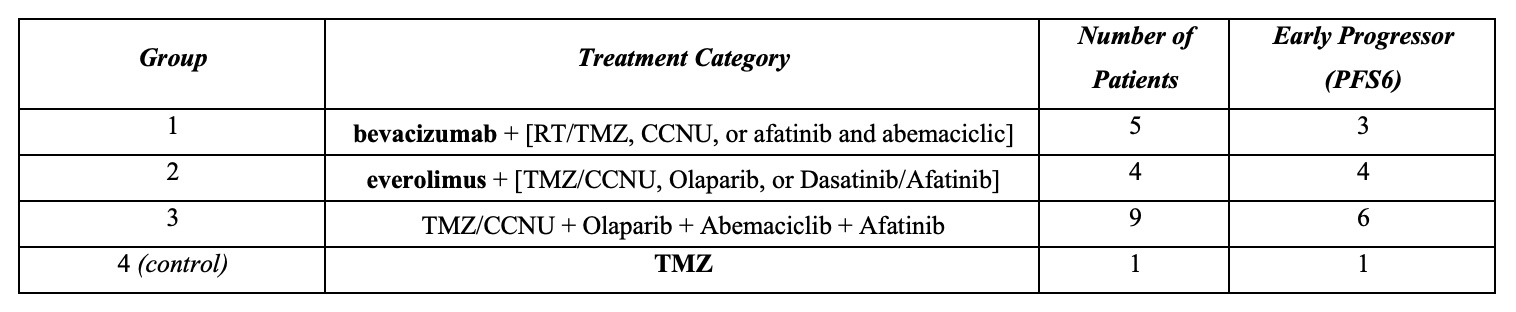
Study Population. A total of 19 patients diagnosed with recurrent GBM received serial 1H/HP-13C MRI following surgical resection at before receiving treatment (baseline; n=11), 1 or 2 month (F1; n=15), and 3-5 months (F2; n=4) after receiving treatment (Figure 1). Patients were continuously followed with clinical MR scans. Tumor progression for 15 patients was confirmed by either RANO criteria (n=12)[8] or subsequent surgery (n=3).Imaging. All MR examinations were performed on a 3T GE MR750 scanner with a dual-tuned 24/8-channel 13C/1H phased-array receiver. The MRI protocol included a pre/post-T1 IRSPGR and T2 FLAIR images. Dynamic HP-13C imaging were then acquired using a frequency-specific 2-D multislice EPI sequence9 (TR/TE=62.5ms/21.7ms, 8 slices, 20 timepoints, 3s temporal resolution) with 1.5cm isotropic resolution and constant 𝛼pyruvate/𝛼lactate/𝛼bicarbonate = 20o/30o/30o flip angle scheme and spectro-spatial excitation after the injection of hyperpolarized [1-13C]pyruvate (0.43 mL/kg at 5 mL/s)[7].
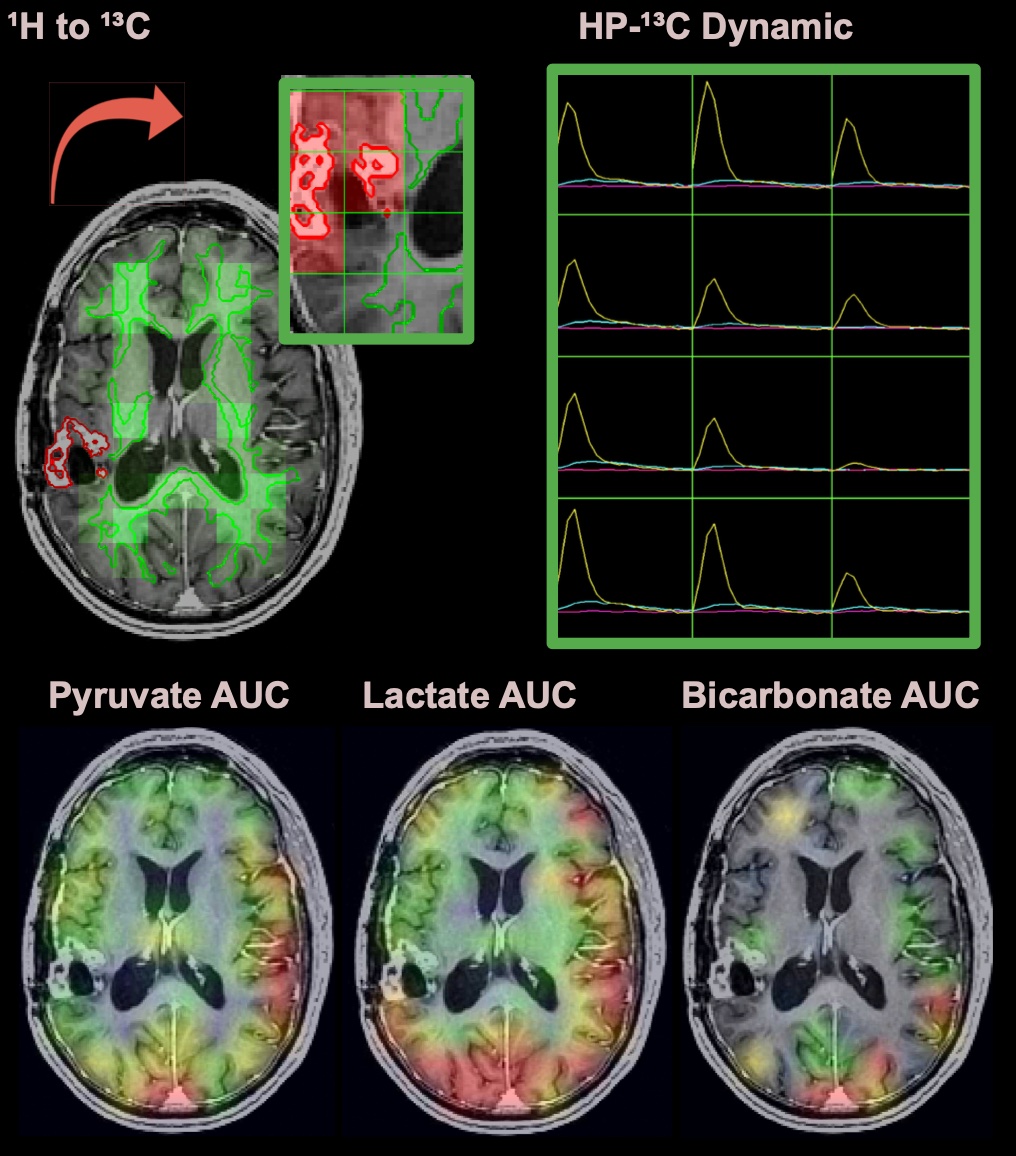
Post-processing and Analysis. ROIs for normal-appearing white matter (NAWM), non- and contrast-enhancing lesion (NEL, CEL) were segmented from the anatomic images (Figure 2). EPI data were prewhitened[10], channel-combined using complex weights from the fully sampled pyruvate signal[11], phased and denoised[12]. HP-13C signals were averaged over all the voxels within each ROI to kinetically model pyruvate-to-lactate (kPL) and pyruvate-to-bicarbonate (kPB) conversion[7]; and area-under-the-curve (AUC) metabolite ratios were generated for lactate-to-pyruvate (lp), bicarbonate-to-pyruvate (bp), and bicarbonate-to-lactate (bl)[13]. 13C voxels were exclusively categorized in relation to proton ROIs using the thresholds of >15% CEL, >30% NEL, and >60% 1H NAWM.
Results and Discussion
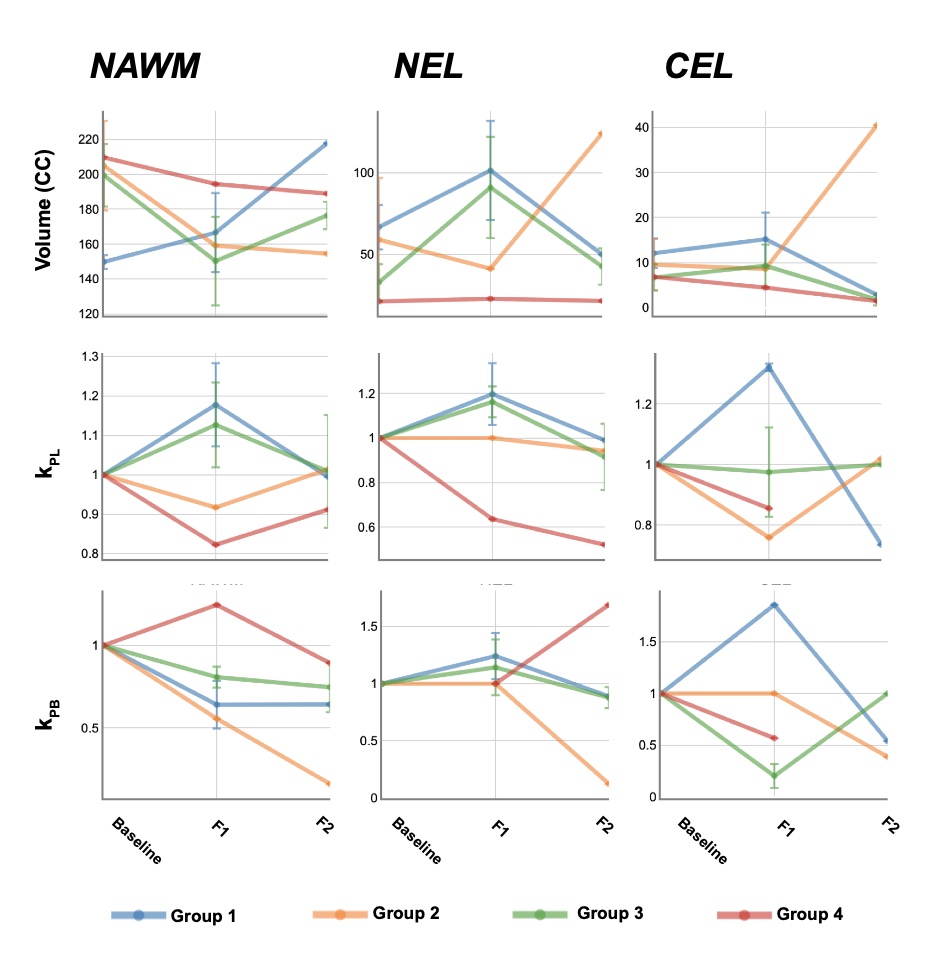
Patient Characterization Patients were categorized based on treatment types by first separating those who received the anti-angiogenic agent bevacizumab as well as those who received the protein kinase inhibitor everolimus. Of the remaining cohort, a patient who received only TMZ was separated into a distinct and final group. 13/19 patients progressed within 6 months of baseline (Figure 1).Lesion volume changes. Patients recruited following surgical resection of recurrent disease diplayed CEL volumes ranging 0 - 17.6cc (median=7.31cc). An overall average increase in NEL volume was observed at F1 for Groups 1 and 3 (52.1%, 180%) while an overall decrease was observed in Group 2 (30.8%) (Figure 2).
HP-13C Parameters Across Treatment Groups.
As the CEL volume changes were small in this population, dynamic metabolism was examined within NAWM/NEL.
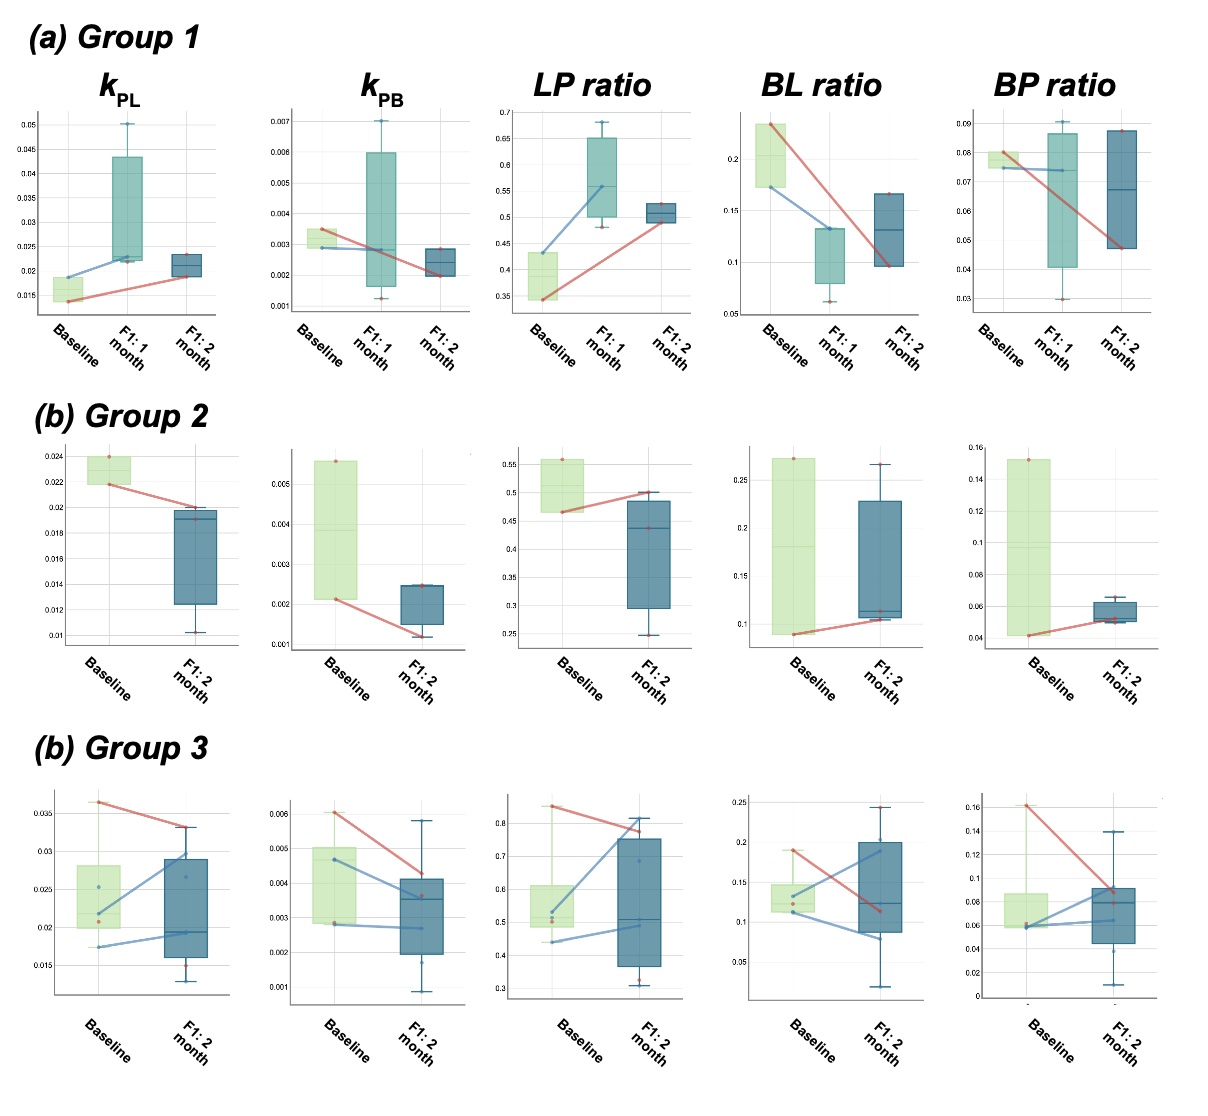
Conflicting trends in bevacizumab vs everolimus groups: At the F1 timepoint, patients in Group 1 demonstrated an average 13% overall increase in kPL in NAWM while a simultaneous 9% decrease was demonstrated in Group 2 (Figure 3). Despite limited sample sizes and small lesions precluding pair-wise analysis, boxplots of HP-13C parameters in NAWM at baseline and F1 timepoints further demonstrated a visible difference in kPL trends in Group 1 compared to Group 2 (Figure 4). A similar 14.5% increase in lactate-to-pyruvate ratio was seen in Group 1 coupled with a 45.1 % decrease in bicarbonate-to-lactate. These trends were not seen in Groups 2-3.
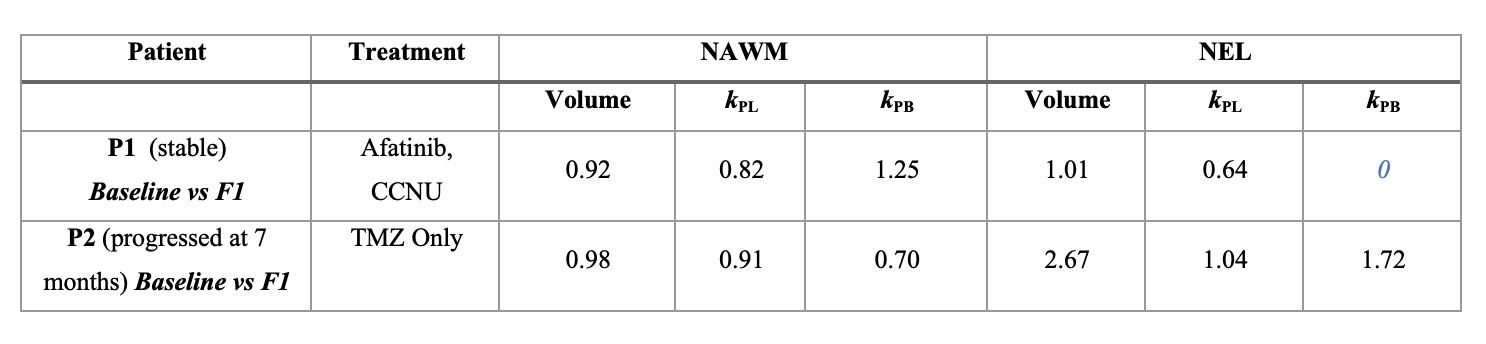
Stable vs. Late Progressor: Given the small sample sizes in different treatment groups and variations in treatment, we compared two patients with similar TMZ/CCNU treatment. Differences in metabolic changes between the patient with progression at 7 months and the one with stable disease are summarized in Figure 5. Although both patients exhibited a slight decrease in NAWM kPL, the patient with early progression exhibited a slight increase in kPL while the stable exhibited a decrease following treatment.
This study characterized the effects of treatment on dynamic metabolism in patients with GBM. A distinct difference in pyruvate-to-lactate changes was observed in patients who received anti-angiogenic medication (bevacizumab) as compared to those who received a protein inhibitor (everoliumus). A decrease in pyruvate-to-lactate conversion observed within a few months of therapy may be an early indicator of positive response to treatment.
Acknowledgements
NIH Grants P01-CA118816, P41-EB0341598, P50-CA097257, T32-CA151022, R01CA262630, and GPMPReferences
- 1. Stupp R, Mason WP, van den Bent MJ, et al. European organization for research and treatment of cancer brain tumor and radiotherapy groups; National Cancer Institute of Canada Clinical Trials Group. Radiotherapy plus concomitant and adjuvant temozolomide for glioblastoma. N Engl J Med. (2005) 352:987–962.
- Autry AW, Vaziri S, LaFontaine M, Gordon JW, Chen HY, Kim Y, Villanueva-Meyer JE, Molinaro A, Clarke JL, Bush NA, Xu D. Multi-parametric hyperpolarized 13C/1H imaging reveals Warburg-related metabolic dysfunction and associated regional heterogeneity in high-grade human gliomas. NeuroImage: Clinical. 2023 Jan 1;39:103501.3.
- Woitek R, McLean MA, Ursprung S, et al. Hyperpolarized carbon-13 MRI for early response assessment of neoadjuvant chemotherapy in breast cancer patient. Cancer Research 2021; tbd4.
- Park, I., Larson, P.E.Z., Gordon, J.W., et al., 2018. Development of methods and feasibility of using hyperpolarized carbon-13 imaging data for evaluating brain metabolism in patient studies. Magn. Reson. Med. 2018; 80: 864–873.5.
- Lee CY, Soliman H, Geraghty BJ, et al. Lactate topography of the human brain using hyperpolarized 13C-MRI. NeuroImage 2020; 204:1162026.
- Grist JT, McLean MA, Riemer F, et al. Quantifying normal human brain metabolism using hyperpolarized [1-13C]pyruvate and magnetic resonance imaging. NeuroImage 2019; 189:171-1797.
- Autry AW, Gordon JW, Chen HY, et al. Characterization of serial hyperpolarized 13C metabolic imaging in patients with glioma. NeuroImage Clin. 2020; 27:1023238.
- Ellingson BM, Wen PY, Cloughesy TF. Modified criteria for radiographic response assessment in glioblastoma clinical trials. Neurotherapeutics. 2017 Apr;14(2):307-20.9.
- Gordon JW, Vigneron DB, and Larson PEZ. Development of a Symmetric Echo Planar Imaging Framework for Clinical Translation of Rapid Dynamic Hyperpolarized C Imaging. Magn Reson Med. 2017; 77: 826–83210.
- Hansen MS. Parallel Imaging Reconstruction I: Cartesian. Proc. Intl. Soc. Mag. Reson. Med. 18 (2010)11.
- Zhu Z, Zhu X, Ohliger M, Cao P, et al Coil combination methods for multi-channel hyperpolarized 13C imaging data from human studies. JMR 2019; 301: 73-3912.
- Kim Y, Chen HY, Autry AW, et al. Denoising of hyperpolarized 13C MR images of the human brain using patch-based higher-order singular value decomposition. Magn. Reson. Med. 2021; 86:2497-251113.
- Autry AW, Vaziri S, LaFontaine M, Gordon JW, Chen HY, Kim Y, Villanueva-Meyer JE, Molinaro A, Clarke JL, Bush NA, Xu D. Multi-parametric hyperpolarized 13C/1H imaging reveals Warburg-related metabolic dysfunction and associated regional heterogeneity in high-grade human gliomas. NeuroImage: Clinical. 2023 Jan 1;39:103501.
Figures