0369
Whole-Tumor Histogram Analysis of Synthetic MRI Predicts IDH mutation status in gliomas1Second Clinical School, Lanzhou University, Lanzhou, China, 2Department of Rehabilitation Medicine, Second Affiliated Hospital of Air Force Military Medical University, Xi'an, China, 3GE Healthcare MR Research, Beijing, China, Beijing, China, 4Department of Radiology, General Hospital of Ningxia Medical University, Yinchuan, China, 5Department of Magnetic Resonance, Lanzhou University Second Hospital, Lanzhou, China
Synopsis
Keywords: Tumors (Pre-Treatment), Brain, Gliomas, Isocitrate Dehydrogenase, Synthetic MRI, Histogram Analysis
Motivation: There is an urgent need to identify a novel, cost-effective, and non-invasive method for determining the IDH mutation status in differentiating between astrocytoma and glioblastoma.
Goal(s): To investigate the potential value of whole-tumor histogram metrics derived from synthetic MRI in distinguishing IDH mutation status.
Approach: Histogram metrics were extracted from the quantitative maps. Variables with statistical significance in univariate analysis were included in multivariate logistic regression analysis to develop the combined model. The AUC were used to assess the diagnostic performance of metrics and models.
Results: The combined model could be a valuable preoperative tool to distinguish IDH mutation status.
Impact: The current study proposes a combined model that comprises T1-10th, cT1-10th, and age. This model demonstrates differentiation between IDH-M astrocytoma and IDH-W glioblastoma. Moreover, it has the potential to decrease genetic testing expenses while offering treatment decision support for clinicians.
Introduction
Gliomas with IDH-mutant (IDH-M) have a better prognosis and overall survival rate than IDH-wildtype (IDH-W) (1-3). Therefore, a precise assessment of IDH mutation status is critical for the diagnosis and appropriate treatment of gliomas. Synthetic MRI can simultaneously quantify T1, T2, and PD values to generate relaxation quantitative maps (T1, T2, and PD maps) and contrast-weighted maps (including synthetic T1WI, T2WI, etc.) (4,5). Histogram analysis can provide additional quantitative information about the tumor's microstructure, allowing a more comprehensive assessment of tumor heterogeneity. The purpose of our study was to investigate the potential value of synthetic MRI metrics combined with whole-tumor histogram analysis for distinguishing IDH mutation status between astrocytoma and glioblastoma, and compare its predictive performance with clinical and radiological features.Material and Methods
PatientsThis prospective study was approved by the Medical Research Ethics Committee and written informed consent was obtained from participants. A total of 80 patients with gliomas were assessed for study inclusion.
MRI protocol
Patients underwent MRI examinations on a 3T MRI (Premier, GE Healthcare, USA) equipped with a 48-channel coil. Synthetic MRI was performed by using an axial MDME sequence with the following parameters: TR=4214ms, TE1=21ms, TE2=108ms, FOV=24×18cm2, matrix=320×256, thickness/spacing=5/1mm, scan time=3min39s. Contrast-enhanced MDME acquisition was performed closely after injection of contrast agent. Imaging processing The raw image data of synthetic MRI underwent post-processing using SyMRI 8.0 software (SyntheticMR, Sweden), which led to the generation of quantitative maps (T1map/T2map/PDmap/CET1map/CET2map/CEPDmap) and contrast-weighted maps (synthetic T1FLAIR/T2WI/T2FLAIR/CET1FLAIR). Register all images to synthetic T2FLAIR. Next, a neuroradiologist manually segmented every tumor slice to obtain VOIs using ITK-SNAP software (v.3.8.0, http://www.itksnap.org). Subsequently, we applied the VOIs of the tumor core to all quantitative maps. From these maps, we extracted histogram metrics using Pyradiomics (https://github.com/Radiomics/pyradiomics).
Development of the clinicoradiological and combined model
The radiological features were retrospectively evaluated by anther neuroradiologist. The features evaluated included tumor location, tumor size, etc. Univariate analysis was used to compare clinical, radiological, and histogram metrics between groups. The clinicoradiological model was developed by multivariate logistic regression analysis. We also created the combined model that integrated independent risk factors from clinical, radiological, and histogram metrics to distinguish IDH mutation status.
Statistical analysis
We employed univariate analysis to compare the differences in variates across the groups. Multivariate logistic regression analysis was employed to determine the risk factors between groups. Receiver operating characteristic (ROC) curve was established to assess the diagnostic value of metrics for discrimination. The flowchart of this study is shown in Figure 1.
Results
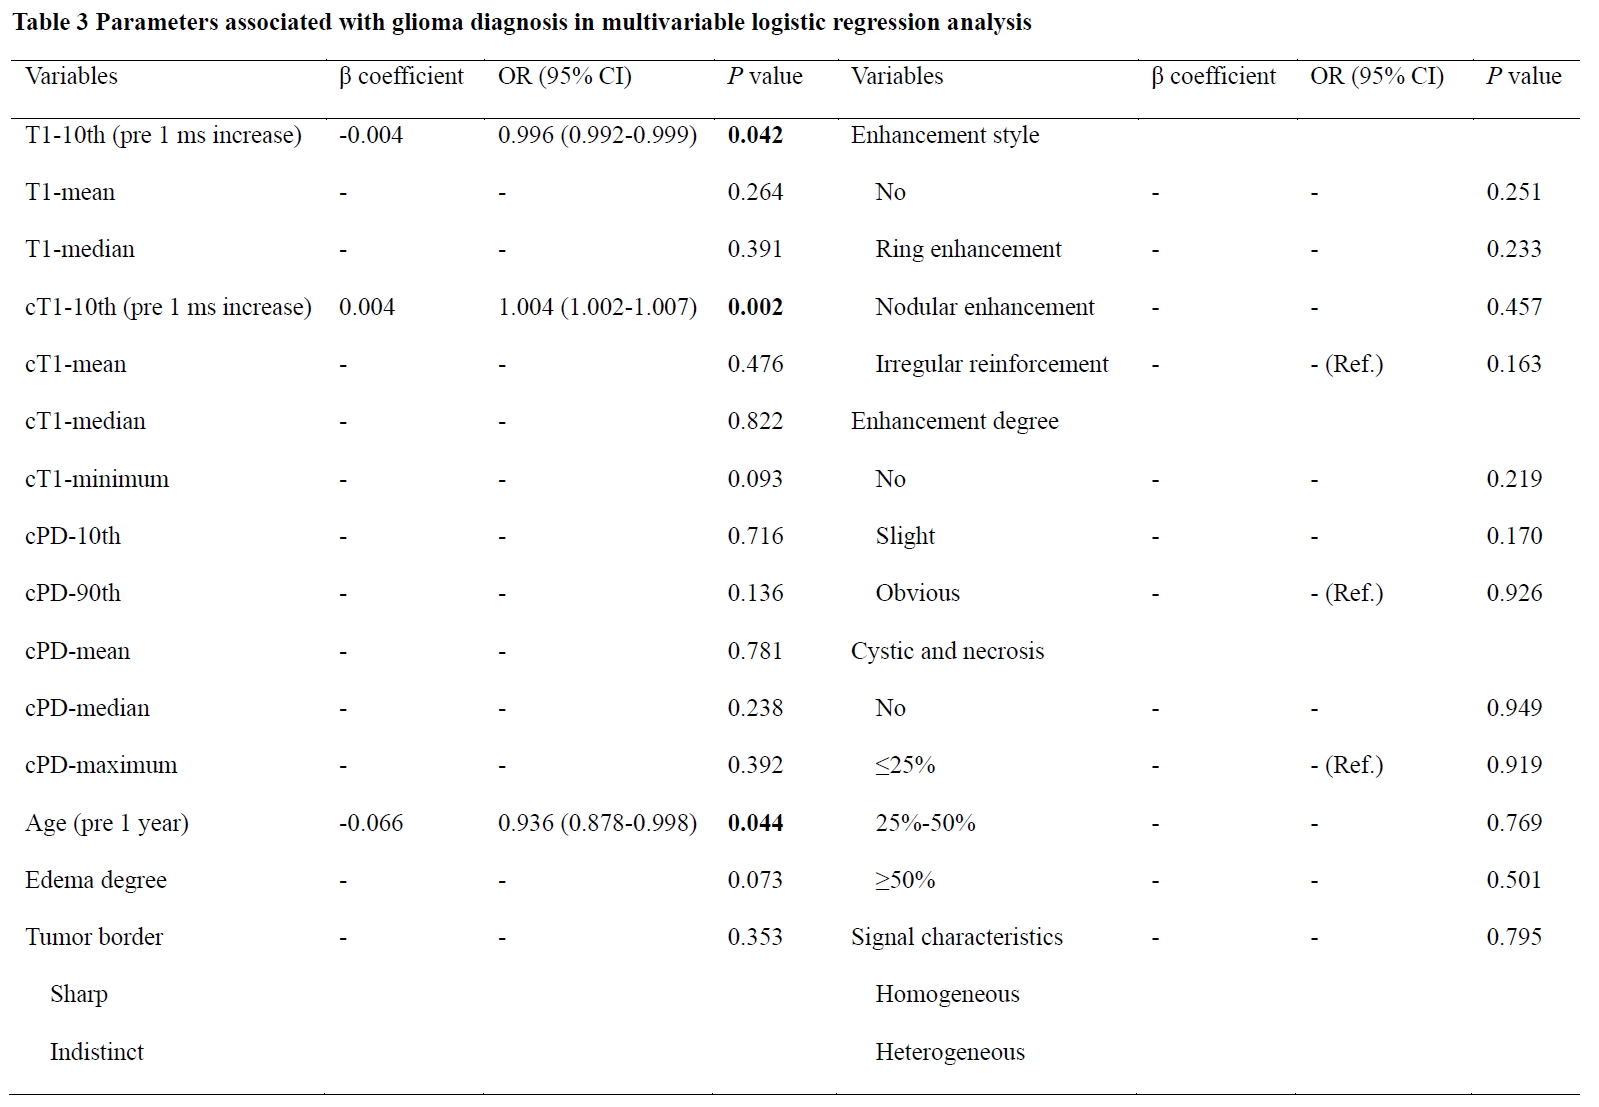
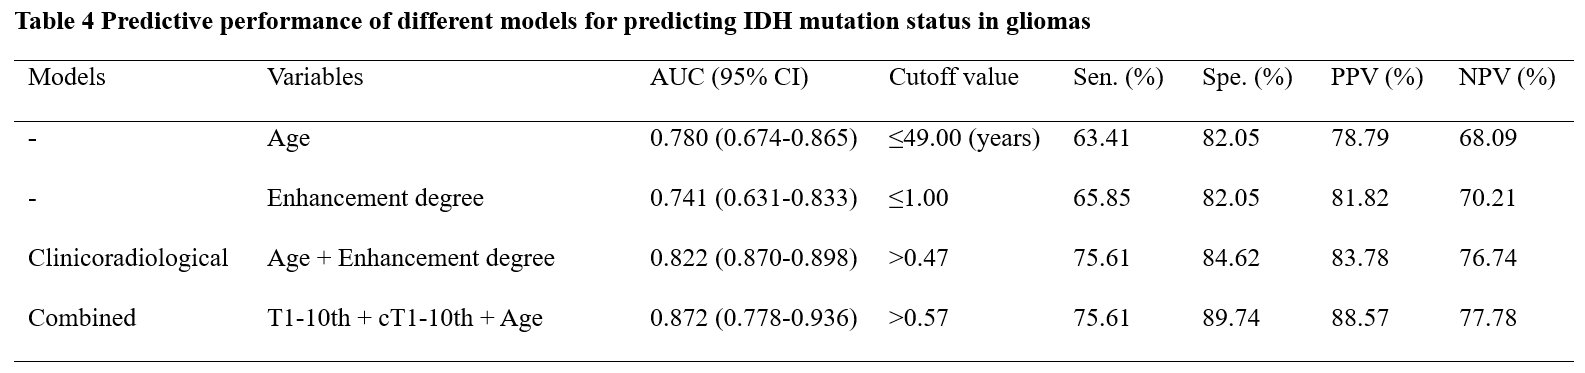
Table 1 illustrates the clinical and radiological features of the 80 patients enrolled in this study. Table 2 shows the histogram metrics with statistically significant differences between the two groups along with their ROC analysis results. The multivariate logistic analysis selected age and enhancement style to develop the clinicoradiological model. Table 1 summarizes the results of the univariate and multivariate analyses of clinical and radiological features between groups. The multivariate logistic regression identified T1-10th, cT1-10th, and age as significant predictors of IDH-M astrocytoma, as shown in Table 3. The combination of the above independent predictors established the combined model. Table 4 presents the diagnostic performance for age, enhancement degree, and prediction models. The clinicoradiological model for IDH mutation status prediction is superior to enhancement degree (P=0.017), but not significantly better than age (P=0.158). Table 4 shows that the combined model has the best diagnostic performance among all models and variables, followed by the clinicoradiological model (P=0.035).Discussion
Investigating an effective and noninvasive technique for distinguishing IDH mutation status between astrocytoma and glioblastoma is crucial for tailoring treatment and prognosis evaluation. Our results indicate that the histogram metrics derived from synthetic MRI were better indicators of potential tumor heterogeneity and aggressive tumor biology. Notably, age demonstrated significant predictive strength and can be obtained preoperatively (6), making its inclusion in the combined model a common strategy. Synthetic MRI does not require consideration of potential misregistration between contrast-weighted images and quantification maps caused by motion during acquisition, as all the images and maps were obtained from the same raw data acquired in once scan. Furthermore, “hotspot” analysis alone fails to provide a comprehensive assessment of the spatial heterogeneity of tumor histological features. To better reflect the heterogeneity of lesion, the histogram analysis of whole-tumor may provide a more objective measure.Conclusion
The histogram metrics derived from synthetic MRI are capable of quantifying the distribution of whole-tumor relaxometry and proton density, which associated with IDH mutation in gliomas. Combined model yields better predictive performance in distinguishing IDH mutation status between astrocytoma and glioblastoma.Acknowledgements
No acknowledgement found.References
1. van den Bent MJ, Tesileanu CMS, Wick W, Sanson M, Brandes AA, Clement PM, et al. Adjuvant and concurrent temozolomide for 1p/19q non-co-deleted anaplastic glioma (CATNON; EORTC study 26053-22054): second interim analysis of a randomised, open-label, phase 3 study. Lancet Oncol. 2021;22:813-823.
2. Weller M, van den Bent M, Preusser M, Le Rhun E, Tonn JC, Minniti G, et al. EANO guidelines on the diagnosis and treatment of diffuse gliomas of adulthood. Nat Rev Clin Oncol. 2021;18:170-186.
3. Cancer Genome Atlas Research Network; Brat DJ, Verhaak RG, Aldape KD, Yung WK, Salama SR, et al. Comprehensive, Integrative Genomic Analysis of Diffuse Lower-Grade Gliomas. N Engl J Med. 2015;372:2481-2498.
4. Fujita S, Hagiwara A, Aoki S, Abe O. Synthetic MRI and MR fingerprinting in routine neuroimaging protocol: What's the next step? J Neuroradiol. 2020;47:134-135.
5. Liu S, Meng T, Russo C, Di Ieva A, Berkovsky S, Peng L, Dou W, Qian L. Brain volumetric and fractal analysis of synthetic MRI: A comparative study with conventional 3D T1-weighted images. Eur J Radiol. 2021;141:109782.
6. Reuss DE, Mamatjan Y, Schrimpf D, Capper D, Hovestadt V, Kratz A, Sahm F, Koelsche C, Korshunov A, Olar A, Hartmann C, Reijneveld JC, Wesseling P, Unterberg A, Platten M, Wick W, Herold-Mende C, Aldape K, von Deimling A. IDH mutant diffuse and anaplastic astrocytomas have similar age at presentation and little difference in survival: a grading problem for WHO. Acta Neuropathol. 2015;129:867-873.
Figures

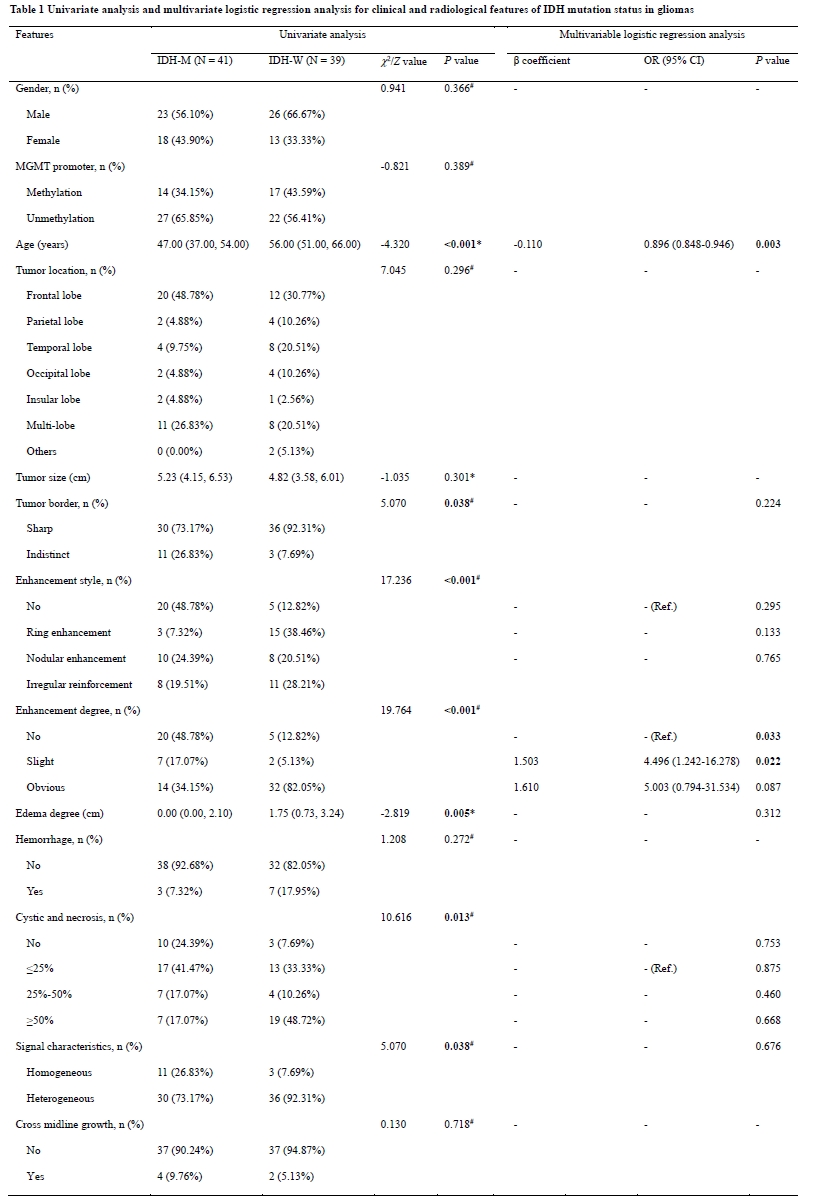
*P value represents the comparison results of IDH-M and IDH-W gliomas using the t-test analysis.
#P value represents the comparison results of IDH-M and IDH-W gliomas using the non-parametric Mann-Whitney U-test.
OR, odds ratio; CI, confidence interval; MGMT, Oxygen 6-methylguanine-DNA methyltransferase; Ref., reference.
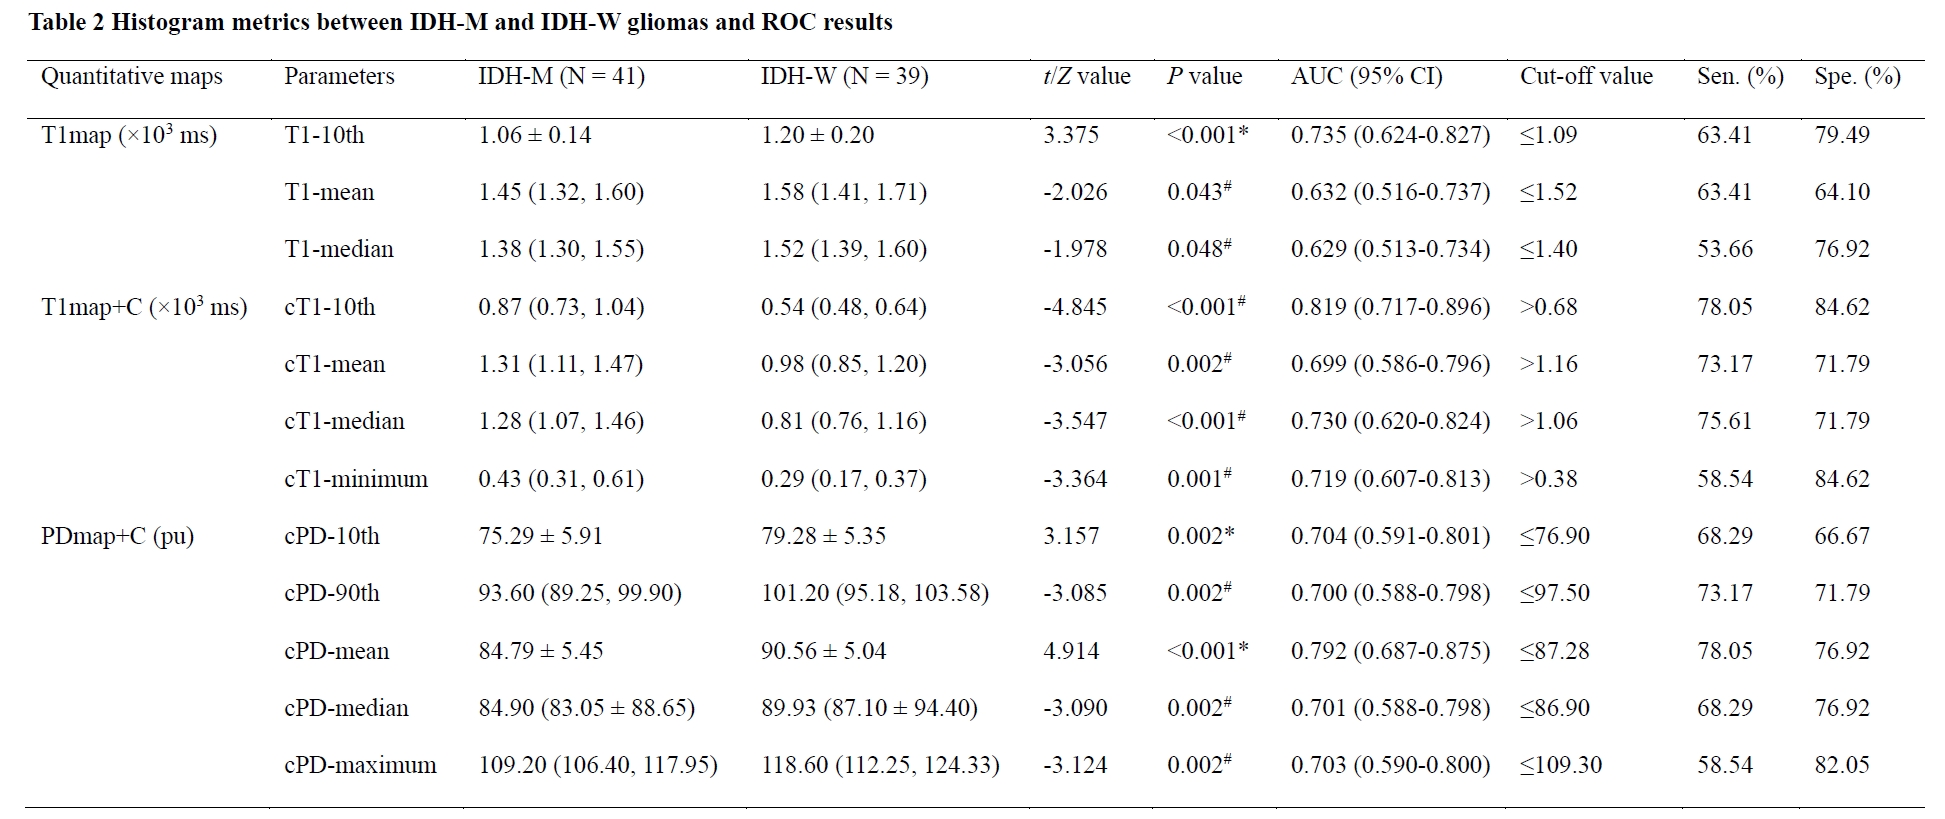
*P value represents the comparison results of IDH-M and IDH-W gliomas using the t-test analysis.
#P value represents the comparison results of IDH-M and IDH-W gliomas using the non-parametric Mann-Whitney U-test.
AUC, area under the curve; CI, confidence interval; Sen., sensitivity; Spe., specificity; PPV, positive predictive value; NPV, negative predictive value; 10th, 10th percentile; 90th, 90th percentile; cT1, post-contrast T1; cPD, post-contrast PD.