0368
A precise location comparison of SOX2 positive glioma invasion and conventional MP-MRI signatures at autopsy1Medical College of Wisconsin, Milwaukee, WI, United States
Synopsis
Keywords: Tumors (Post-Treatment), Tumor, glioma, neuro-oncology
Motivation: SOX2 is a marker of pluripotency that highlights tumor invasion beyond gross histological signatures, but the imaging characteristics of pluripotent tumor areas are unknown.
Goal(s): Do conventional imaging signatures deliniate SOX2 positive staining tumor cell regions?
Approach: This study compared imaging data from 22 glioma patients to aligned SOX2 autopsy tissue samples.
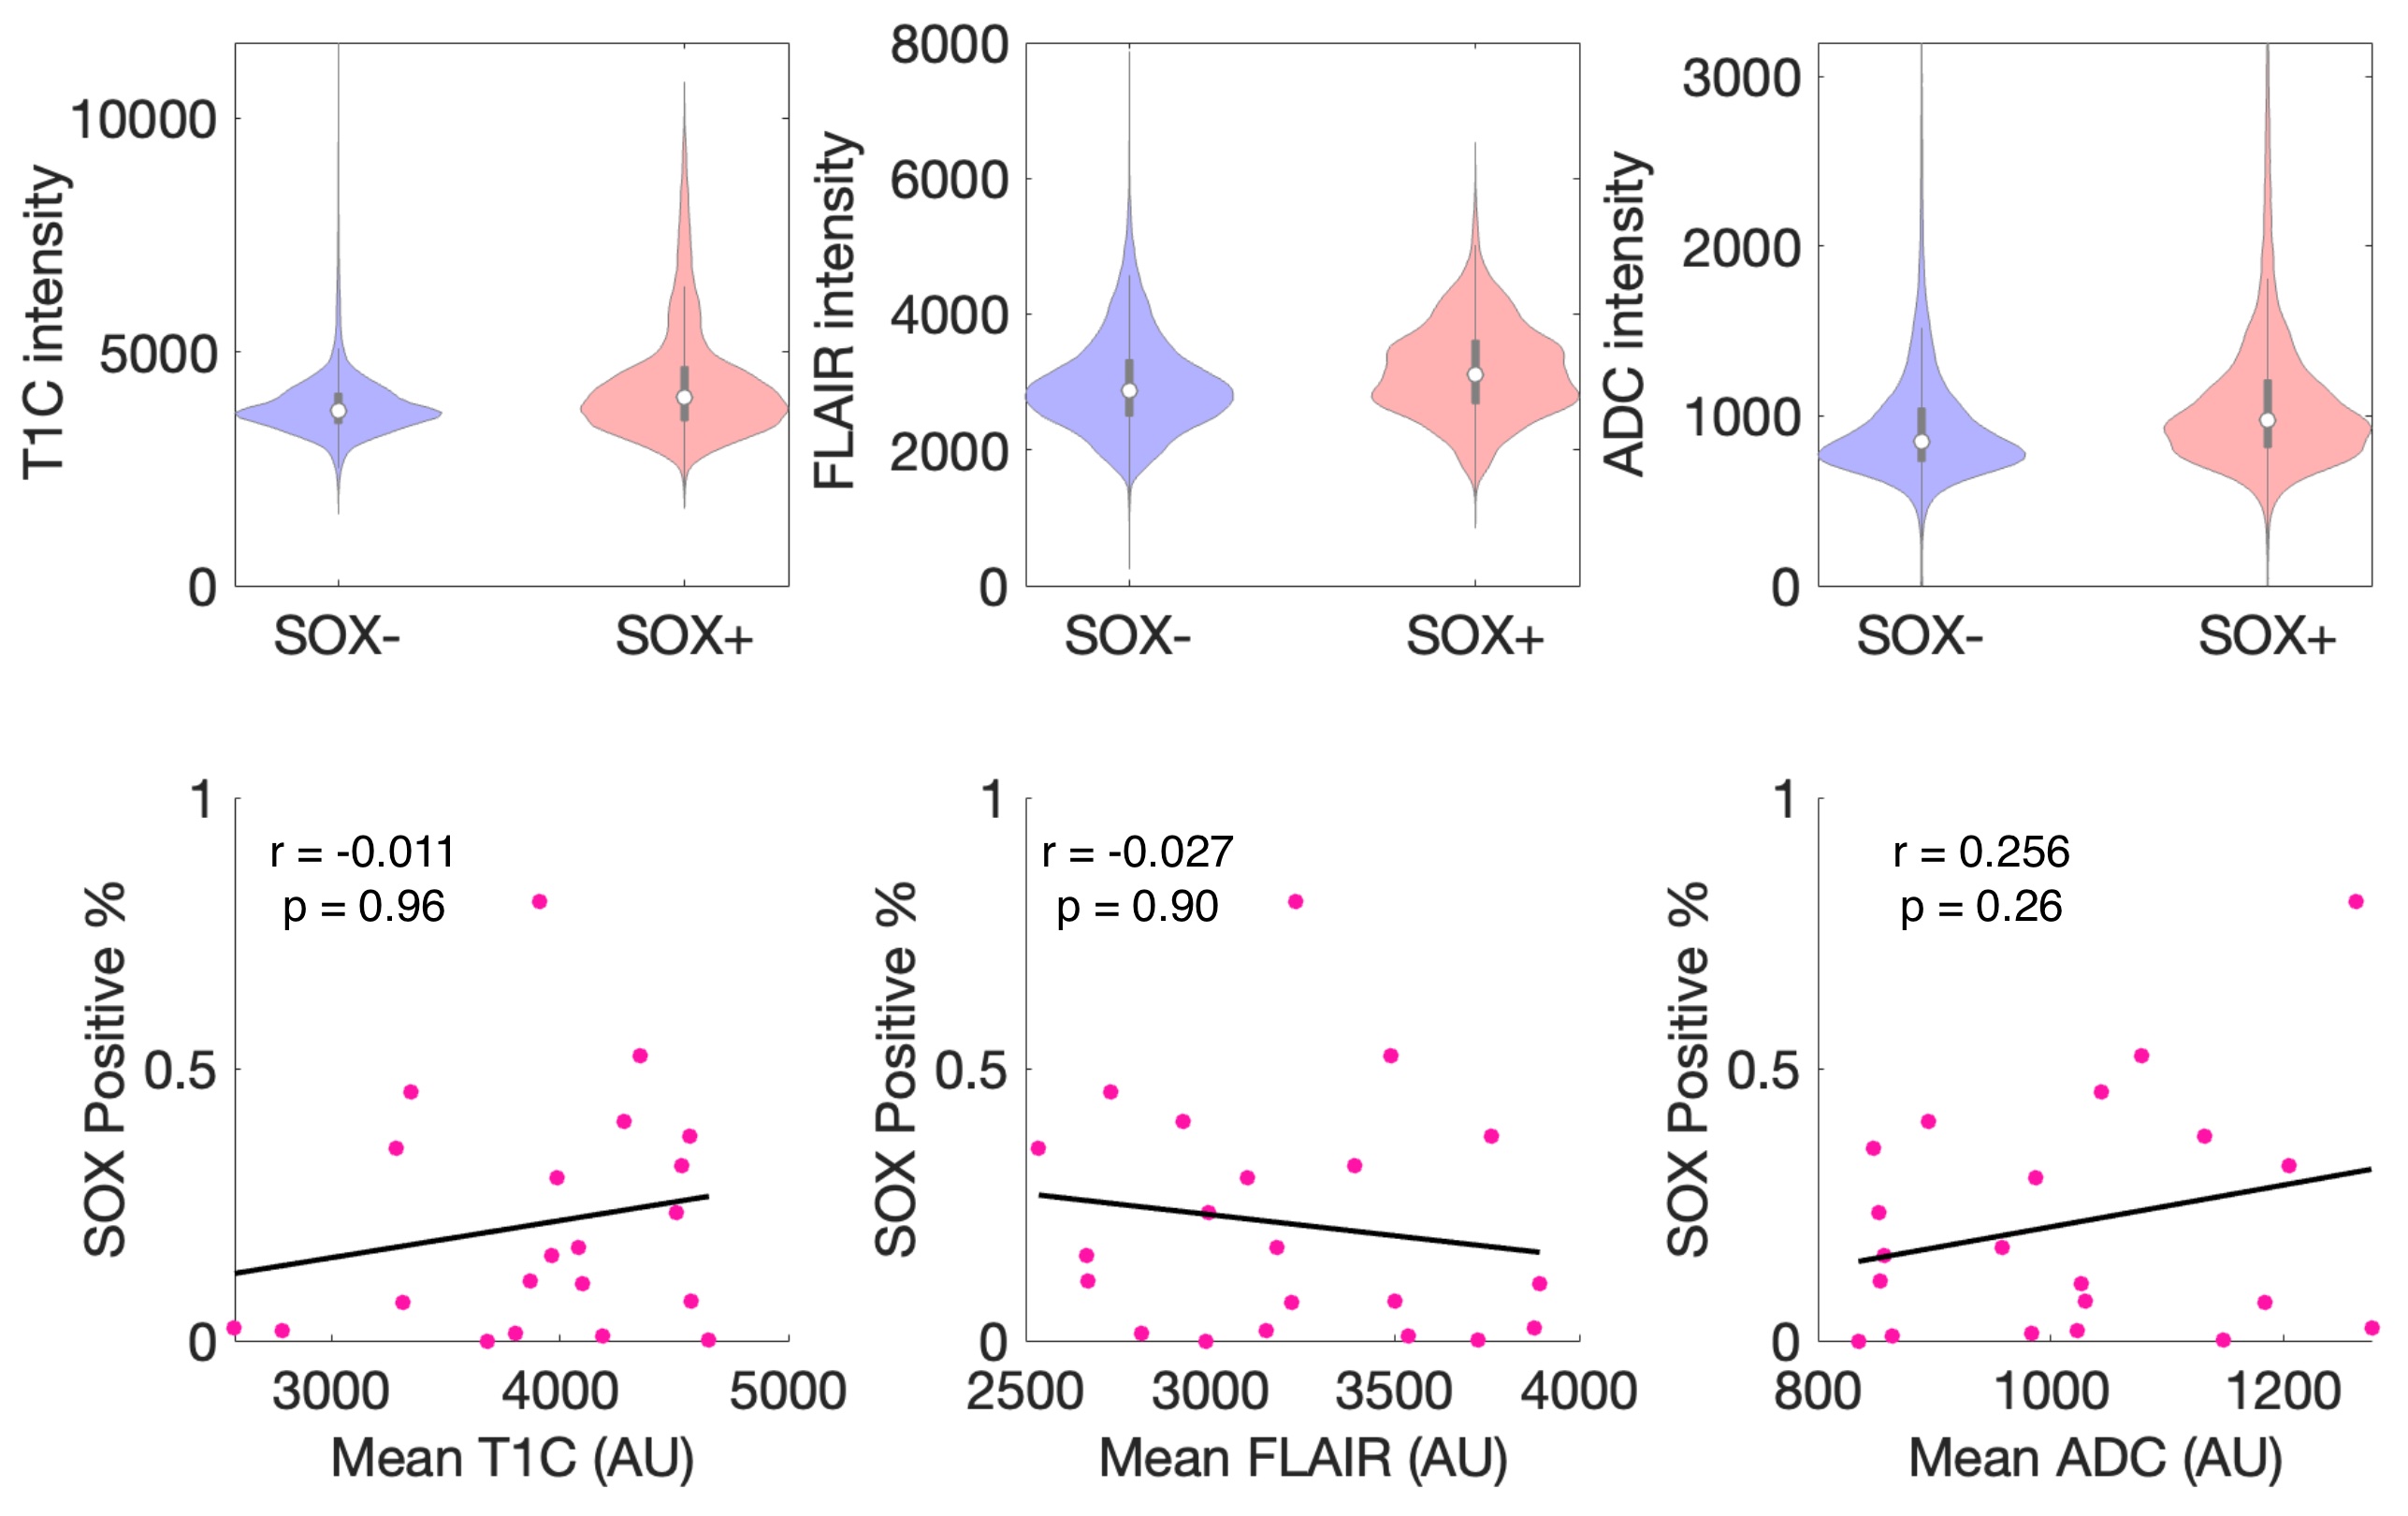
Results: SOX2-positive regions were often present beyond the imaging-defined tumor mass, with a positive but not collinear association between SOX2 and cell density across most. However, MR intensity distributions did not effectively distinguish SOX2 positivity.
Impact: These results highlight a novel signature of tumor presence that exists well-beyond the imaging-defined margin and is not readily detectable via conventional imaging. These areas are spared treatment and require new technological developments to detect non-invasively.
Introduction
Gliomas are a highly aggressive form of central nervous system tumor, with higher grades associated with a median survival of 18 months(1). These tumors are comprised of substantial pathological heterogeneity, making it difficult to both identify tumor from standard histological staining as well as localize tumor presence non-invasively using multiparametric MRI. Sex-determining region Y-box 2 (SOX2) is a molecular marker of pluripotency in glial cells, and thus has shown promise for identifying suspected tumor invasion prior to the presence of obvious histological abnormalities such as hypercellularity and pseudo-palisading necrosis(2). No study to date has compared the distribution of SOX2+ cells with clinical MP-MRI. The inability for MP-MRI to capture the full extent of morphologically identifiable tumor presence means areas of invisible tumor invasion may be spared critical treatment. Therefore, this study tested the hypothesis that MP-MRI based intensity features can identify SOX2 positivity using autopsy tissue samples taken from both contrast-enhancing and non-enhancing regions as ground truth.Methods
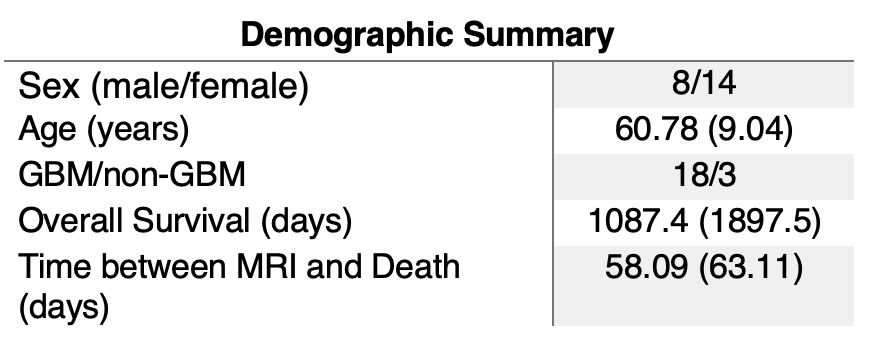
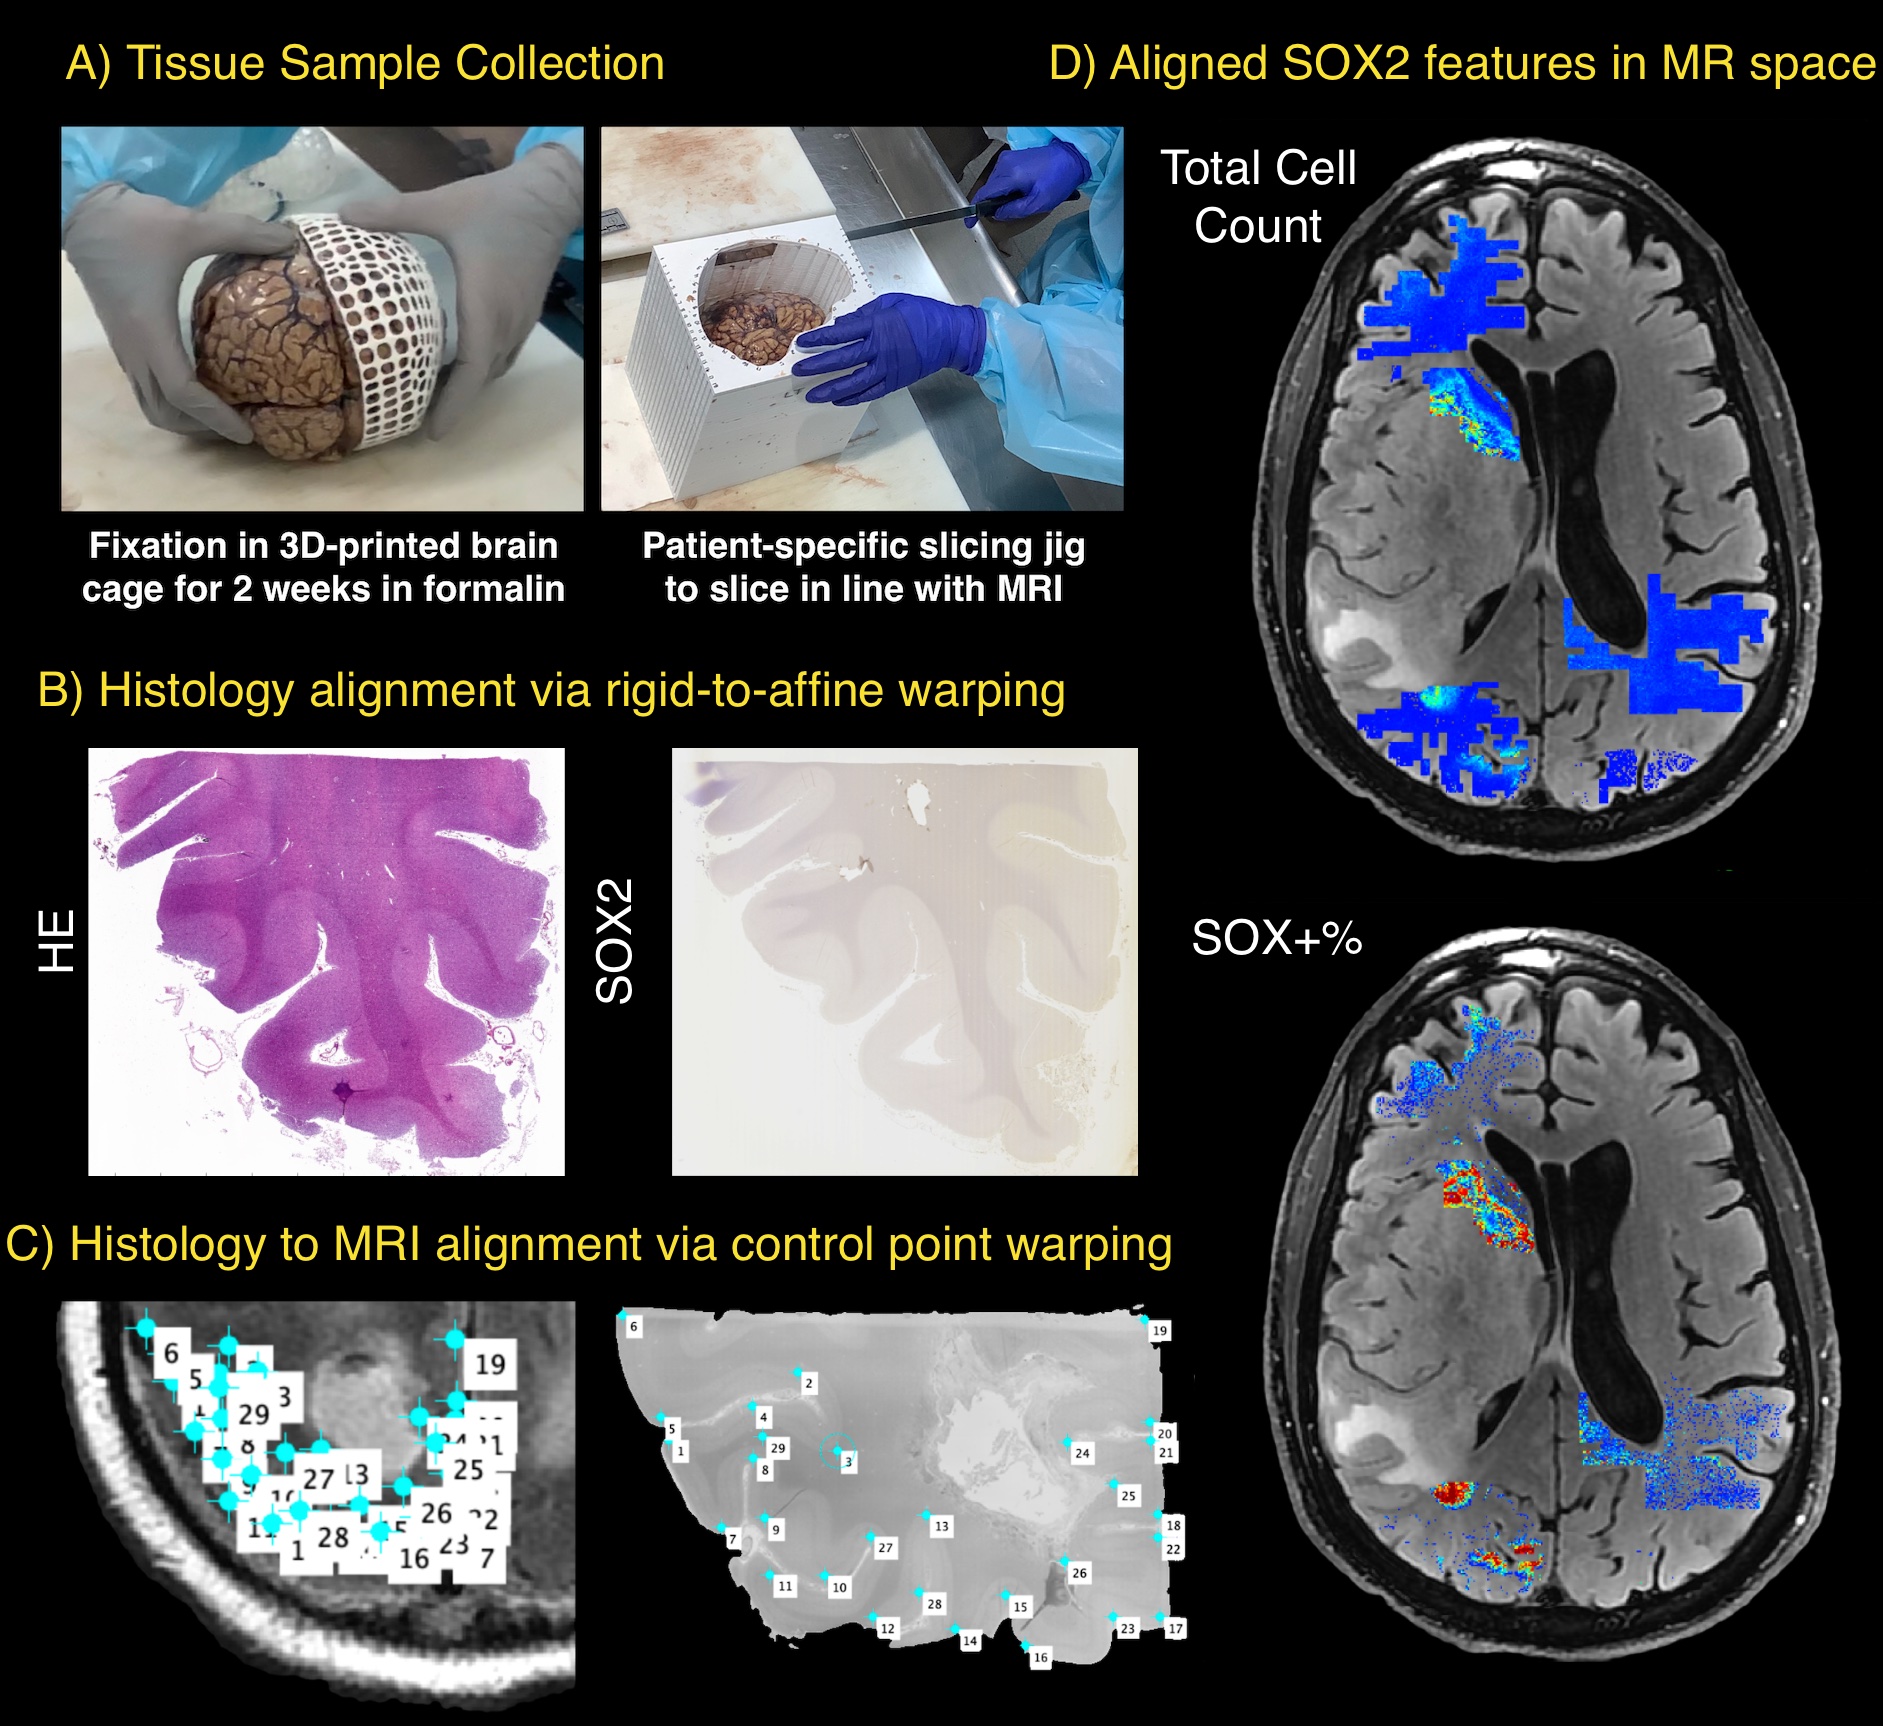
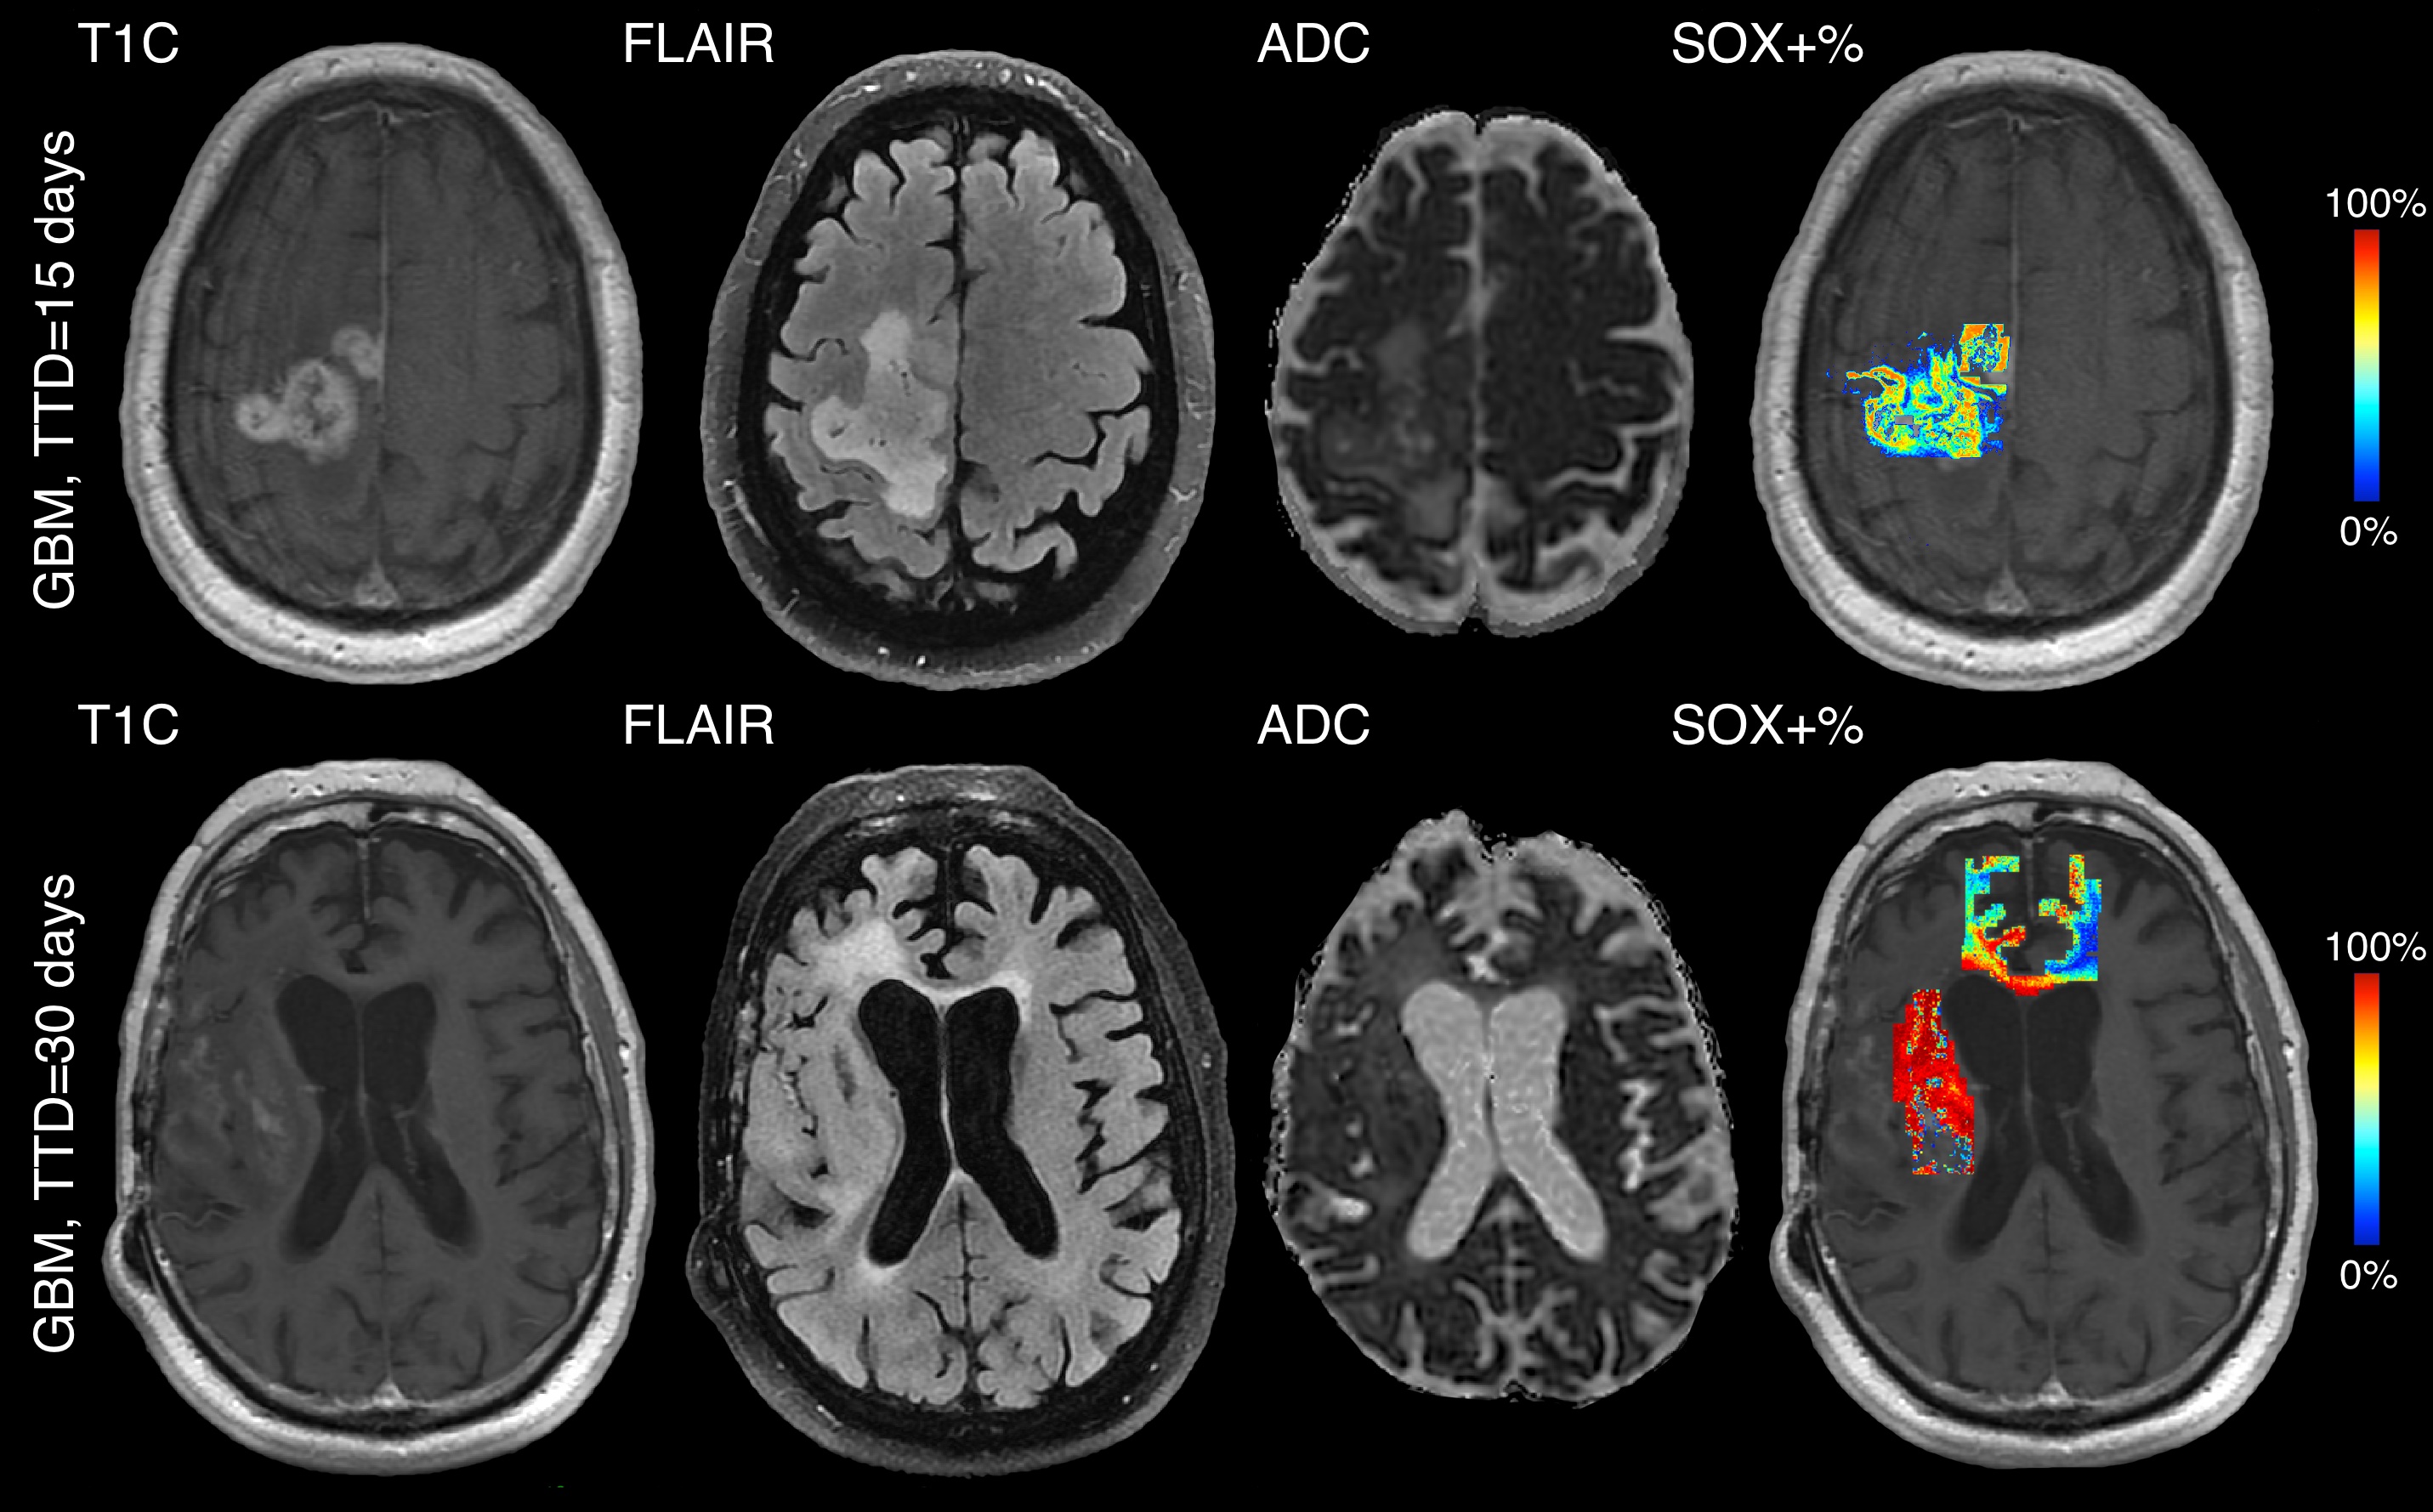
This study used the final MRI scan and pathology data from 22 glioma patients who underwent autopsy (Figure 1). An overall depiction of the study methodology is presented in Figure 2. The pre- and post-contrast T1 (T1, T1C), FLAIR, and ADC images were collected from each patient’s final imaging scan prior to death, which were co-registered to the FLAIR image, and non-ADC scans were intensity normalized. Following brain extraction, patient-specific 3D printed brain cages were employed to prevent tissue distortion during 2-week formalin fixation, and additional custom slicing jigs were 3D printed to slice the brain axially in line with the slices of the MRI. A total of 79 large-format tissue samples were taken across subjects in areas of suspected tumor presence based on both MRI and gross anatomical findings, as well as from nearby regions suspected to be devoid of tumor presence, which were then processed and stained for hematoxylin and eosin (HE) and SOX2 immuno-histochemistry (IHC). SOX2 IHC slides were computationally aligned to the HE images using a two-stage rigid-to-affine tissue warping, with visual inspection performed to ensure anatomical similarity. A previously published in-house software was used to align digitized HE images to the MRI using non-linear control point warping, and regions of interest were drawn to exclude both MR (e.g., motion) and pathological (e.g., rips, folds) artifacts. The subject level proportion of SOX2 positivity (SOX+; no presence=SOX-) occurring outside T1C enhancement was computed to assess how often pluripotent development occurs outside of the primary tumor mass, as well as the subject level correlation between SOX2 positivity and total cell count to assess the relationship between SOX2 positivity and hypercellularity, a marker of tumor presence on standard histology. Overall voxelwise MR intensity distributions for SOX+ and SOX- were plotted, and the association between mean intensity and SOX2 positivity per subject was assessed using Pearson correlations. Voxelwise results are not presented with p-values due to the large number of observations artificially inflating p-values to artificially low values (p<1e-10).Results:
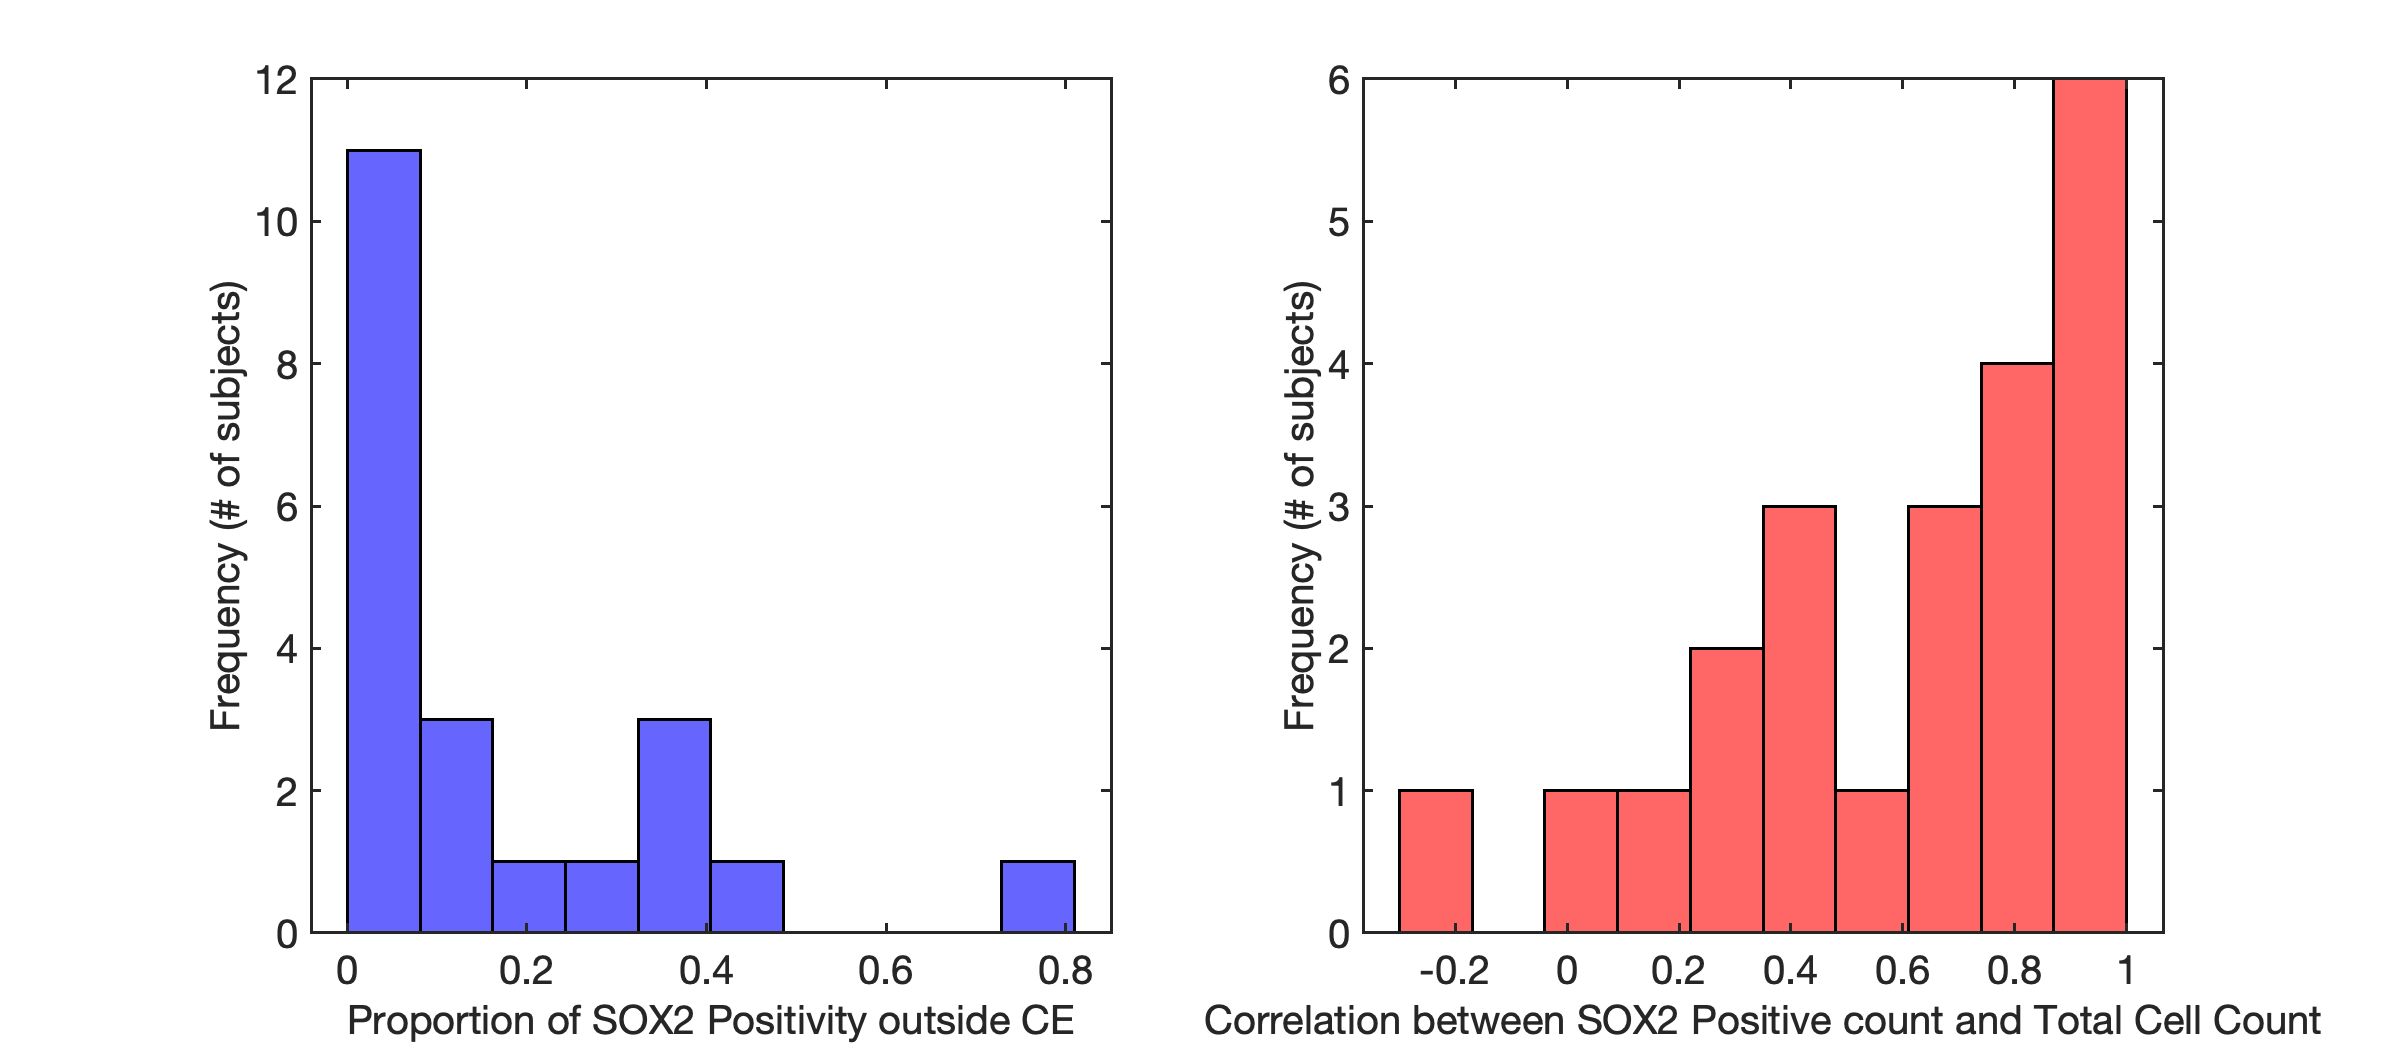
Regions with SOX+ cells outside of contrast enhancement were observed in 18 of 22 cases with an average of 17.6% (std=20.6%) of SOX+ cells occurring beyond the primary tumor mass (Figure 3). The mean association between SOX+ and cell density was 0.599 (std=0.345), indicating a positive association but not collinearity across most subjects. MR intensity distributions failed to show a distinguishing pattern of differentiating SOX+ across voxelwise distributions, and SOX+ showed no association with mean intensity across all metrics (T1C r=-0.011, p=0.96, FLAIR r=-0.027, p=0.90, ADC r=0.26, p=0.26, Figure 4). Examples of confirmed SOX+ cells well beyond the contrast enhancing margin are shown in Figure 5, indicating areas of well-developed tumor that would likely be spared targeted treatment.Conclusions
This study provides the first assessment of SOX+ MP-MRI signatures in glioma, with results largely indicating that these novel tumor areas are largely invisible to MR-based signatures. Past research focused on radio-pathomic mapping of histological tumor signatures have shown promise in identifying occult tumor invasion; therefore, future research is warranted to develop models that can exploit the ability for machine learning methods to use non-visual texture features to non-invasively identify the full extent of tumor presence for directing treatment in the clinical setting.Acknowledgements
No acknowledgement found.References
(1) Ostrom QT, Bauchet L, Davis FG, Deltour I, Fisher JL, Langer CE, Pekmezci M, Schwartzbaum JA, Turner MC, Walsh KM, Wrensch MR, Barnholtz-Sloan JS. The epidemiology of glioma in adults: a "state of the science" review. Neuro Oncol. 2014 Jul;16(7):896-913. doi: 10.1093/neuonc/nou087. PMID: 24842956; PMCID: PMC4057143.
(2) Garros-Regulez L, Garcia I, Carrasco-Garcia E, Lantero A, Aldaz P,
Moreno-Cugnon L, Arrizabalaga O, Undabeitia J, Torres-Bayona S, Villanua
J, Ruiz I, Egaña L, Sampron N, Matheu A. Targeting SOX2 as a
Therapeutic Strategy in Glioblastoma. Front Oncol. 2016 Oct 24;6:222.
doi: 10.3389/fonc.2016.00222. PMID: 27822457; PMCID: PMC5075570.
Figures