0366
Optimizing early response assessment in glioblastoma using diffusion imaging on a 1.5T MR-Linac1Department of Medical Biophysics, University of Toronto, Toronto, ON, Canada, 2Department of Radiation Oncology, Sunnybrook Health Sciences Centre, Toronto, ON, Canada, 3Department of Physics, Toronto Metropolitan University, Toronto, ON, Canada, 4Division of Neurology, Department of Medicine, Sunnybrook Health Sciences Centre, Toronto, ON, Canada, 5Department of Surgery, St. Michael's Hospital, Toronto, ON, Canada, 6Physical Sciences Platform, Sunnybrook Research Institute, Toronto, ON, Canada, 7Department of Neurosurgery and Paediatric Neurosurgery, Medical University, Lublin, Poland
Synopsis
Keywords: Tumors (Post-Treatment), Cancer, Glioblastoma, apparent diffusion coefficient, response assessment
Motivation: Early response assessment for glioblastoma may be possible using regions of low apparent diffusion coefficient (low-ADC) during MRI-linear accelerator (MR-Linac) treatment, but low-ADC definition has not been optimized.
Goal(s): Optimize definition of low-ADC for correlation with progression-free survival.
Approach: We defined low-ADC regions from near-daily diffusion-weighted imaging and weekly contrast-enhanced T1-weighted imaging for 41 glioblastoma patients during MR-Linac treatment (3-6 weeks). We compared correlation strength across b-values (800 versus 2000s/mm2) and ADC thresholds (0.7 to 2.0μm2/ms).
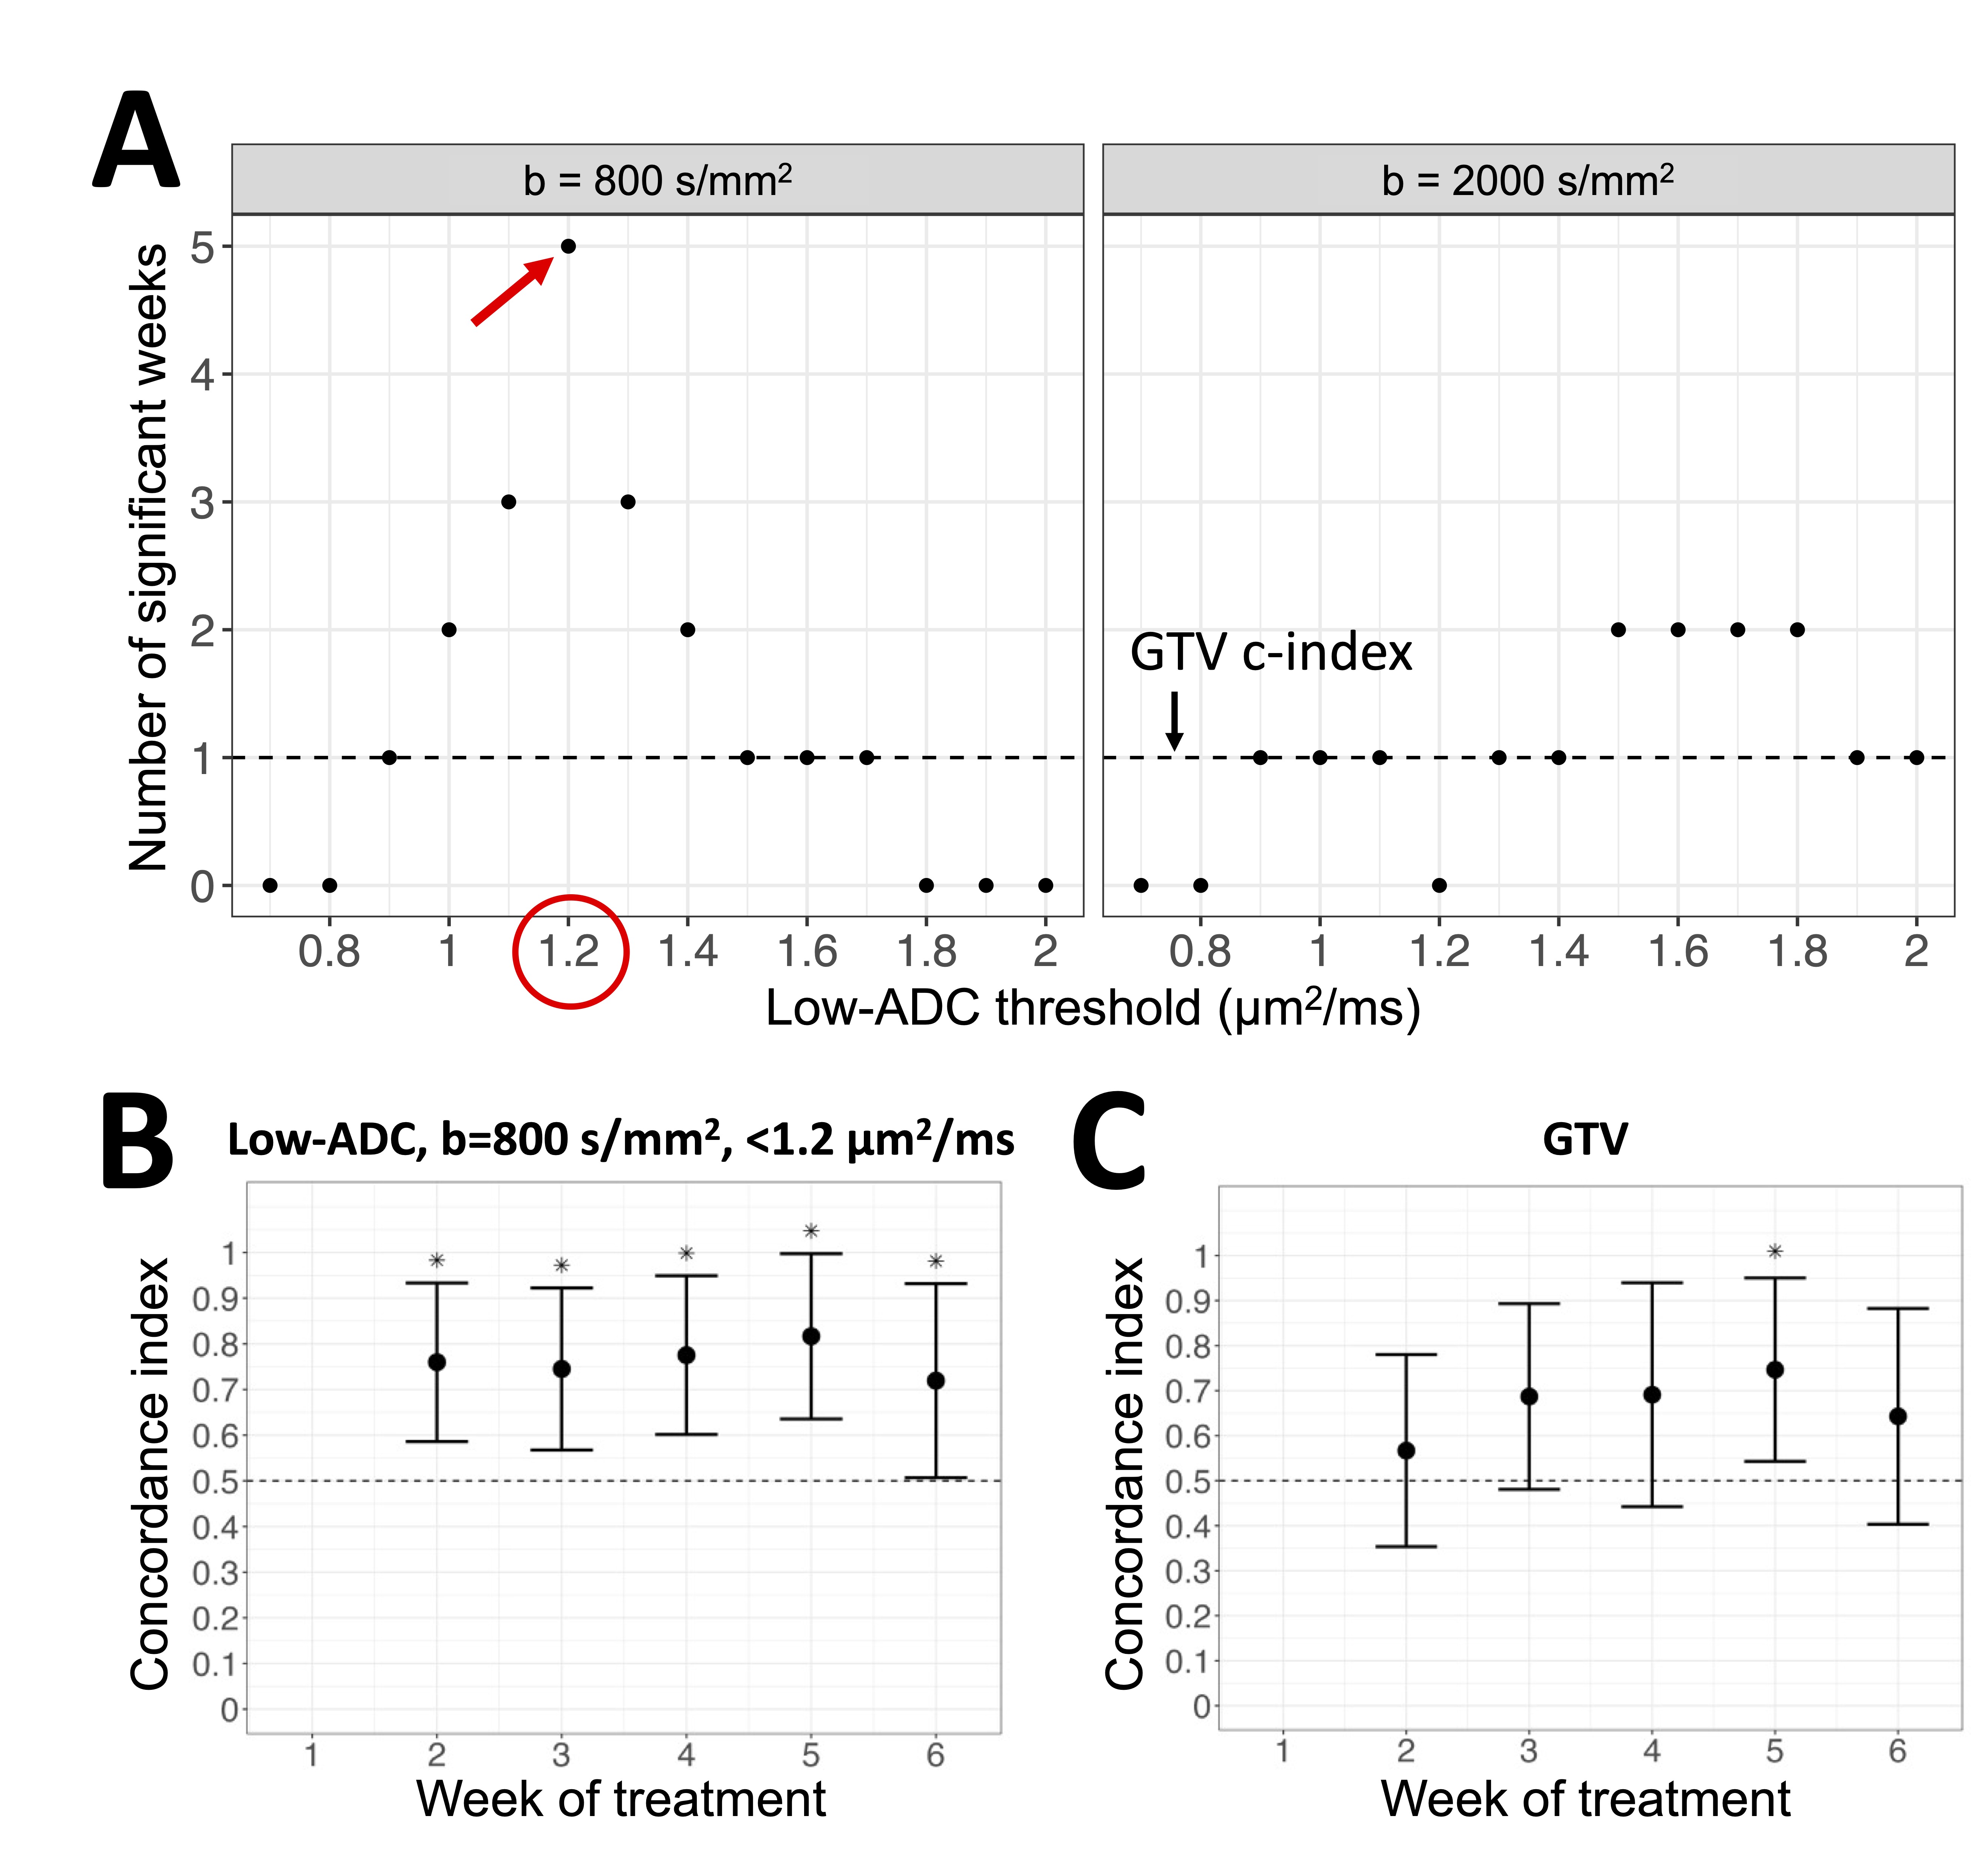
Results: The optimal b-value/threshold combination was b=800s/mm2 and 1.2μm2/ms (correlation for weeks 2-6).
Impact: We showed that early response assessment in glioblastoma during radiotherapy is possible with weekly acquisition of ADC maps and contrast-enhanced T1-weighted imaging on MR-Linacs. Low-ADC regions could serve as targets for radiotherapy dose escalation to potentially extend patient survival.
Introduction
Patients with glioblastoma, a primary brain tumor, have a median survival of only 14.6 months with standard treatment (surgery, chemoradiation).1 Survival might be extended by adaptive, dose-escalated radiotherapy with MRI-linear accelerators (MR-Linacs), but an appropriate boost target must be determined.2,3 Recently, it was shown that regions of low apparent diffusion coefficient (ADC) from MR-Linac diffusion-weighted imaging (DWI) during radiotherapy were adversely prognostic.4 Therefore, survival might be extended by dose escalation to low-ADC regions. However, the choice of low-ADC threshold was not optimized but was based on previous literature.5 Also, a standard b-value (800s/mm2) was used; high b-values (>2000s/mm2) may offer complementary information.6–8 Our objective was to optimize the definition of MR-Linac low-ADC regions across b-values and ADC thresholds for prediction of progression-free survival, using weekly adaptive recontouring of the gross tumor volume (GTV).Materials and Methods
Participants, treatment, and follow-up: Forty-one patients with glioblastoma (23 male, 18 female; median age: 60 years, range: 27-91 years) were treated with radiotherapy on a 1.5 T MR-Linac (Unity, Elekta) and temozolomide chemotherapy. Dose schedules were 40Gy/15fx (N=12), 54Gy/30fx (N=4), and 60Gy/30fx (N=25). Treatment response was evaluated at 3, 6, 12, and 24 months. Progression was defined by Response Assessment in Neuro-Oncology criteria. Progression-free survival (PFS) was defined as the time from surgery to progression of disease, or death if it occurred first. Patients were censored at their last follow-up if still alive and without progression of disease.MR imaging and contouring: DWI was acquired with a standard b-value of 800s/mm2 three to four times per week (multi-slice EPI, TR/TE=4300/80ms, voxel size=2.0⨉2.2⨉5.0mm3, FOV=240⨉240⨉155mm3) and a high b-value of 2000s/mm2 once per week (multi-slice EPI, TR/TE=4300/96ms, voxel size=4.7⨉6.5⨉5.0mm3, FOV=240⨉240⨉155mm3). T1-weighted images were acquired daily (3D MPRAGE, TR/TE=8.0/3.6ms, voxel size=1.1⨉1.1⨉2.2mm3, FOV=270⨉200⨉200mm3). Gadolinium contrast enhancement was performed weekly for 32 patients for adaptive recontouring of the GTV (enhancing tumor plus surgical cavity, NCT04726397). The remaining 9 patients were treated with a standard protocol and only received contrast at treatment simulation.
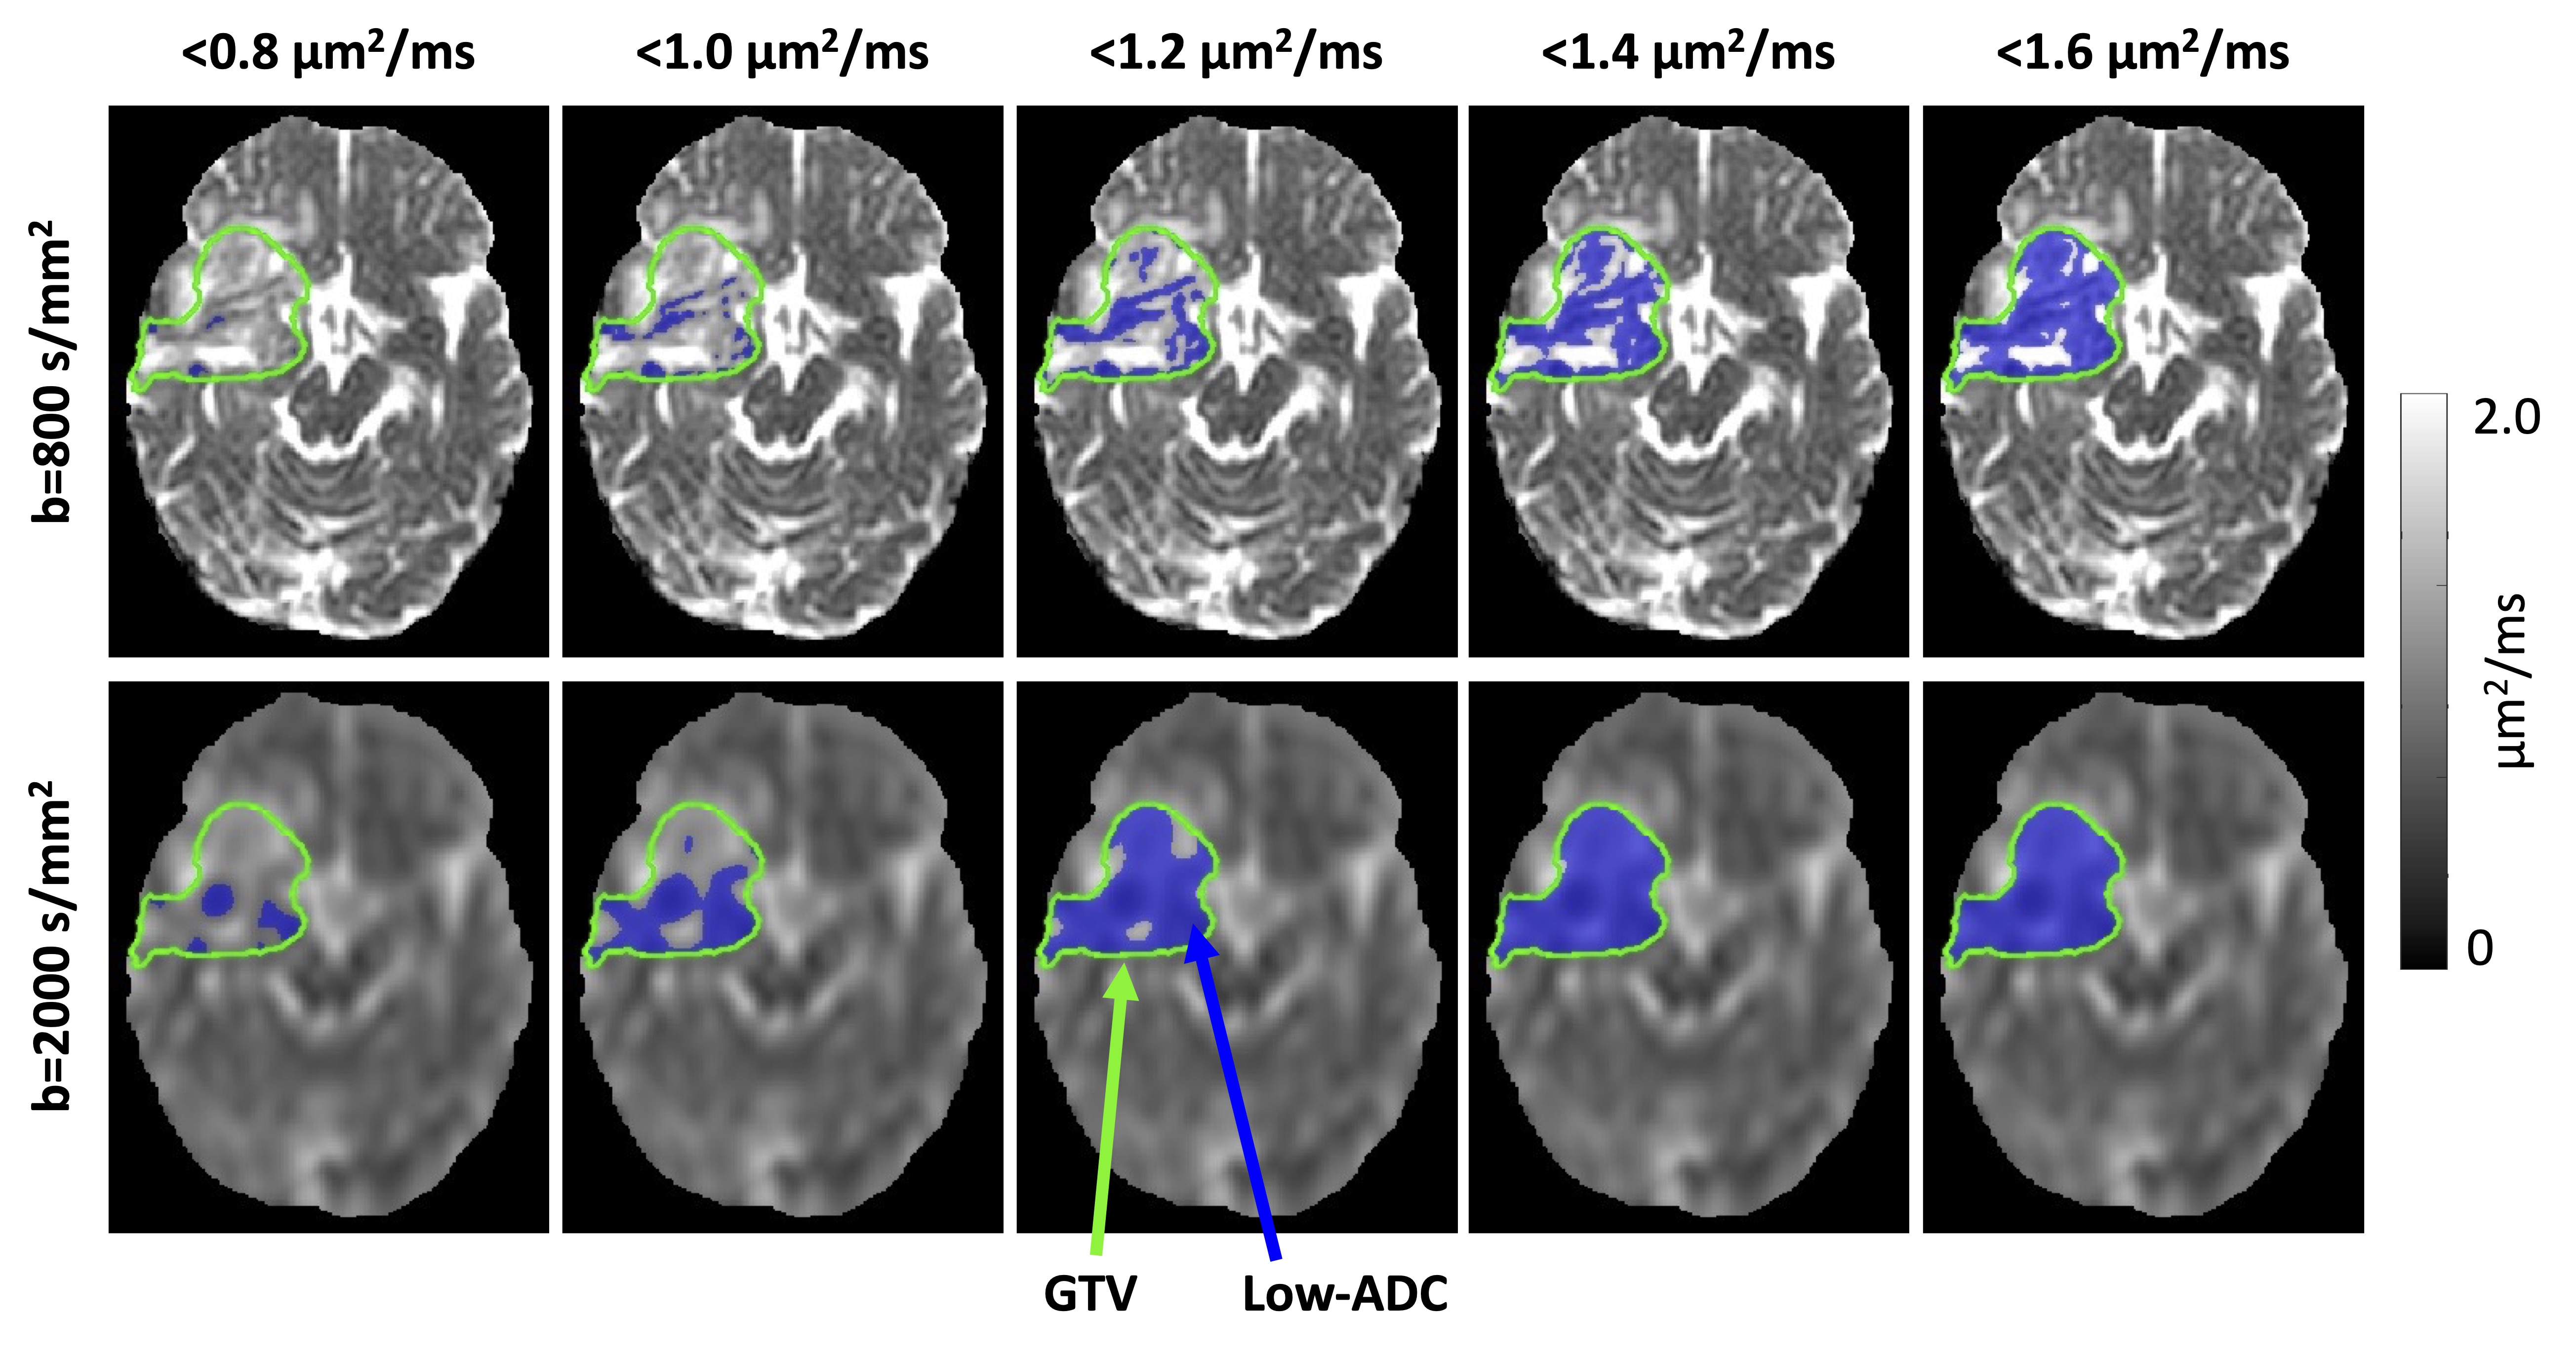
Image processing: Images were co-registered using FSL and ANTs.9–11 ADC maps were fitted from DWI using b=0 and the highest b-value (either 800 or 2000s/mm2). The low-ADC region was defined as the set of voxels within the GTV having an ADC less than a given threshold. The threshold was varied from 0.7 to 2.0μm2/ms in increments of 0.1μm2/ms (Figure 1). The most recent GTV was used (at most one week old for patients with recontouring). Image processing used MATLAB R2018b (MathWorks).
Statistics: The volumes of the low-ADC regions and GTVs were extracted. For each patient, the volumes were binned by week and averaged. The percentage change in volume relative to week 1 was computed. At each subsequent week (2 through 6), patients were stratified by the median volume change (“above” or “below”). The concordance index (c-index) was computed between this binary stratification variable and progression-free survival. P-values for the comparison of the c-index to 0.5 (no correlation) were computed (significance threshold .05).12 The predictor with the greatest number of statistically significant weeks was taken as the optimum. Statistics were done using R version 4.1.2 (R Core Team).
Results
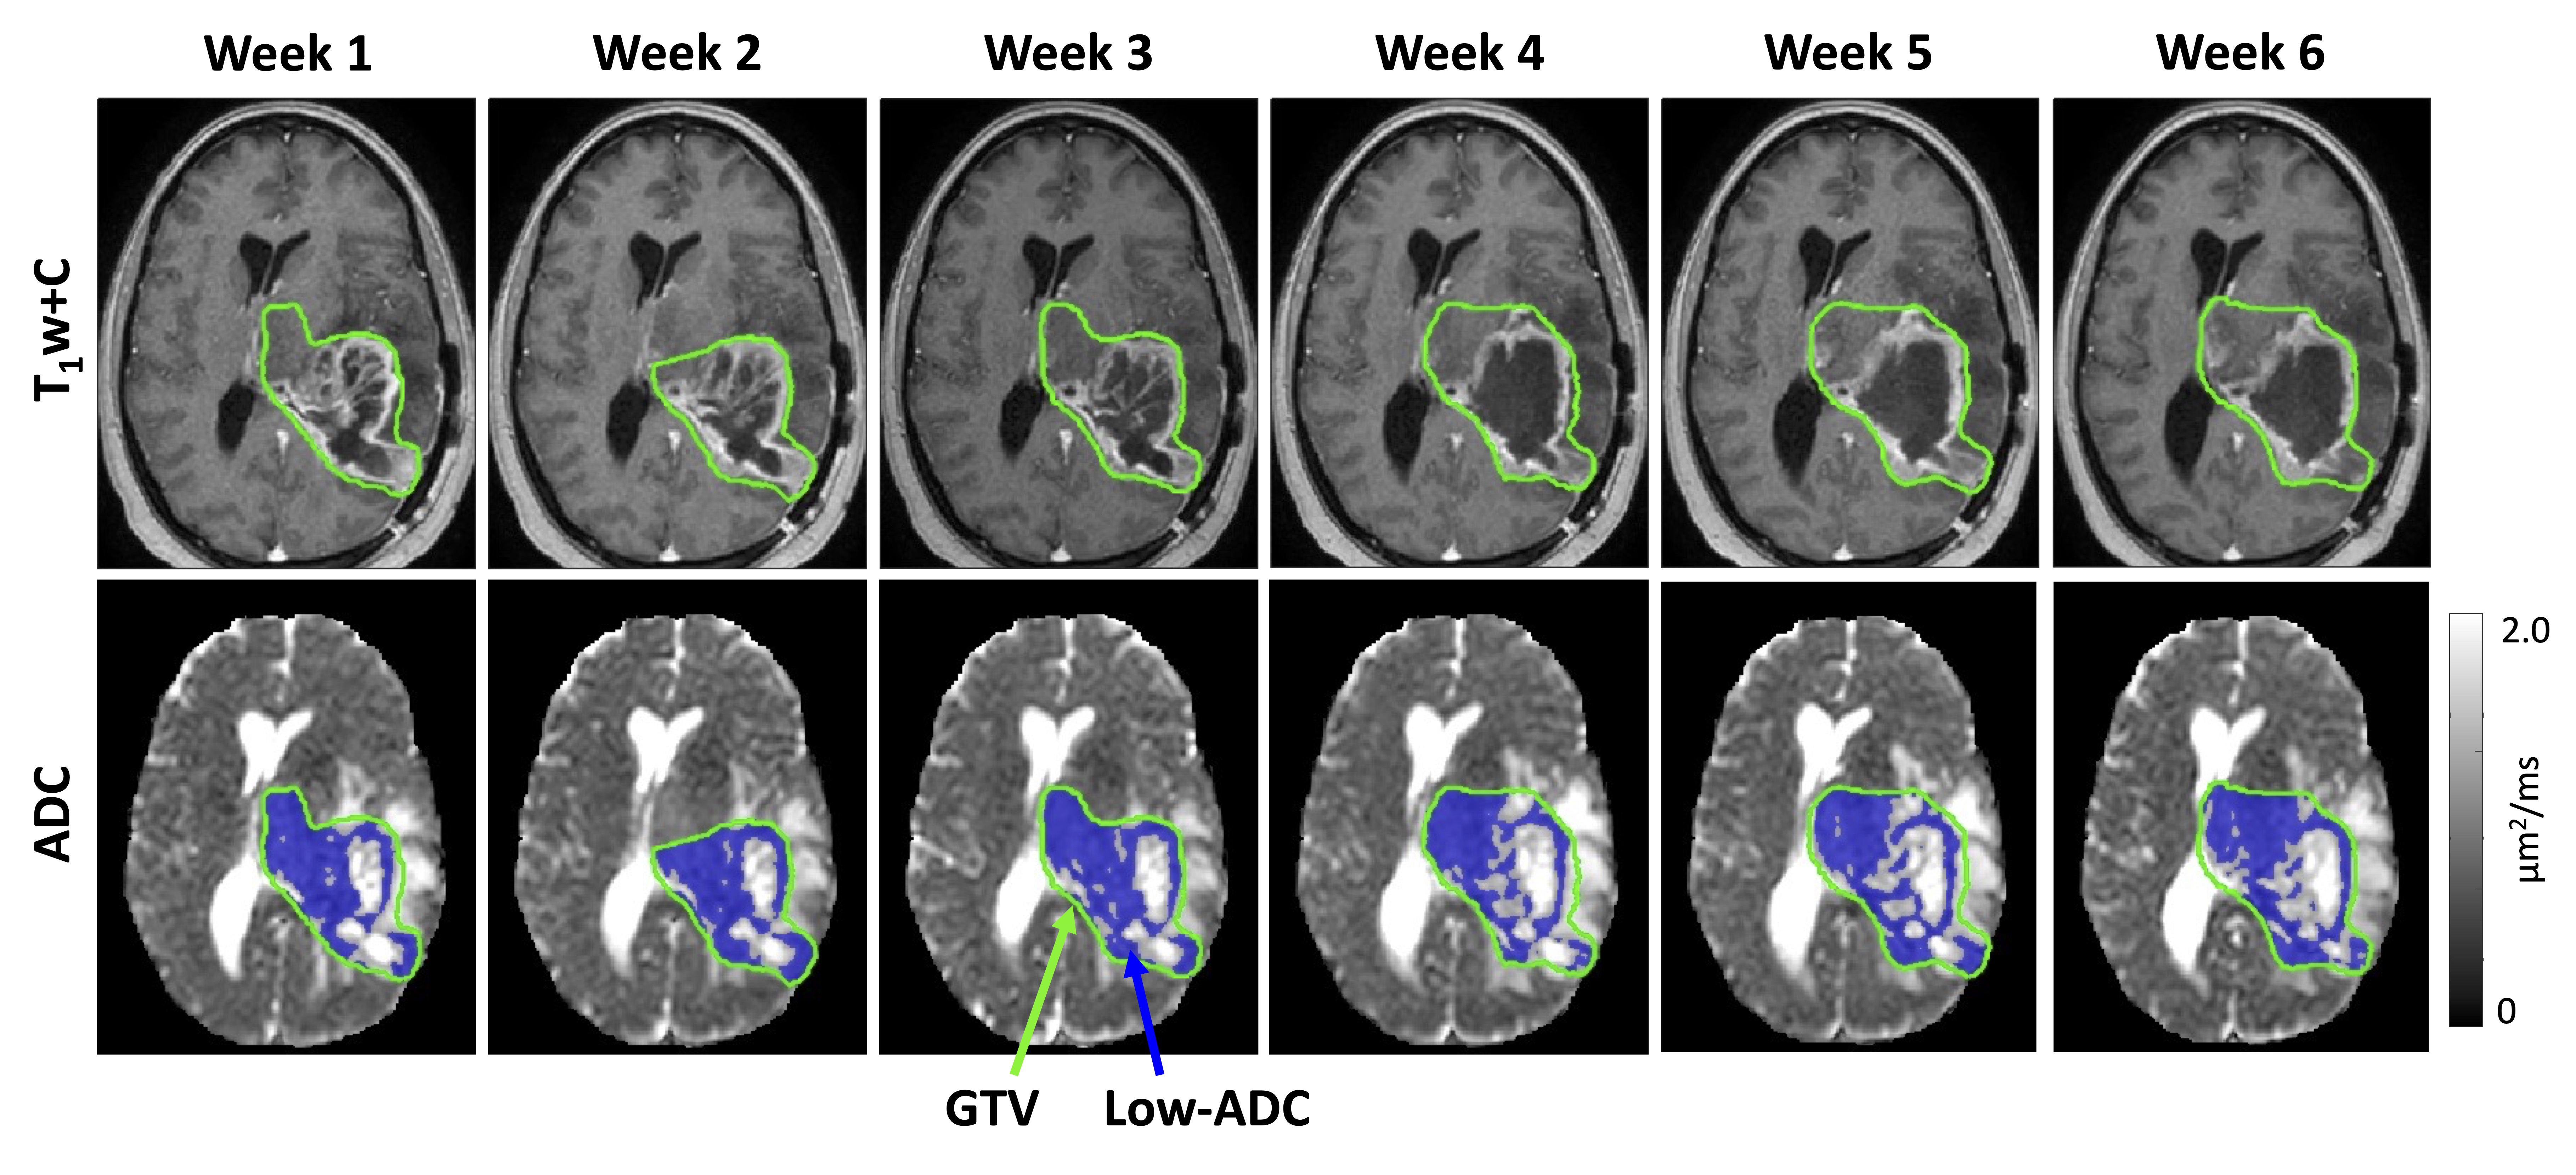
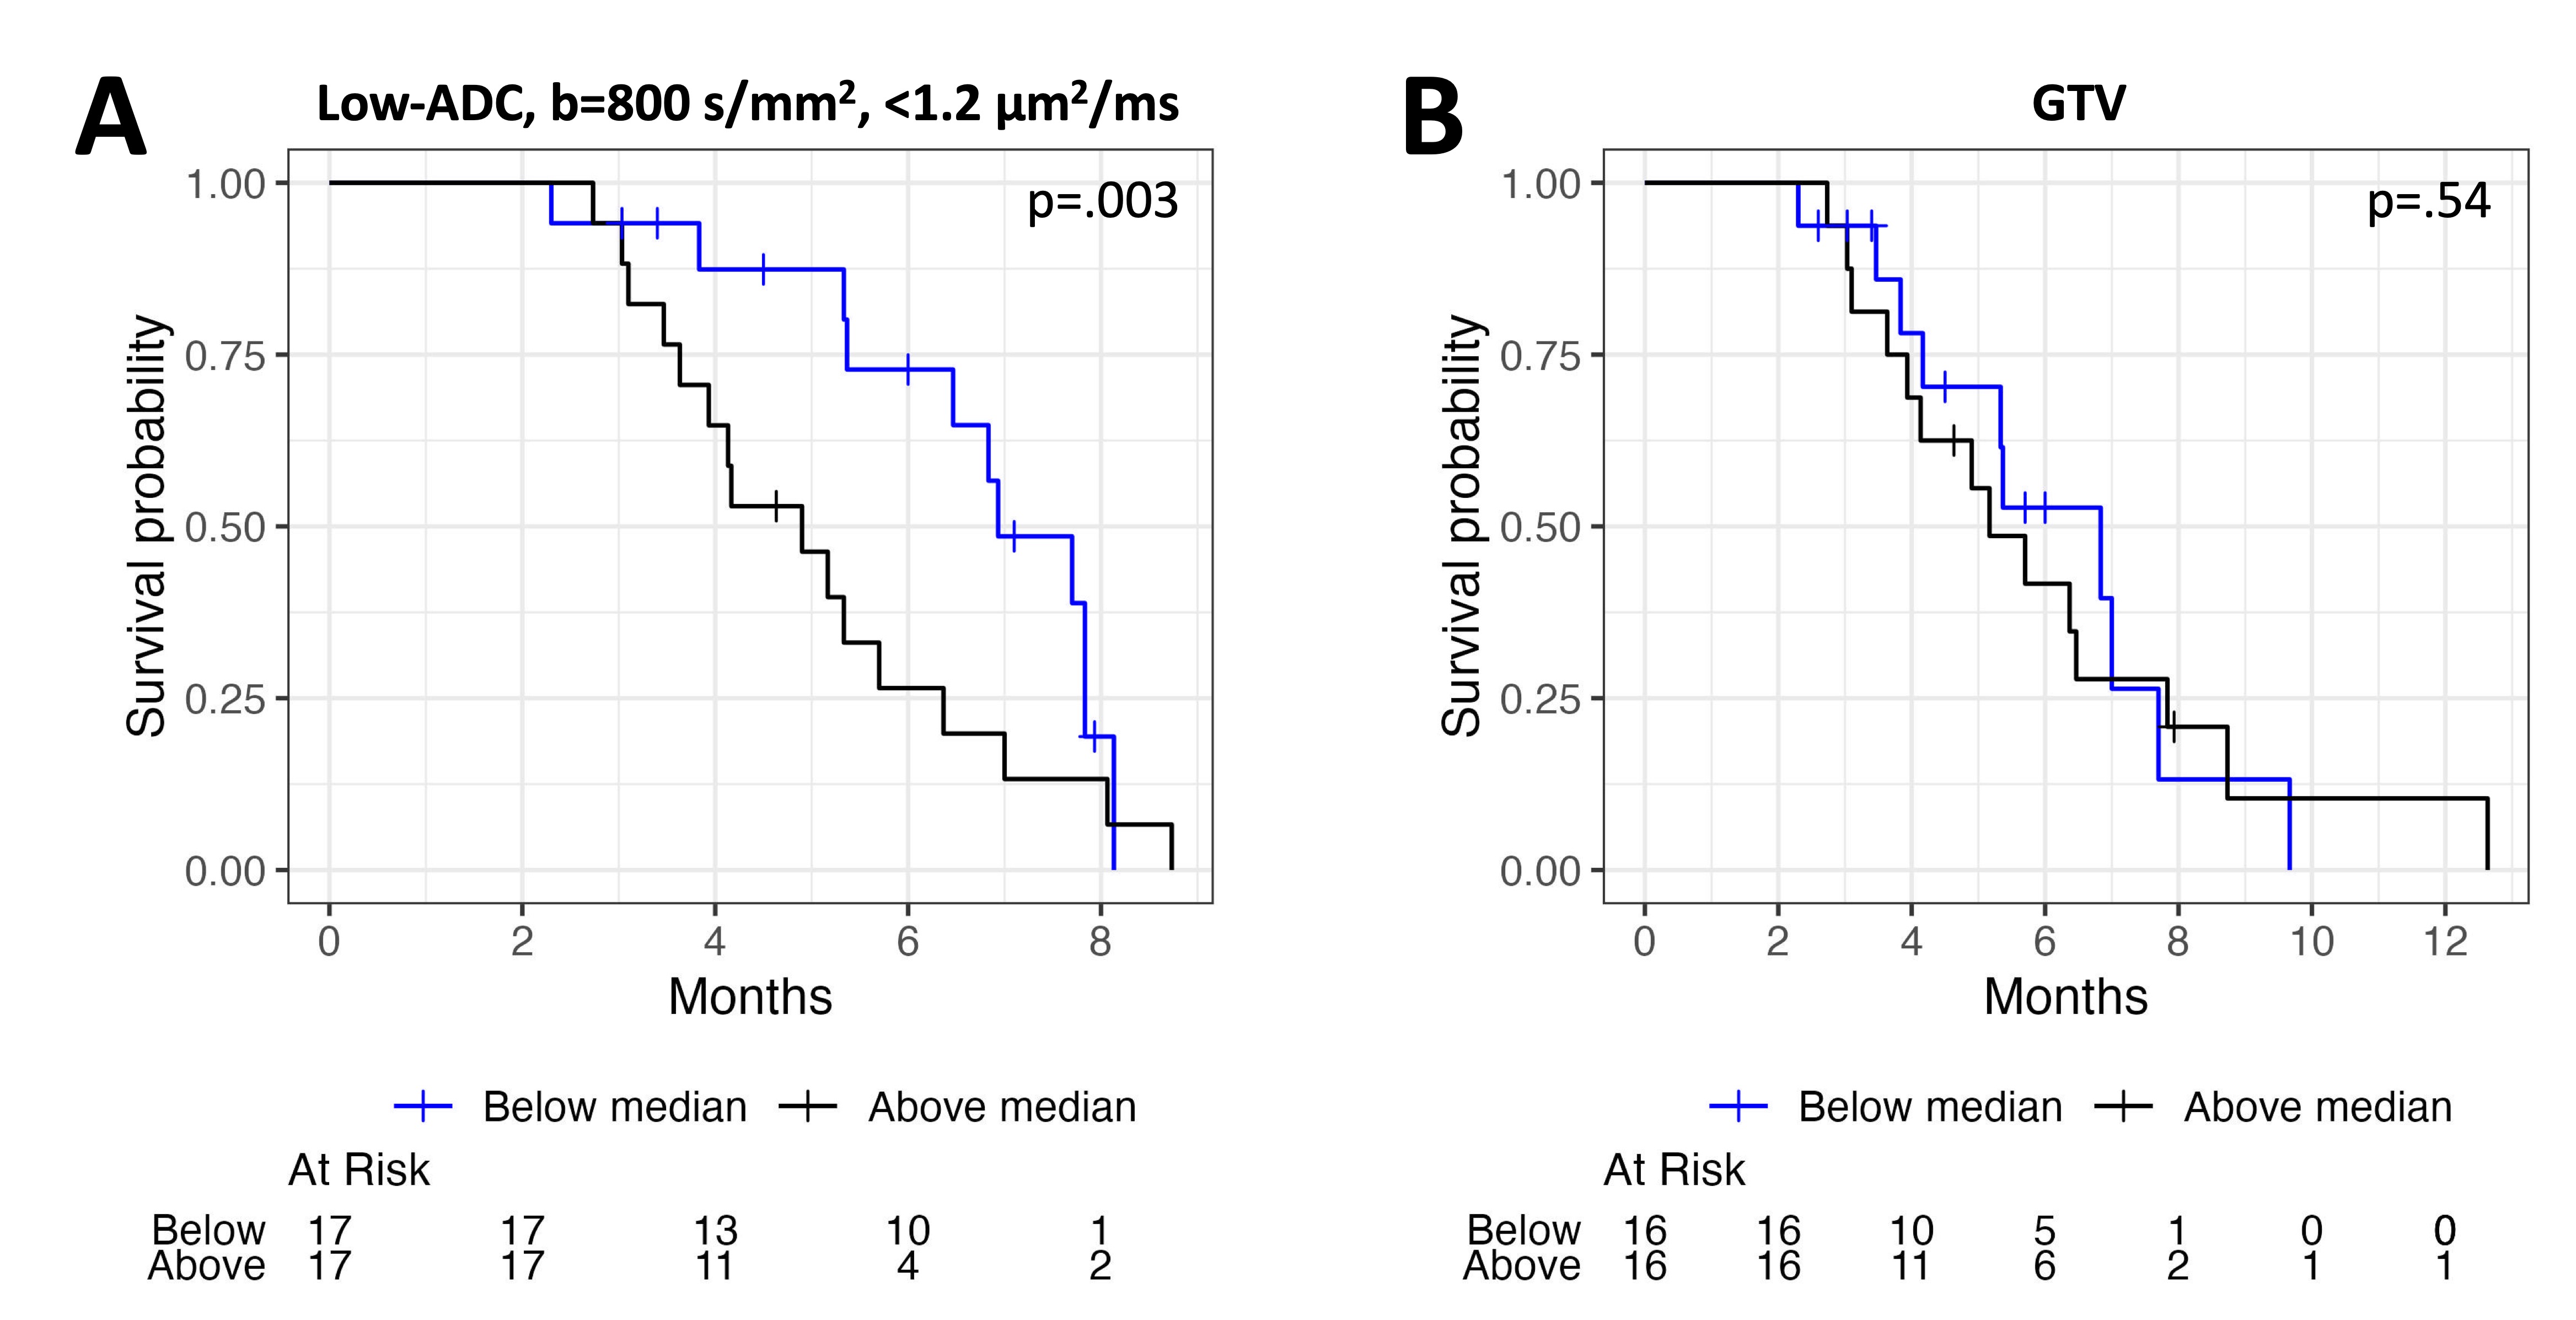
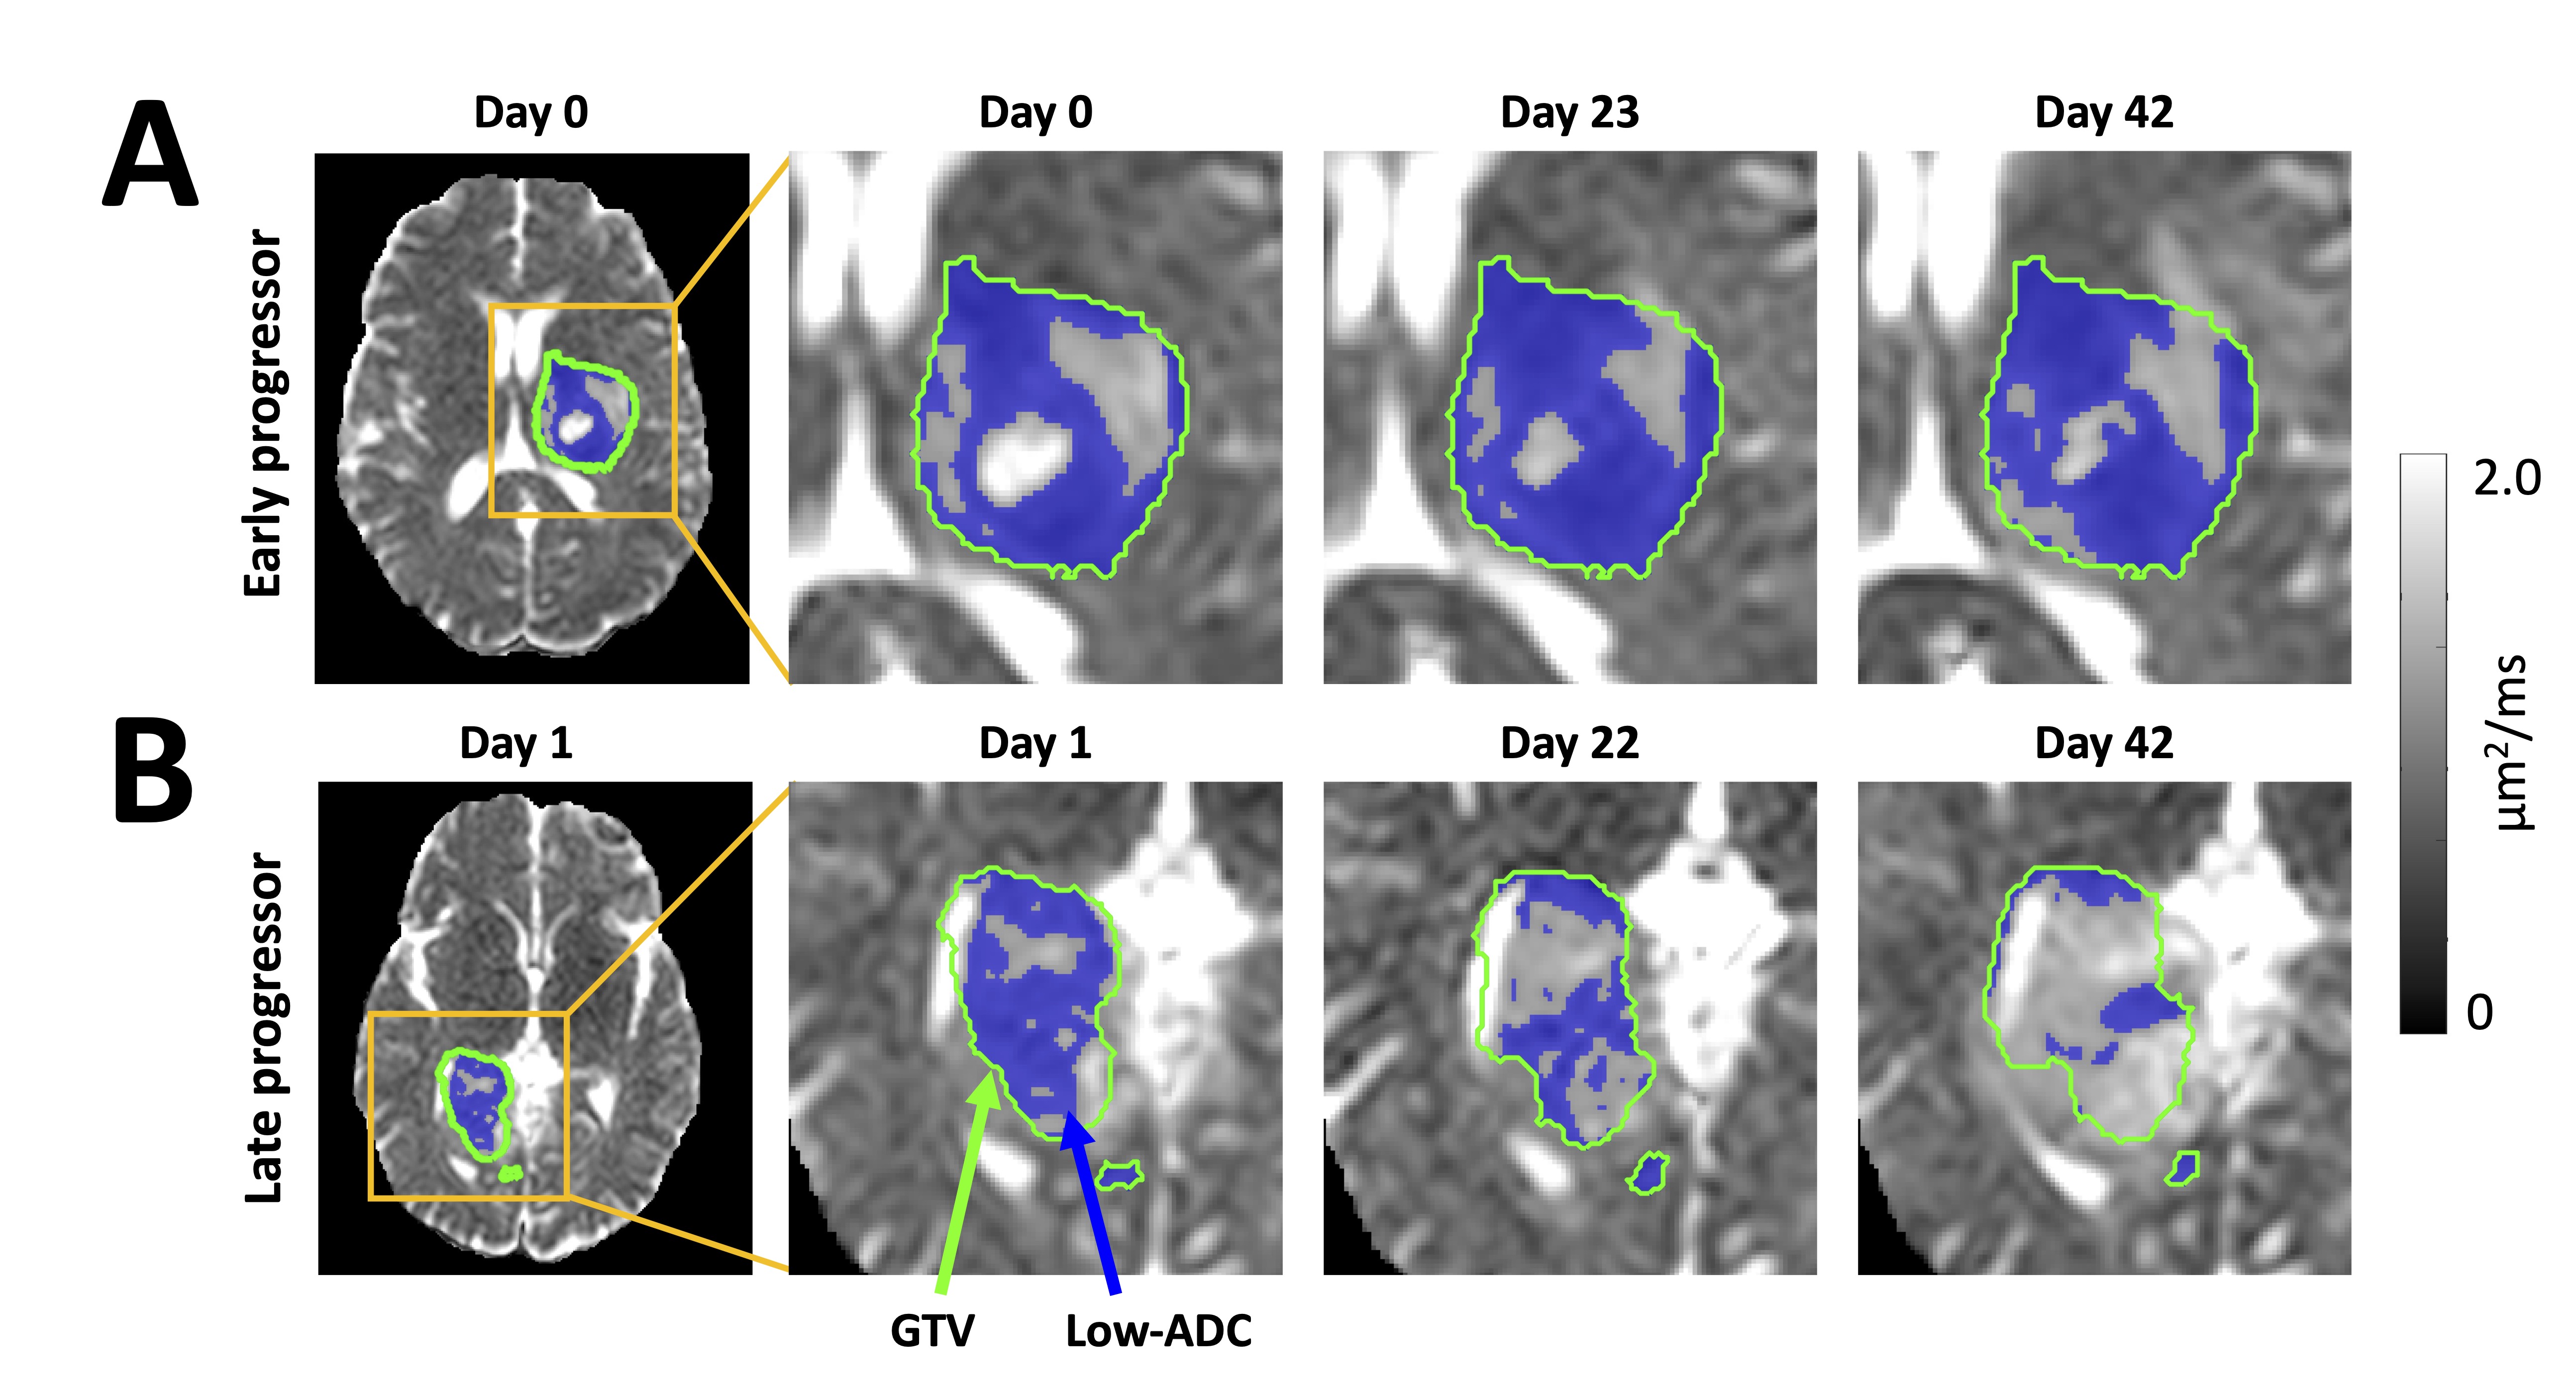
Figure 2 shows an example of GTV and low-ADC changes. The optimal low-ADC b-value/threshold combination was b=800s/mm2 and 1.2μm2/ms, showing statistically significant correlation with progression-free survival for weeks 2 through 6 inclusive (Figure 3). The GTV only correlated at week 5. Figure 4 shows example survival curves with stratification by low-ADC and GTV changes at week 2. Representative low-ADC changes for patients with early and late tumor progression are shown in Figure 5.Discussion
Using a b-value of 800s/mm2 and an ADC threshold of 1.2μm2/ms was optimal for prediction of progression-free survival compared with other thresholds, b=2000s/mm2 ADC maps, and GTV. This threshold is similar to the optimum found by Chenevert et al. using conventional MRI scanners at week 3 (1.25μm2/ms using b=1000s/mm2 DWI).5 Our unique contribution was demonstrating that this threshold is optimal over several weeks of radiotherapy and applies to an MR-Linac, since its ADC values can differ from those of other scanners.13 A limitation of our work was that only two b-values were tested. In contrast with literature on high b-value DWI,6-8,14 high b-value ADC maps did not show stronger survival correlation than standard b-value. Possible explanations include that we used a different b-value (2000 versus 3000-4000s/mm2) and larger voxels because of limited signal-to-noise ratio. Downsampling the b=800s/mm2 DWI to match the spatial resolution before comparison is a direction of future work.Conclusion
Early response assessment in glioblastoma during radiotherapy is possible using standard b-value DWI and weekly contrast-enhanced imaging on MR-Linacs.Acknowledgements
We thank the MR-Linac radiation therapists Shawn Binda, Danny Yu, Renée Christiani, Katie Wong, Helen Su, Monica Foster, Rebekah Shin, Khang Vo, Ruby Bola, Susana Sabaratram, Christina Silverson, Danielle Letterio, and Anne Carty for scanning and for their assistance with the protocol. We gratefully acknowledge the following sources of funding: Natural Sciences and Engineering Research Council; Terry Fox Research Institute; Canadian Institutes of Health Research; Canadian Cancer Society Research Institute; and the Ontario Early Researcher Awards program.References
1. Stupp R, Mason WP, van den Bent MJ, et al. Radiotherapy plus Concomitant and Adjuvant Temozolomide for Glioblastoma. N Engl J Med. 2005;352(10):987-996. doi:10.1056/NEJMoa043330
2. Cao Y, Tseng CL, Balter JM, Teng F, Parmar HA, Sahgal A. MR-guided radiation therapy: transformative technology and its role in the central nervous system. Neuro-Oncol. 2017;19(suppl_2):ii16-ii29. doi:10.1093/neuonc/nox006
3. Kim MM, Sun Y, Aryal MP, et al. A Phase 2 Study of Dose-intensified Chemoradiation Using Biologically Based Target Volume Definition in Patients With Newly Diagnosed Glioblastoma. Int J Radiat Oncol. 2021;110(3):792-803. doi:10.1016/j.ijrobp.2021.01.033
4. Lawrence LSP, Chan RW, Chen H, et al. Diffusion-weighted imaging on an MRI-linear accelerator to identify adversely prognostic tumour regions in glioblastoma during chemoradiation. Radiother Oncol. Published online August 2023:109873. doi:10.1016/j.radonc.2023.109873
5. Chenevert T, Malyarenko D, Galbán C, et al. Comparison of Voxel-Wise and Histogram Analyses of Glioma ADC Maps for Prediction of Early Therapeutic Change. Tomography. 2019;5(1):7-14. doi:10.18383/j.tom.2018.00049
6. Mardor Y, Pfeffer R, Spiegelmann R, et al. Early Detection of Response to Radiation Therapy in Patients With Brain Malignancies Using Conventional and High b-Value Diffusion-Weighted Magnetic Resonance Imaging. J Clin Oncol. 2003;21(6):1094-1100. doi:10.1200/JCO.2003.05.069
7. Mardor Y, Roth Y, Ocherashvilli A, et al. Pretreatment Prediction of Brain Tumors Response to Radiation Therapy Using High b-Value Diffusion-Weighted MRI. Neoplasia. 2004;6(2):136-142. doi:10.1593/neo.03349
8. Yamasaki F, Kurisu K, Aoki T, et al. Advantages of high b-value diffusion-weighted imaging to diagnose pseudo-responses in patients with recurrent glioma after bevacizumab treatment. Eur J Radiol. 2012;81(10):2805-2810. doi:10.1016/j.ejrad.2011.10.018
9. Jenkinson M, Smith S. A global optimisation method for robust affine registration of brain images. Med Image Anal. 2001;5(2):143-156. doi:10.1016/S1361-8415(01)00036-6
10. Jenkinson M, Bannister P, Brady M, Smith S. Improved Optimization for the Robust and Accurate Linear Registration and Motion Correction of Brain Images. NeuroImage. 2002;17(2):825-841. doi:10.1006/nimg.2002.1132
11. Avants BB, Tustison NJ, Song G, Cook PA, Klein A, Gee JC. A reproducible evaluation of ANTs similarity metric performance in brain image registration. NeuroImage. 2011;54(3):2033-2044. doi:10.1016/j.neuroimage.2010.09.025
12. Pencina MJ, D’Agostino RB. Overall C as a measure of discrimination in survival analysis: model specific population value and confidence interval estimation. Stat Med. 2004;23(13):2109-2123. doi:10.1002/sim.1802
13. Lawrence LSP, Chan RW, Chen H, et al. Accuracy and precision of apparent diffusion coefficient measurements on a 1.5 T MR-Linac in central nervous system tumour patients. Radiother Oncol. 2021;164:155-162. doi:10.1016/j.radonc.2021.09.020
14. Pramanik PP, Parmar HA, Mammoser AG, et al. Hypercellularity Components of Glioblastoma Identified by High b-Value Diffusion-Weighted Imaging. International Journal of Radiation Oncology*Biology*Physics. 2015;92(4):811-819. doi:10.1016/j.ijrobp.2015.02.058
Figures