0361
In vivo detection of GSH and GABA in high-grade glioma using MEGA-sLASER spectral editing at 3 T1Institute of Neuroradiology, Goethe University Frankfurt, University Hospital, Frankfurt am Main, Germany, 2University Cancer Center Frankfurt (UCT), Frankfurt am Main, Germany, 3Frankfurt Cancer Institute (FCI), Frankfurt am Main, Germany, 4German Cancer Research Center (DKFZ) Heidelberg, Germany and German Cancer Consortium (DKTK), Partner Site Frankfurt/Mainz, Frankfurt am Main, Germany, 5Dr. Senckenberg Institute of Neurooncology, Goethe University Frankfurt, University Hospital, Frankfurt am Main, Germany, 6Center for Magnetic Resonance Research, Department of Radiology, University of Minnesota, Minneapolis, MN, United States, 7Department of Neurosurgery, Goethe University Frankfurt, University Hospital, Frankfurt am Main, Germany
Synopsis
Keywords: Tumors (Pre-Treatment), Brain
Motivation: Alterations in glutamatergic and GABAergic (gamma-aminobutyric acid) mechanisms render peritumoral neuronal networks of infiltrating glioma hyper-excitable and more prone to seizures.
Goal(s): Glutamate, glutamine, glutathione (GSH), and GABA are therefore key metabolites in glioma-associated epilepsy.
Approach: Nowadays, J-editing MR spectroscopy is the primary technique in the detection of low-abundant metabolites (e.g., GSH, GABA) that overlap with more prominent signals. We used this technique combined with sLASER sequence (MEGA-sLASER) to improve localization accuracy and showed its reliability/repeatability for GSH and GABA quantification in glioblastoma, IDH-wildtype.
Results: This approach could foster our understanding of the biological effects of novel drugs targeting tumor-associated epilepsy.
Impact: MEGA-sLASER might improve the detectability and MRS localization accuracy of low-abundant metabolites (GSH, GABA) even in rather small, heterogeneous solid tumors. Here, we show the reliability/reproducibility of this method in the investigation of glioma-associated epilepsy in glioblastoma patients.
Introduction
Alterations in glutamatergic and GABAergic (gamma-aminobutyric acid) mechanisms render peritumoral neuronal networks of infiltrating glioma hyper-excitable and more prone to seizures1,2. Glutamate, glutamine, glutathione (GSH), and GABA are therefore key metabolites and direct or indirect therapeutic targets in the treatment of glioma-associated epilepsy.In vivo quantification of GSH and GABA is challenging since their concentrations in the brain are in the range of 1-2 mM3 and, 0.8-1.8 mM4, respectively. Nowadays, the primary spectroscopic technique in the detection of such low-concentrated molecules is the spectral J-editing technique which uses J-coupling networks of the target metabolites to discriminate their resonances from overlying signals especially those from more-concentrated metabolites5. The combination of this technique with sLASER localization6 is called “MEGA-sLASER (MEscher–Garwood sLASER) scheme”. In contrast to the commonly used MEGA-PRESS, the reduced chemical-shift displacement error and transmit B1 insensitivity of the adiabatic-pulse-based sLASER7 method improves the detectability of low-abundant metabolites8 and the accuracy of MRS localization in the existence of large necrotic areas and rather small, heterogeneous solid tumor regions.
We initiated a prospective study on the reliability/repeatability of the MEGA-sLASER GSH/GABA measurements at 3T in the investigation of glioma-associated epilepsy. Here, we report the results of the healthy volunteer test-retest measurements and preliminary findings in glioblastoma, IDH wildtype (IDHwt-GBM) patients with and without glioma-induced epilepsy.
Methods
All scans were performed on a clinical whole-body 3T MR Scanner (MAGNETOM Prisma, Siemens Healthineers, Erlangen, Germany) with a 20-channel 1H head coil. The MRS protocol included reference 3D-T1WI, 2D-T2WI, and MEGA sLASER with TE = 80 ms, TR = 2000 ms, editing pulse frequencies (δGABA/δGSH/δOFF) = 1.9/4.56/7.5 ppm, editing pulse bandwidth = 13 ms, voxel size = 8-16 cm3, total number of scans = 192, acquisition time = 6.44 min.For the repeatability/reliability part, the voxel was placed in the posterior cerebral region of five healthy subjects (3 female, 2 male, aged 29 ± 3.16 years) (Fig1a). Each subject completed two sessions with a short break (~15 min) in between sessions.
For the clinical part, patients ≥18 years of age with MRI-suspected diffuse glioma and a recommendation for biopsy/resection were examined prior to surgery. One MEGA-sLASER voxel was placed to cover solid tumor and peritumoral tissue (TT; Fig1a) and one in the contralateral region (CL). Ex vivo tumor tissue analysis included a standard neuropathological workup and additional metabolic analyses. To create a homogeneous cohort, only patients diagnosed with IDHwt-GBM were evaluated for this report (n=17 patients).
All spectra were post-processed using Gannet. The quantification of GABA+ (with contributions from macromolecules and homocarnosine) and GSH was performed with LCModel using a simulated basis set. Spectral quality/fitting parameters were compared between sessions using a Wilcoxon signed-rank test. A paired-samples t-test was used to compare GABA+ and GSH concentrations obtained from repeated measurements of healthy subjects and from TT and CL in patients.
Results
Two patients were excluded after postprocessing due to prominent artifacts in the data. Five of the remaining patients had at least one seizure prior to their exam.As summarized in Fig1b, there was no significant difference in LCModel estimated spectral quality parameters (i.e., SNR and FWHM) in our short-term repeatability measurements in healthy subjects, or between TT and CL voxels in our IDHwt-GBM cohort. Representative fitted patient spectra are shown in Fig2. No significant difference is observed in spectral fitting uncertainty parameter, CRLBs, between repeated measurements (Fig3). While there was no significant difference in GABA+ and GSH concentrations between the two sessions in healthy subjects (Fig3), a significantly lower GABA+ concentration was observed in TT compared to CL (p = 0.002). When the IDHwt-GBM cohort was grouped as with and without seizures, this significant difference was maintained in the group of patients without seizures (p = 0.01) (Fig4). Even though overall, no significant difference in GSH concentrations between TT and CL voxels was observed, individual cases showed evidently lower or higher GSH concentrations in TT voxels (Fig5).
Discussion
J-editing MRS with sLASER, which improves MRS localization accuracy, might be favorable for pathological tissues with high spatial heterogeneity such as IDHwt-GBM. Scan and re-scan measurements showed the repeatability of the MEGA-sLASER protocol for GABA+ and GSH quantification (95% CI: 1.24 to 2.19 mM, 0.60 to 1.37 mM, respectively). The use of in vivo J-editing MRS for the investigation of alterations in glutamatergic and GABAergic mechanisms in tumors and peritumoral neural networks could foster our understanding of the biological effects of novel drugs targeting tumor-associated epilepsy. The findings on GSH already demonstrate the heterogeneity of IDHwt-GBM, emphasizing the need for an evaluation on an individual patient/tumor level.Acknowledgements
The MEGA sLASER sequence was developed by Edward J. Auerbach and Małgorzata Marjańska and provided by the University of Minnesota under a C2P agreement. KJW and SA were funded by the Mildred Scheel Career Center Frankfurt (Deutsche Krebshilfe). KJW was funded by the Else Kröner-Fresenius-Stiftung (EKFS). DD acknowledges support from National Institutes of Health grant P41 EB015894.References
1. Lyons, S. A., Chung, W. J., Weaver, A. K., Ogunrinu, T. & Sontheimer, H. Autocrine glutamate signaling promotes glioma cell invasion. Cancer Res 67, 9463–9471 (2007).
2. Tantillo, E. et al. Differential roles of pyramidal and fast-spiking, GABAergic neurons in the control of glioma cell proliferation. Neurobiology of Disease 141, 104942 (2020).
3. Cai, K. et al. The Impact of Gabapentin Administration on Brain GABA and Glutamate Concentrations: A 7T 1H-MRS Study. Neuropsychopharmacol 37, 2764–2771 (2012).
4. Aoyama, K. Glutathione in the Brain. International Journal of Molecular Sciences 22, 5010 (2021).
5. Choi, I. et al. Spectral editing in 1 H magnetic resonance spectroscopy: Experts’ consensus recommendations. NMR in Biomedicine 34, (2021).
6. Scheenen, T. W. J., Klomp, D. W. J., Wijnen, J. P. & Heerschap, A. Short echo time 1H-MRSI of the human brain at 3T with minimal chemical shift displacement errors using adiabatic refocusing pulses. Magnetic Resonance in Medicine 59, 1–6 (2008).
7. Maudsley, A. A. et al. Advanced magnetic resonance spectroscopic neuroimaging: Experts’ consensus recommendations. NMR in Biomedicine 34, (2021).
8. Dacko, M. & Lange, T. Improved detection of lactate and β-hydroxybutyrate using MEGA-sLASER at 3 T. NMR in Biomedicine 32, e4100 (2019).
Figures
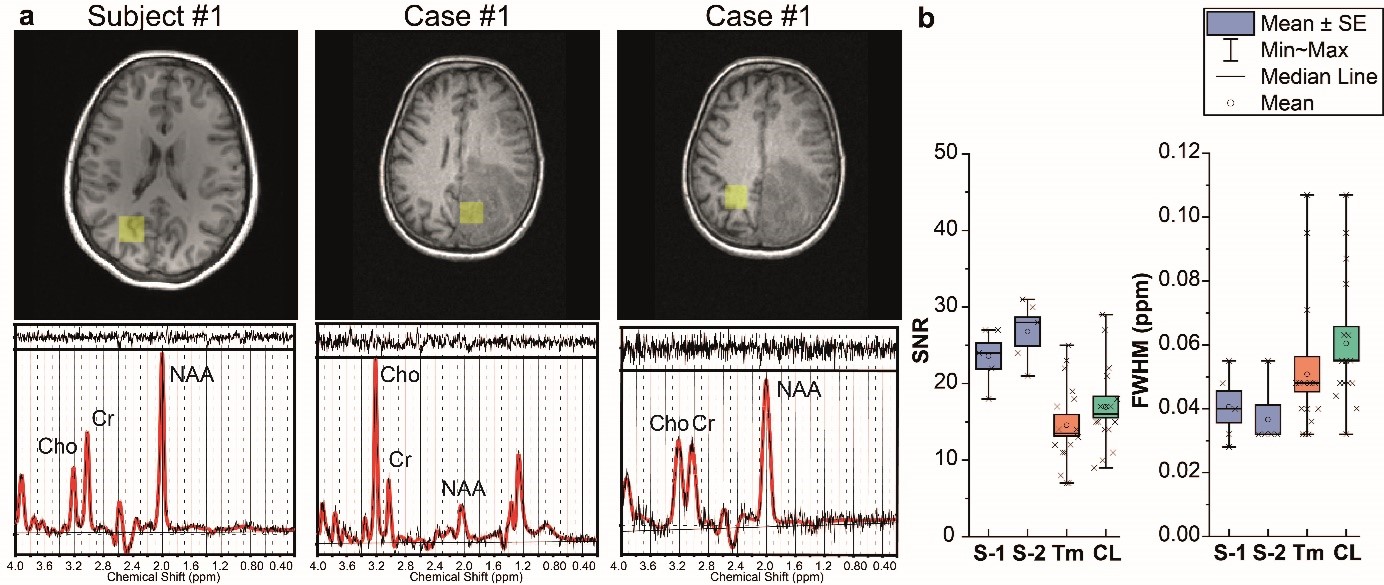
Figure 1. (a) Voxel positions (yellow boxes) registered on T1WI in posterior cerebral region for healthy volunteer measurement (subject #1) and in tumor and contralateral (CL) region for the measurement of HGG patient (Case #1). (b) Box plots of LCModel estimated FWHM and SNR of the spectra obtained from the posterior cerebral region of healthy volunteers at two repeated sessions (S-1, S-2) and from tumor and contralateral region of HGG patients.
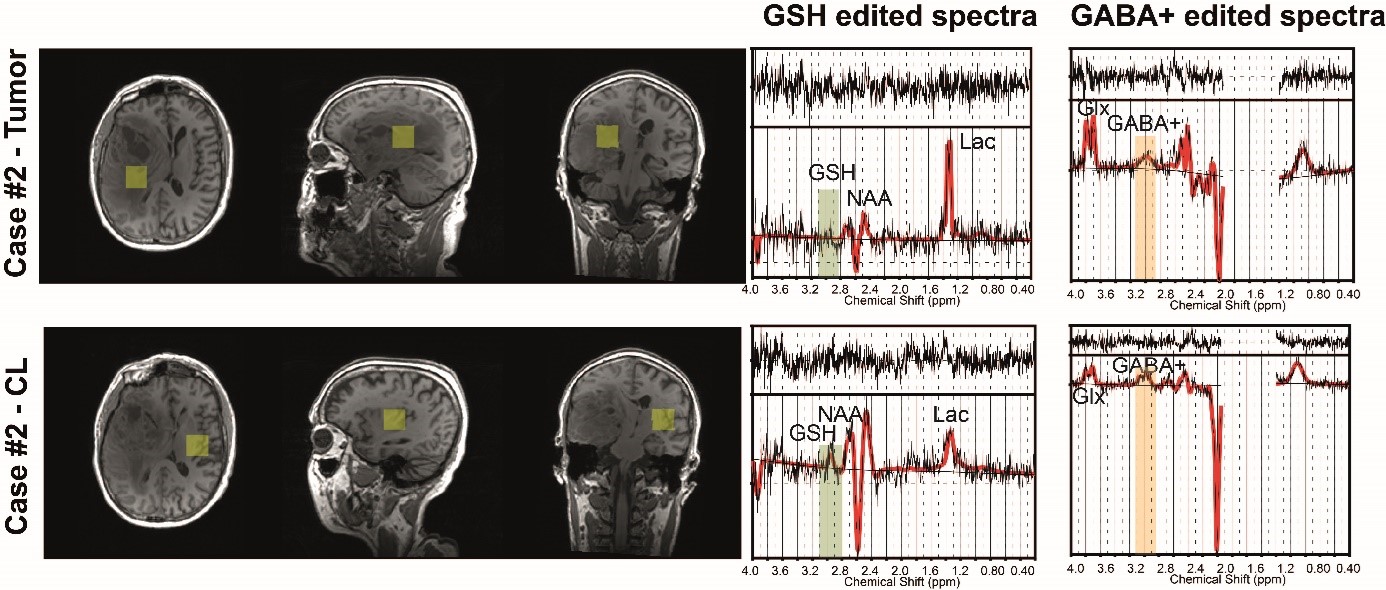
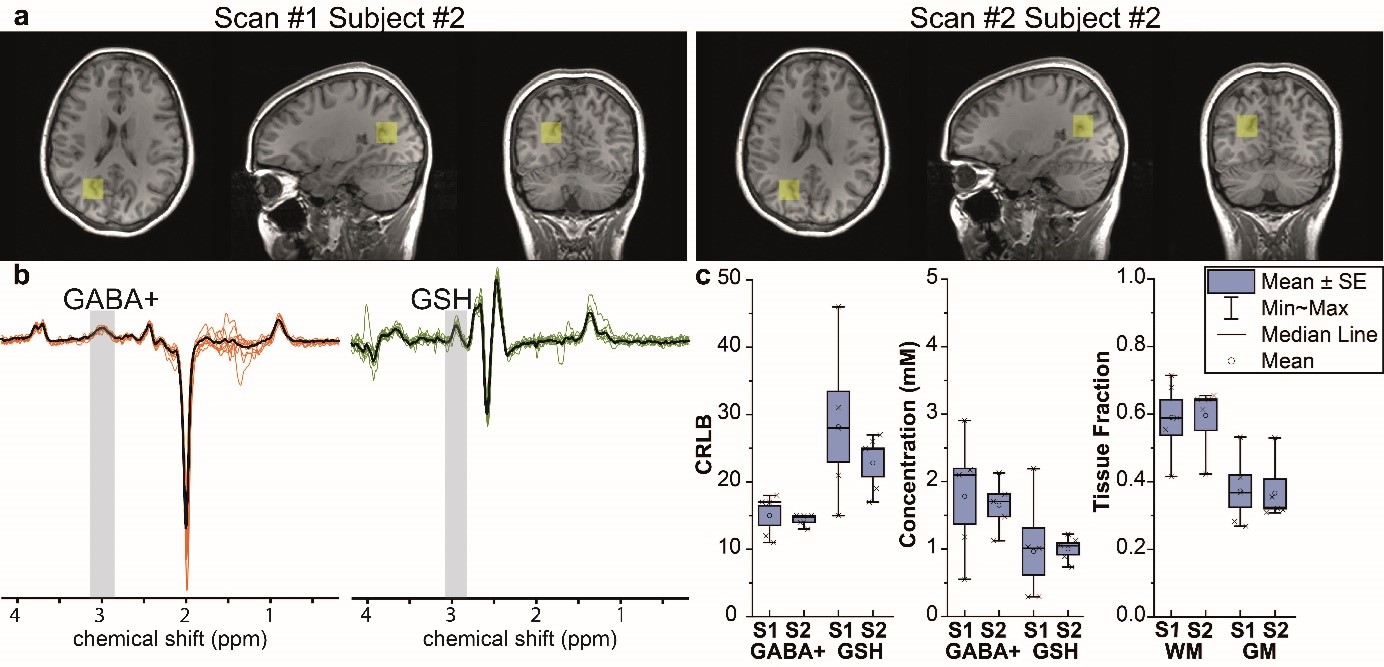
Figure 3. Example voxel positions registered on T1WI for healthy volunteer measurement (subject #2) for test and retest. (b) GABA+ and GSH edited spectra obtained from each healthy volunteer measurement. The stacked individual spectra are overlaid by the averaged spectrum (black) (c) Comparison of LCModel estimated CRLBs, metabolite concentrations, and tissue fractions (WM: white matter, and GM: gray matter) between two sessions. Box plots show the standard error (SE) of the mean.
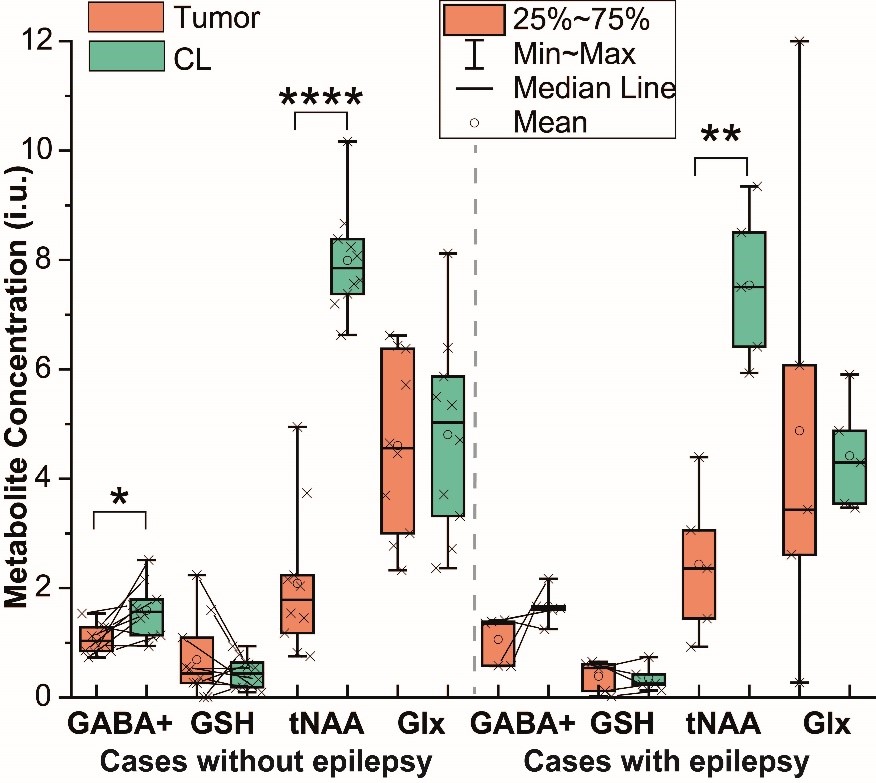
Figure 4. Box plots of GABA+, GSH, total NAA (tNAA), and Glx (glutamine + glutamate) concentration in tumor and contralateral (CL) in HGG patients with and without epilepsy. For the sake of clarity, data points only for GABA+ and GSH concentrations were connected with lines. Results were considered significant at p < 0.05 (*), < 0.01 (**), < 0.001 (***), <0.001 (****). Plots are presented with minimum, maximum, interquartile ranges (25th and 75th percentiles), and median.
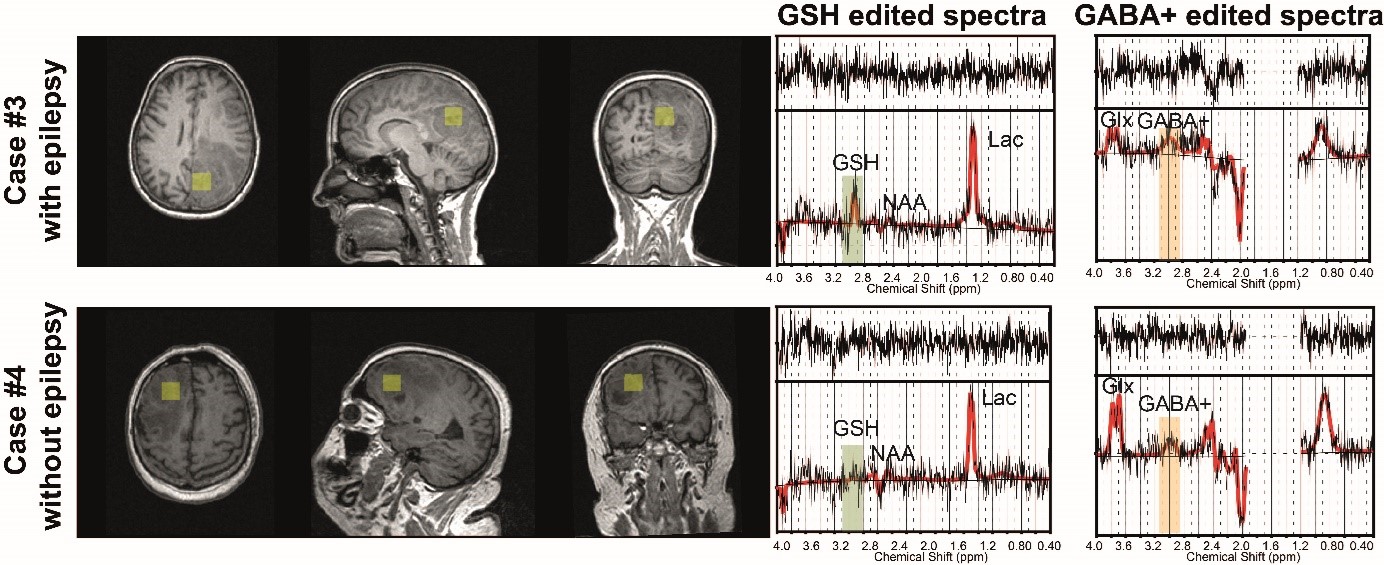
Figure 5. Voxel positions registered on T1WI for tumor regions in the measurement of two HGG patients with and without epilepsy. Right: LCModel fitting of GABA+ and GSH edited spectra obtained from the region shown on the left. The original signal is presented in black, and the LCModel fit in red. Presented residual lines (top) are generated by subtracting experimental spectra from fitted spectra. GSH and GABA+ peaks are highlighted with green and orange boxes, respectively.