0360
Fast-Relaxing Sodium Fraction in Brain Tumors1German Cancer Research Center, Heidelberg, Germany, 2Heidelberg University Hospital, Heidelberg Institute for Radiation Oncology (HIRO), Heidelberg Ion-Beam Therapy Center (HIT), National Center for Tumor Diseases (NCT), German Cancer Research Center (DKFZ), Heidelberg, Germany, 3Siemens Healthineers AG, Erlangen, Germany, 4German Cancer Research Center, Heidelberg University, Heidelberg, Germany, 5German Cancer Research Center, University Hospital Bonn, Bonn, Germany
Synopsis
Keywords: Tumors (Pre-Treatment), Cancer, Sodium, Relaxometry
Motivation: Enhance the specificity of sodium (23Na) imaging in brain tumors.
Goal(s): Distinguish intracellular and extracellular sodium distribution in glioblastoma.
Approach: We assessed the fraction of fast-relaxing sodium (FT2*s) in 19 glioblastoma patients using a 3D radial 23Na pulse sequence with six echoes at 7T.
Results: FT2*s was high in normal appearing white matter resembling expected intracellular behavior, and low in necrotic regions, akin to fluid-like environments. Values for contrast-enhancing tumors and adjacent edema were in between. The differentiation between normal brain tissue and changes in glioblastoma underscores the potential of FT2*s to improve the specificity of sodium imaging in brain tumors.
Impact: The study could facilitate the establishment of the fast-relaxing sodium fraction as a diagnostic tool in brain tumors, potentially improving specificity in sodium quantification.
Introduction:
Healthy cells maintain a substantial sodium gradient across their membranes, with the intracellular space – accounting for approximately 80% of tissue volume – containing sodium at 10-15 mM, in contrast to the extracellular space and vascular compartment, which display sodium concentrations of 140-150 mM. Many tumors demonstrate heightened sodium levels, potentially due to compromised energy metabolism or cell membrane integrity, leading to increased intracellular sodium concentration, or due to expansion of the extracellular space1,2.In magnetic resonance (MR) imaging, sodium relaxation times reflect the surrounding molecular milieu. In fluid-like environments such as cerebrospinal fluid, sodium exhibits a monoexponential T2* decay. However, due to interactions within the intracellular environment, the quadrupolar 23Na nucleus experiences a rapid biexponential T2* relaxation with a short (T2*s) and a long component (T2*l)3.
The objective of this trial is to enhance sodium imaging in primary brain tumors by integrating rapid T2* relaxation measures across various tumor compartments alongside the determination of sodium concentration, thereby augmenting the specificity of the 23Na imaging technique.
Methods
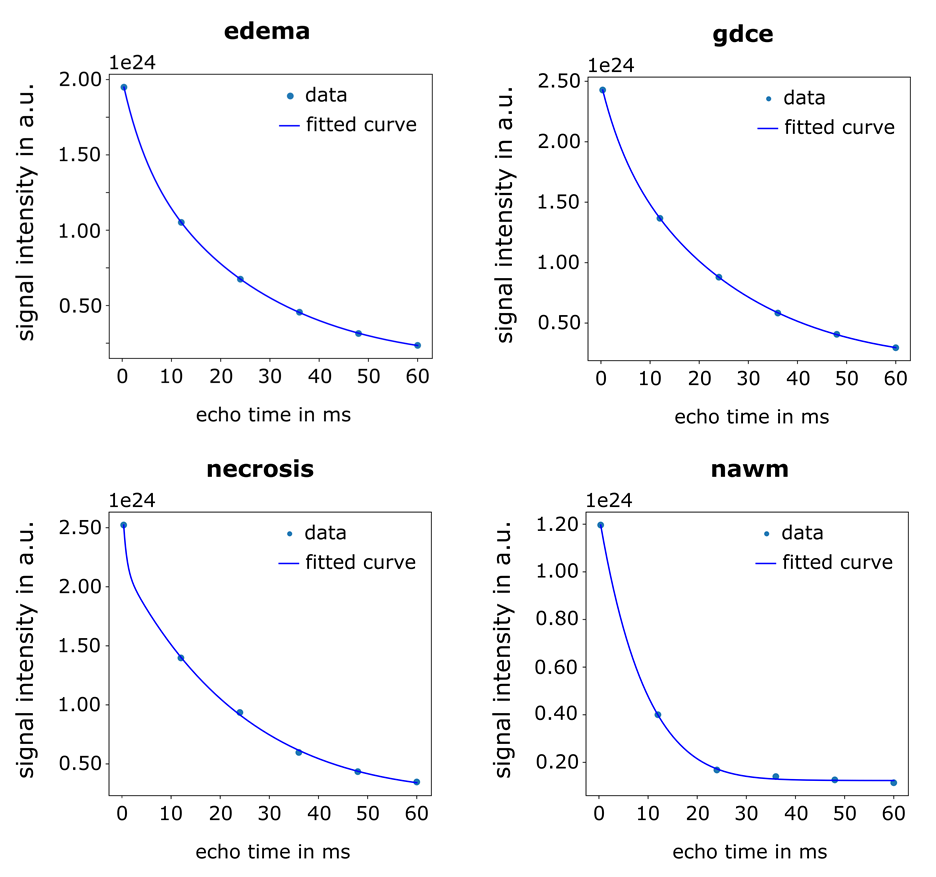
We evaluated 19 patients with glioblastoma4. 23Na imaging was performed on a prototype 7T MR scanner (MAGNETOM 7T, Siemens Healthineers, Erlangen, Germany) using a double-resonant 1H/23Na coil (RAPID Biomedical, Rimpar, Germany). 23Na data was acquired with a multi-echo density-adapted 3D radial pulse sequence 5 with a nominal spatial resolution of (3 mm)3 (Nprojections = 4000, TR = 160ms, TE = [0.35ms, 12ms, 24ms, 36ms, 48ms, 60ms], Tacq = 10min:40s, Treadout = 10 ms). A Hamming filter was applied to the raw data during reconstruction.Clinical 3T MR images were registered, and the following regions of interest (ROI) segmented: normal appearing white matter (NAWM), Gd contrast enhanced tumor (gdce), necrosis, and peritumoral edema defined as hyperintensity on Fluid attenuated inversion recovery (FLAIR). ROI-derived signal intensities for each of the 6 echoes were fitted using a non-linear least-squares algorithm in Python with the following model (Fig. 1)3:
$$SI_{TE} = \sqrt{ \left( M_0^2 \left( F_{T2^*} e^{-\frac{TE}{T2^*}} + (1-F_{T2^*}) e^{-\frac{TE}{T2^l}} \right) \right)^2 + N^2 }$$ with FT2*s∈[0 , 0.6]
SITE: Signal intensity for each echo
M0: Magnetization
FT2*s: Fraction of rapid T2* relaxation (T2*s)
TE: echo time
T2*s: Short T2* relaxation time
T2*l: Long T2* relaxation time
Estimates were then subjected to nonparametric analysis of variance (ANOVA) for statistical analysis.
Results:
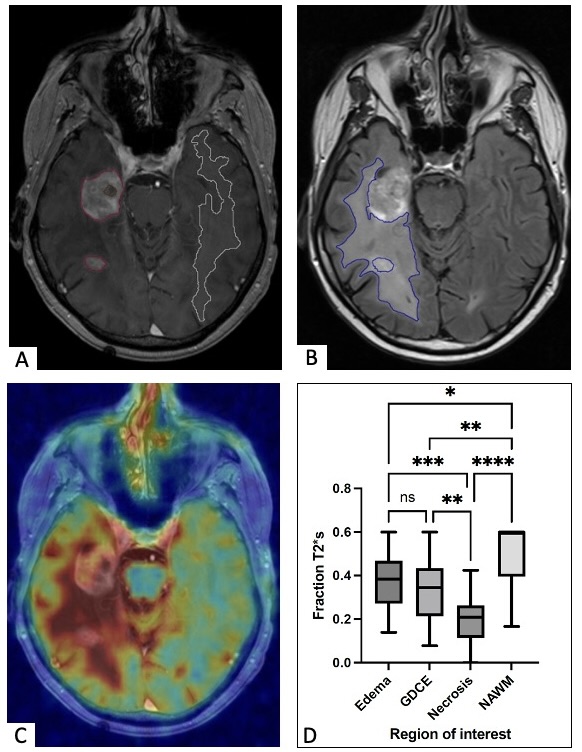
Our study revealed an elevated sodium signal in brain tumors and surrounding edema, corroborating prior reports. In addition, there was notable variability in the fraction of rapid T2* relaxation (FT2*s) across different regions of interest (Fig. 2). NAWM exhibited a high FT2*s value of 0.51, consistent with anticipated quadrupolar interactions (expected FT2*s = 0.6), whereas necrotic regions showed a low FT2*s value of 0.18, akin to a fluid-like environment. In patients with glioblastoma, FT2*s values for the enhancing tumor and adjacent FLAIR hyperintensities were intermediate, at 0.35 and 0.38 respectively, not differing significantly.Discussion:
In our study, we were able to delineate differences in estimated FT2*s across distinct regions, suggesting the viability of FT2*s as a potential marker for brain tumor evaluation. The contrasting FT2*s values, particularly the high FT2*s in NAWM versus the low FT2*s in necrotic tissues, underscore the potential sensitivity of FT2*s to the underlying tissue integrity. Incorporating additional echoes, particularly at longer TE values, could increase the accuracy of the method3. However, this would also result in longer acquisition times, which poses challenges for clinical settingsConclusion:
We demonstrated the feasibility of fast estimation of sodium relaxation (under 11 min) in patients with brain tumors. Future studies are needed to ascertain if the noted disparities in FT2*s in the peritumoral zones of infiltrative glioblastoma reflect different distributions of sodium across intracellular and extracellular compartments.Acknowledgements
No acknowledgement found.References
1 Madelin, G., Lee, J. S., Regatte, R. R. & Jerschow, A. Sodium MRI: methods and applications. Prog Nucl Magn Reson Spectrosc 79, 14-47 (2014). https://doi.org:10.1016/j.pnmrs.2014.02.001
2 Gast, L. V., Platt, T., Nagel, A. M. & Gerhalter, T. Recent technical developments and clinical research applications of sodium (23Na) MRI. Progress in Nuclear Magnetic Resonance Spectroscopy 138-139, 1-51 (2023). https://doi.org:https://doi.org/10.1016/j.pnmrs.2023.04.002
3 Ridley, B. et al. Distribution of brain sodium long and short relaxation times and concentrations: a multi-echo ultra-high field 23Na MRI study. Scientific Reports 8, 4357 (2018). https://doi.org:10.1038/s41598-018-22711-0
4 Regnery, S. et al. Ultra-high-field sodium MRI as biomarker for tumor extent, grade and IDH mutation status in glioma patients. Neuroimage Clin 28, 102427 (2020). https://doi.org:10.1016/j.nicl.2020.102427
5 Nagel, A. M. et al. Sodium MRI using a density-adapted 3D radial acquisition technique. Magn Reson Med 62, 1565-1573 (2009). https://doi.org:10.1002/mrm.22157
Figures