0356
Deep Learning-based MRS Reconstruction with Artificial Fourier Transform Network (AFT-Net)1Columbia University, New York, NY, United States
Synopsis
Keywords: Analysis/Processing, Machine Learning/Artificial Intelligence
Motivation: Complex-valued deep neural network has not been fully investigated in MRS reconstruction and preprocessing.
Goal(s): We aim to solve the spectroscopy inverse problems in domain transform from FIDs to spectra, especially for accelerated MRS reconstruction.
Approach: A complex-valued deep learning framework artificial Fourier transform network (AFT-Net) is proposed to directly reconstruct and process the complex-valued raw data in the sensor domain.
Results: Evaluation of different acceleration rates was performed on the in vivo dataset. AFT-Net demonstrated the ability to reconstruct the data under up to 80 times acceleration rate. The proposed AFT-Net is an efficient and accurate approach for MEGA-PRESS MRS accelerated reconstruction.
Impact: MRS reconstruction and preprocessing with AFT-Net should be able to determine the domain-manifold mapping and process FID data directly, which shows superior performance compared with numerical method and can be served as an efficient and accurate approach for MRS acquisition.
Introduction
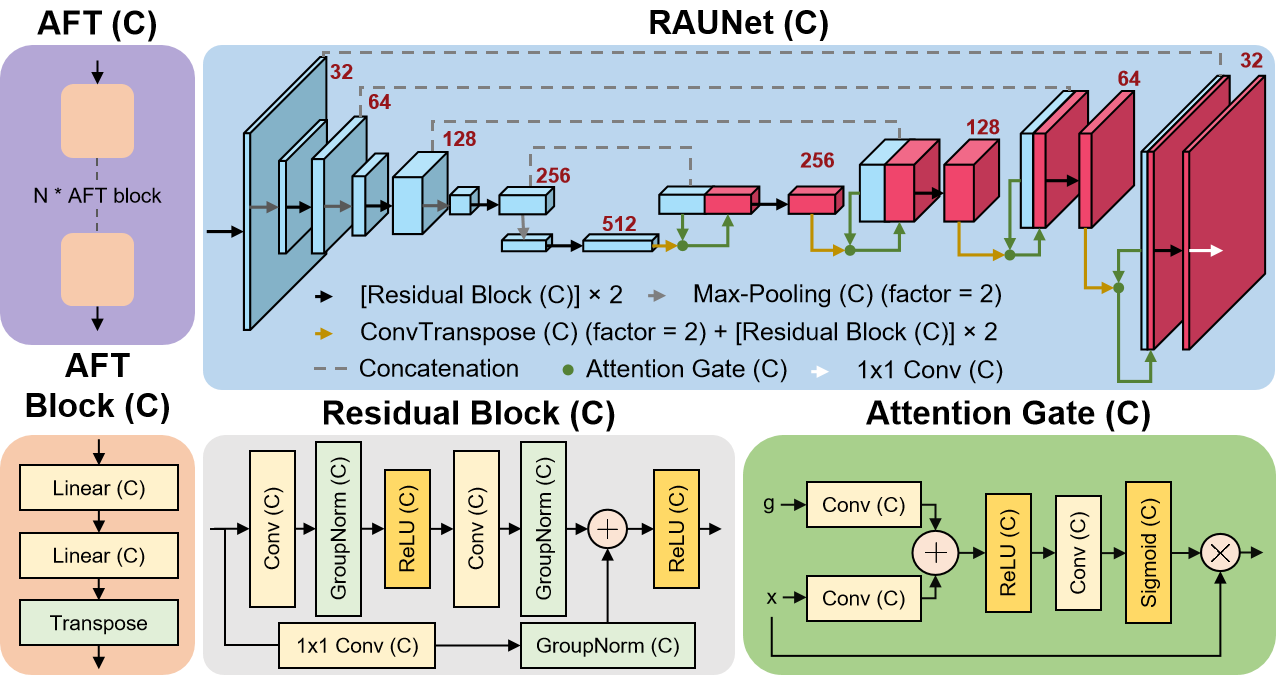
MRS is widely used to quantify metabolic chemical changes in brains, which provides crucial information on brain health. However, due to scanner variability and subject motion, frequency and phase shifts may arise, affecting data quality. The vast majority of present deep learning-based methods are based on real-valued operations, and few complex-valued methods[1] have fully leveraged the rich representational capacity of complex numbers to develop complex-valued architectures. Here, we propose a complex-valued MRS reconstruction approach, which aims to reconstruct and denoise the FID in parallel. The framework described here is the artificial Fourier transform (AFT). We utilize AFT combined with complex-valued UNet to design our AFT-Net as shown in Figure 1.Methods
Complex-valued neural networkThe real-valued network is extended to complex-valued network by defining the complex operator as $$$\mathrm{W}=\mathrm{W}_{real}+i\mathrm{W}_{imag}$$$, where $$$\mathrm{W}_{real}$$$ and $$$\mathrm{W}_{imag}$$$ are real-valued operators (linear, convolution and non-linear[2] operator). The output of $$$\mathrm{W}$$$ acting on $$$x$$$ can then denoted as complex matrix multiplications:
$$y=\mathrm{W}*x=(\mathrm{W}_{real}*x_{real}-\mathrm{W}_{imag}*x_{imag})+i(\mathrm{W}_{imag}*x_{real}+\mathrm{W}_{real}*x_{imag}).$$
The normalization[3] equation can also be extended as:
$$\tilde{z}=V^{-\frac{1}{2}}(z-\mathbb{E}(z))=(\begin{bmatrix}\mathrm{Cov}(\Re(z),\Re(z))&\mathrm{Cov}(\Re(z),\Im(z))\\\mathrm{Cov}(\Im(z),\Re(z))&\mathrm{Cov}(\Im(z),\Im(z))\end{bmatrix}+{\epsilon}I)^{-\frac{1}{2}}\cdot\begin{bmatrix}\Re(z)-\mathrm{Mean}(\Re(z))\\\Im(z)-\mathrm{Mean}(\Im(z))\end{bmatrix},$$
where $$$x-\mathbb{E}(x)$$$ zero centers real and imaginary parts separately, $$$V$$$ is the covariance matrix and $$${\epsilon}I$$$ is added to guarantee the existence of the inverse square root.
Implementation detail
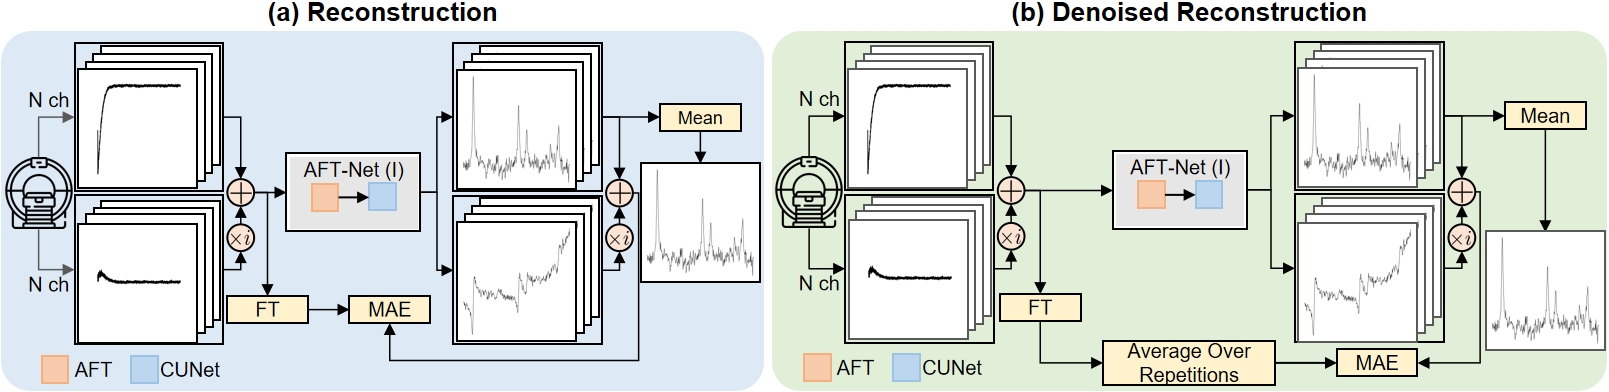
The general workflow is shown in Figure 2. We first trained AFT-Net on the simulated MEGA-PRESS dataset and then on the in vivo Big GABA dataset[4]. A total number of 101 subjects acquired by the Philips scanners were used in the training. For each subject, a standard GABA+-edited MRS acquisition was run, where ON editing pulses were placed at 1.9 ppm and OFF editing pulses were placed at 7.46 ppm. The acquisition number is 320 (160 ON and 160 OFF transients) per subject. The DIFF spectra are denoted as the subtraction of the ON and OFF spectra.
The ground truth of the ON/OFF/DIFF spectra is derived by taking the average over 160 acquisitions. For the training, we combined randomly sampled acquisitions of each subject to retrieve a signal with noise. Decreasing the number of samples results in higher noise and acceleration rate, which is defined as the ratio of the total acquisition number and the number of acquisitions sampled. This quantity is very handy to assess the power of denoising methods in practical terms. Retrieving accurate denoised signals at a high acceleration rate has implications for the potential reduction of total experimental time.
Results
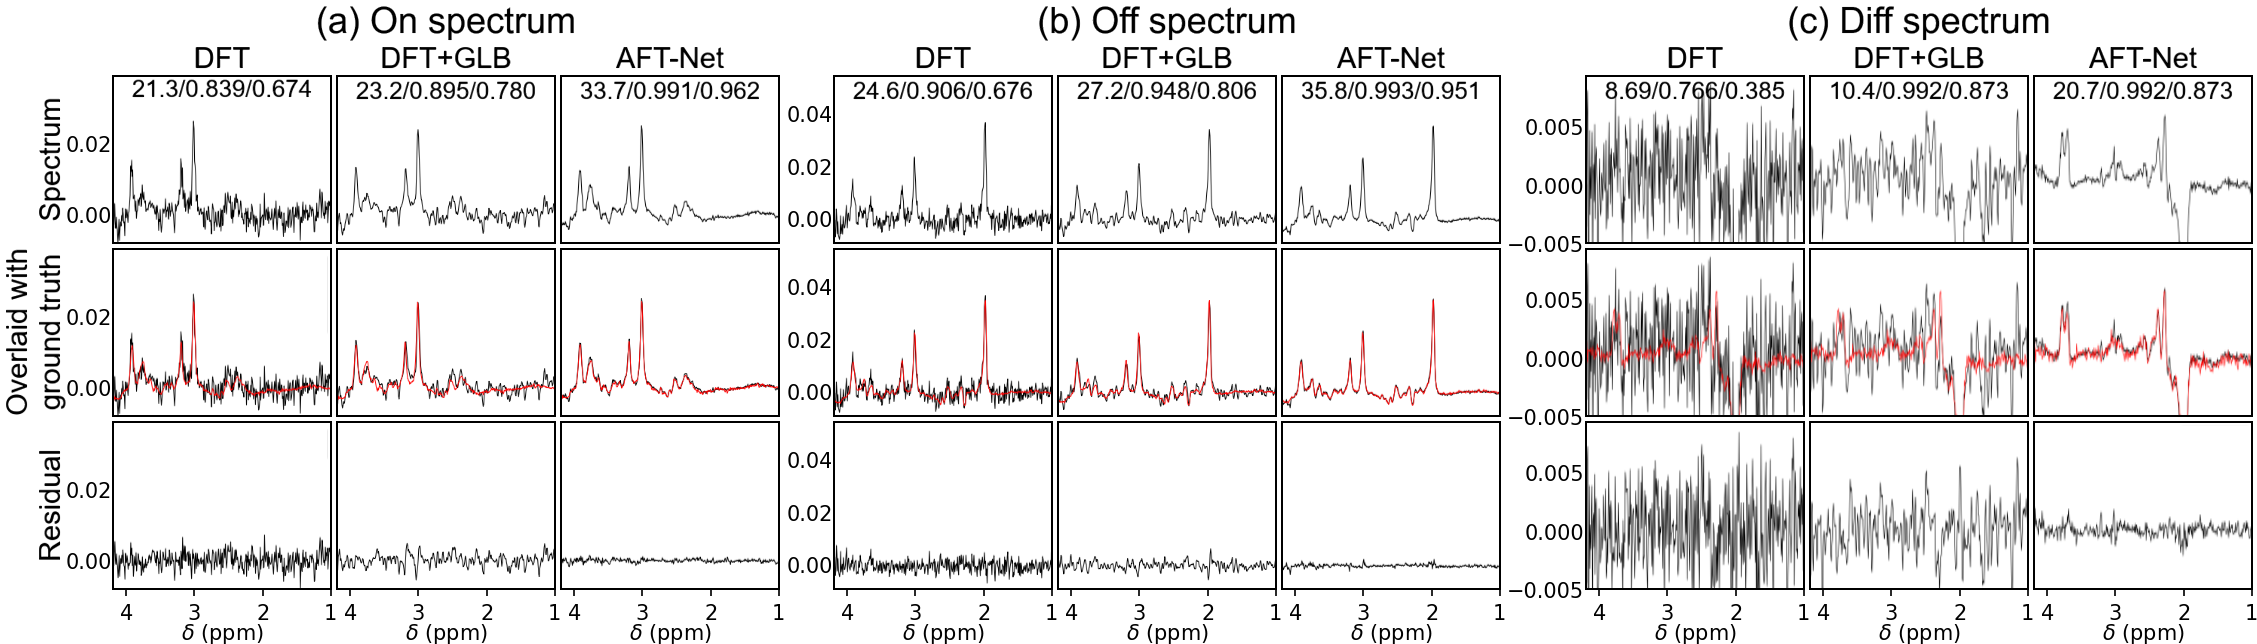
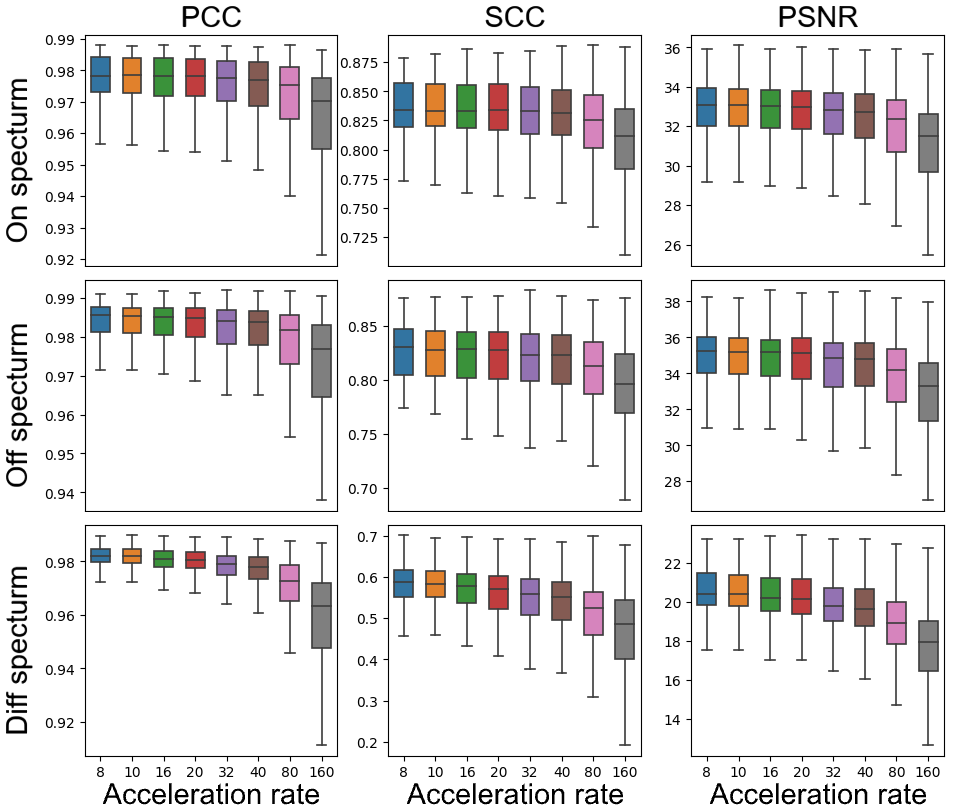
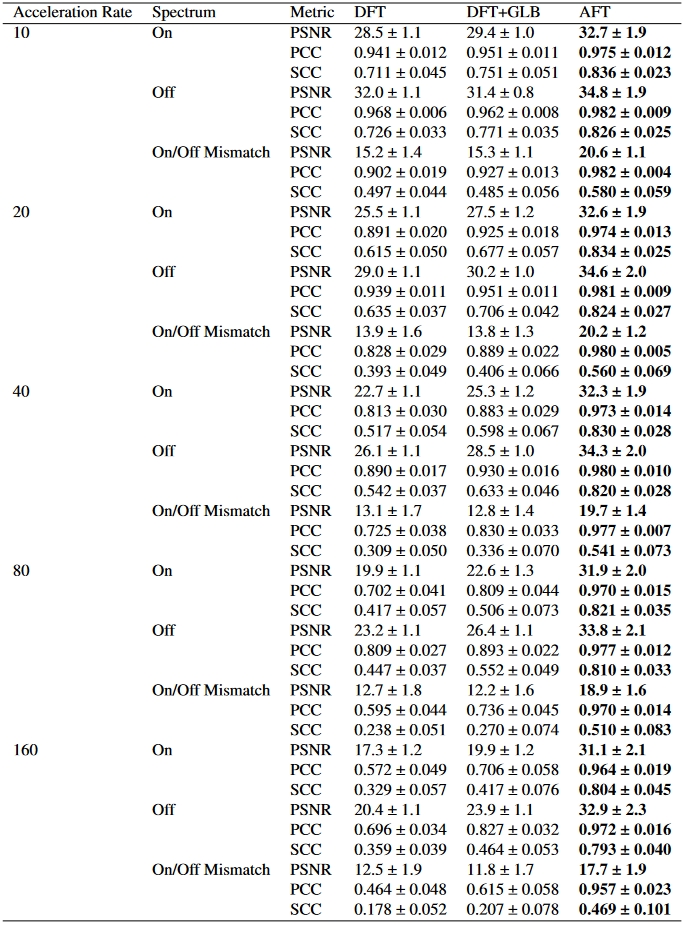
The results of the AFT-Net approach and conventional numerical methods with Gaussian line broadening are illustrated in Figure 3. The first row shows the reconstructed spectrum from the numerical methods and the proposed AFT-Net. The second row indicates the reconstructed spectrum overlaid with the ground truth. The third row plots the difference between the reconstructed spectrum and the ground truth. Under an acceleration rate of 80, where only 2 acquisitions were used over all 160 acquisitions, the AFT-Net shows excellent performance at high acceleration factors. The AFT-Net outperforms other methods for the DIFF spectra, indicating that the AFT-Net removes the noise in the FIDs while preserving the subject-level features.We used PSNR (dB), PCC, and SCC to measure the similarity between the reconstructed spectra and the ground truth, as shown in Figure 4. Take PSNR as an example, the metric value increases as the acceleration rate decreases, but the absolute difference between high and low acceleration rates is tiny (31.1 ± 2.1 for ON spectra under an acceleration rate of 160 vs. 32.7 ± 1.9 for ON spectra under an acceleration rate of 10). In addition, AFT-Net outperforms the DFT+GLB (Gaussian Line Broadening) method across all metrics (Figure 5).
Discussion and Conclusion
A novel artificial Fourier transform framework is proposed that determines the mapping between FIDs and spectra as conventional DFT while having the ability to be fine-tuned/optimized with further training. The flexibility of AFT allows it to be easily incorporated into any existing deep learning network as learnable or static blocks. We then utilized AFT to design our AFT-Net, which implements complex-valued UNet to extract higher features in the temporal domain. We aim to combine reconstruction and denoising into a unified network that simultaneously enhances spectrum quality by removing artifacts directly from the FIDs. Our AFT-Net achieves competitive results and proves to be more robust to noise. One remaining limitation is that we only implement a complex-valued network with linear layers and CNNs, which are less effective than some advanced architectures. In our future work, we will aim to replace multi-layer perceptrons and CNNs with transformer-based and diffusion-based models while extending the concept of AFT to more medical spectroscopy tasks.Code Availability
The code is available at https://github.com/yangyanting233/AFT-Net.Acknowledgements
This study was supported by the Zuckerman Mind Brain Behavior Institute at Columbia University and the Columbia MR Research Center site.References
[1] Ma DJ, Yang Y, Harguindeguy N, Tian Y, Small SA, Liu F, Rothman DL, Guo J. Magnetic Resonance Spectroscopy Spectral Registration Using Deep Learning. Journal of Magnetic Resonance Imaging. 2022 Sep 3.
[2] Trabelsi C, Bilaniuk O, Zhang Y, Serdyuk D, Subramanian S, Santos JF, et al. Deep Complex Networks. 2018 ICLR (Poster)
[3] Ioffe S, Szegedy C. Batch normalization: Accelerating deep network training by reducing internal covariate shift. International conference on machine learning 2015 Jun 1 (pp. 448-456). pmlr.
[4] Mikkelsen M, Barker PB, Bhattacharyya PK, Brix MK, Buur PF, Cecil KM, Chan KL, Chen DY, Craven AR, Cuypers K, Dacko M. Big GABA: Edited MR spectroscopy at 24 research sites. Neuroimage. 2017 Oct 1;159:32-45.
Figures