0335
Real-time MR elastography of the brain in search of the fast viscoelastic response to functional activity1Department of Radiology, Charité - Universitätsmedizin Berlin, Berlin, Germany, 2Berlin Center for Advanced Neuroimaging, Charité - Universitätsmedizin Berlin, Berlin, Germany, 3Application Development, Siemens Healthcare GmbH, Erlangen, Germany, 4Institute of Medical Informatics, Charité-Universitätsmedizin Berlin, Berlin, Germany
Synopsis
Keywords: Elastography, Elastography
Motivation: The need for advanced imaging techniques to precisely localize neuronal activity, overcoming the limitations of fMRI in terms of temporal resolution and direct measurement of neural activation.
Goal(s): To determine how neural activity influences tissue stiffness by detecting viscoelastic changes associated with neuronal firing and hemodynamic responses.
Approach: Using real-time MR elastography techniques to simultaneously measure both BOLD activation and viscoelastic changes in the brain during visual stimulation at two different time scales.
Results: Distinct viscoelastic activation patterns strongly link neurovascular coupling and tissue stiffness. However, no rapid viscoelastic response related directly to the underlying neural activity was detected.
Impact: Functional real-time MR elastography is sensitive to biomechanical property changes associated with the hemodynamic response to brain stimulation providing a valuable tool to study possible effects that occur on a subsecond timescale.
Introduction
The restricted ability to precisely localize neuronal activity at fast time scales is a major challenge in noninvasive neuroscience. The spatiotemporal specificity of functional MRI (fMRI) is limited since neuronal activity is indirectly inferred from the hemodynamic response of the neurovasculature supplying the activated area[1]. While neuronal activity occurs within milliseconds the neurovascular response unfolds within several seconds after stimulus onset.MR elastography (MRE) was recently proposed as a contrast mechanism offering the potential a) to shed light on the biomechanics of the slow hemodynamic response[2,3] or b) to be sensitive to fast sub-second[4] biomechanical processes associated with neuronal firing. The aim of this study is to use novel real-time MRE with a sub-second sampling rate to dynamically resolve viscoelastic responses in both the fast and slow regime and to cover the effect sizes reported in previous fMRE studies.
Methods
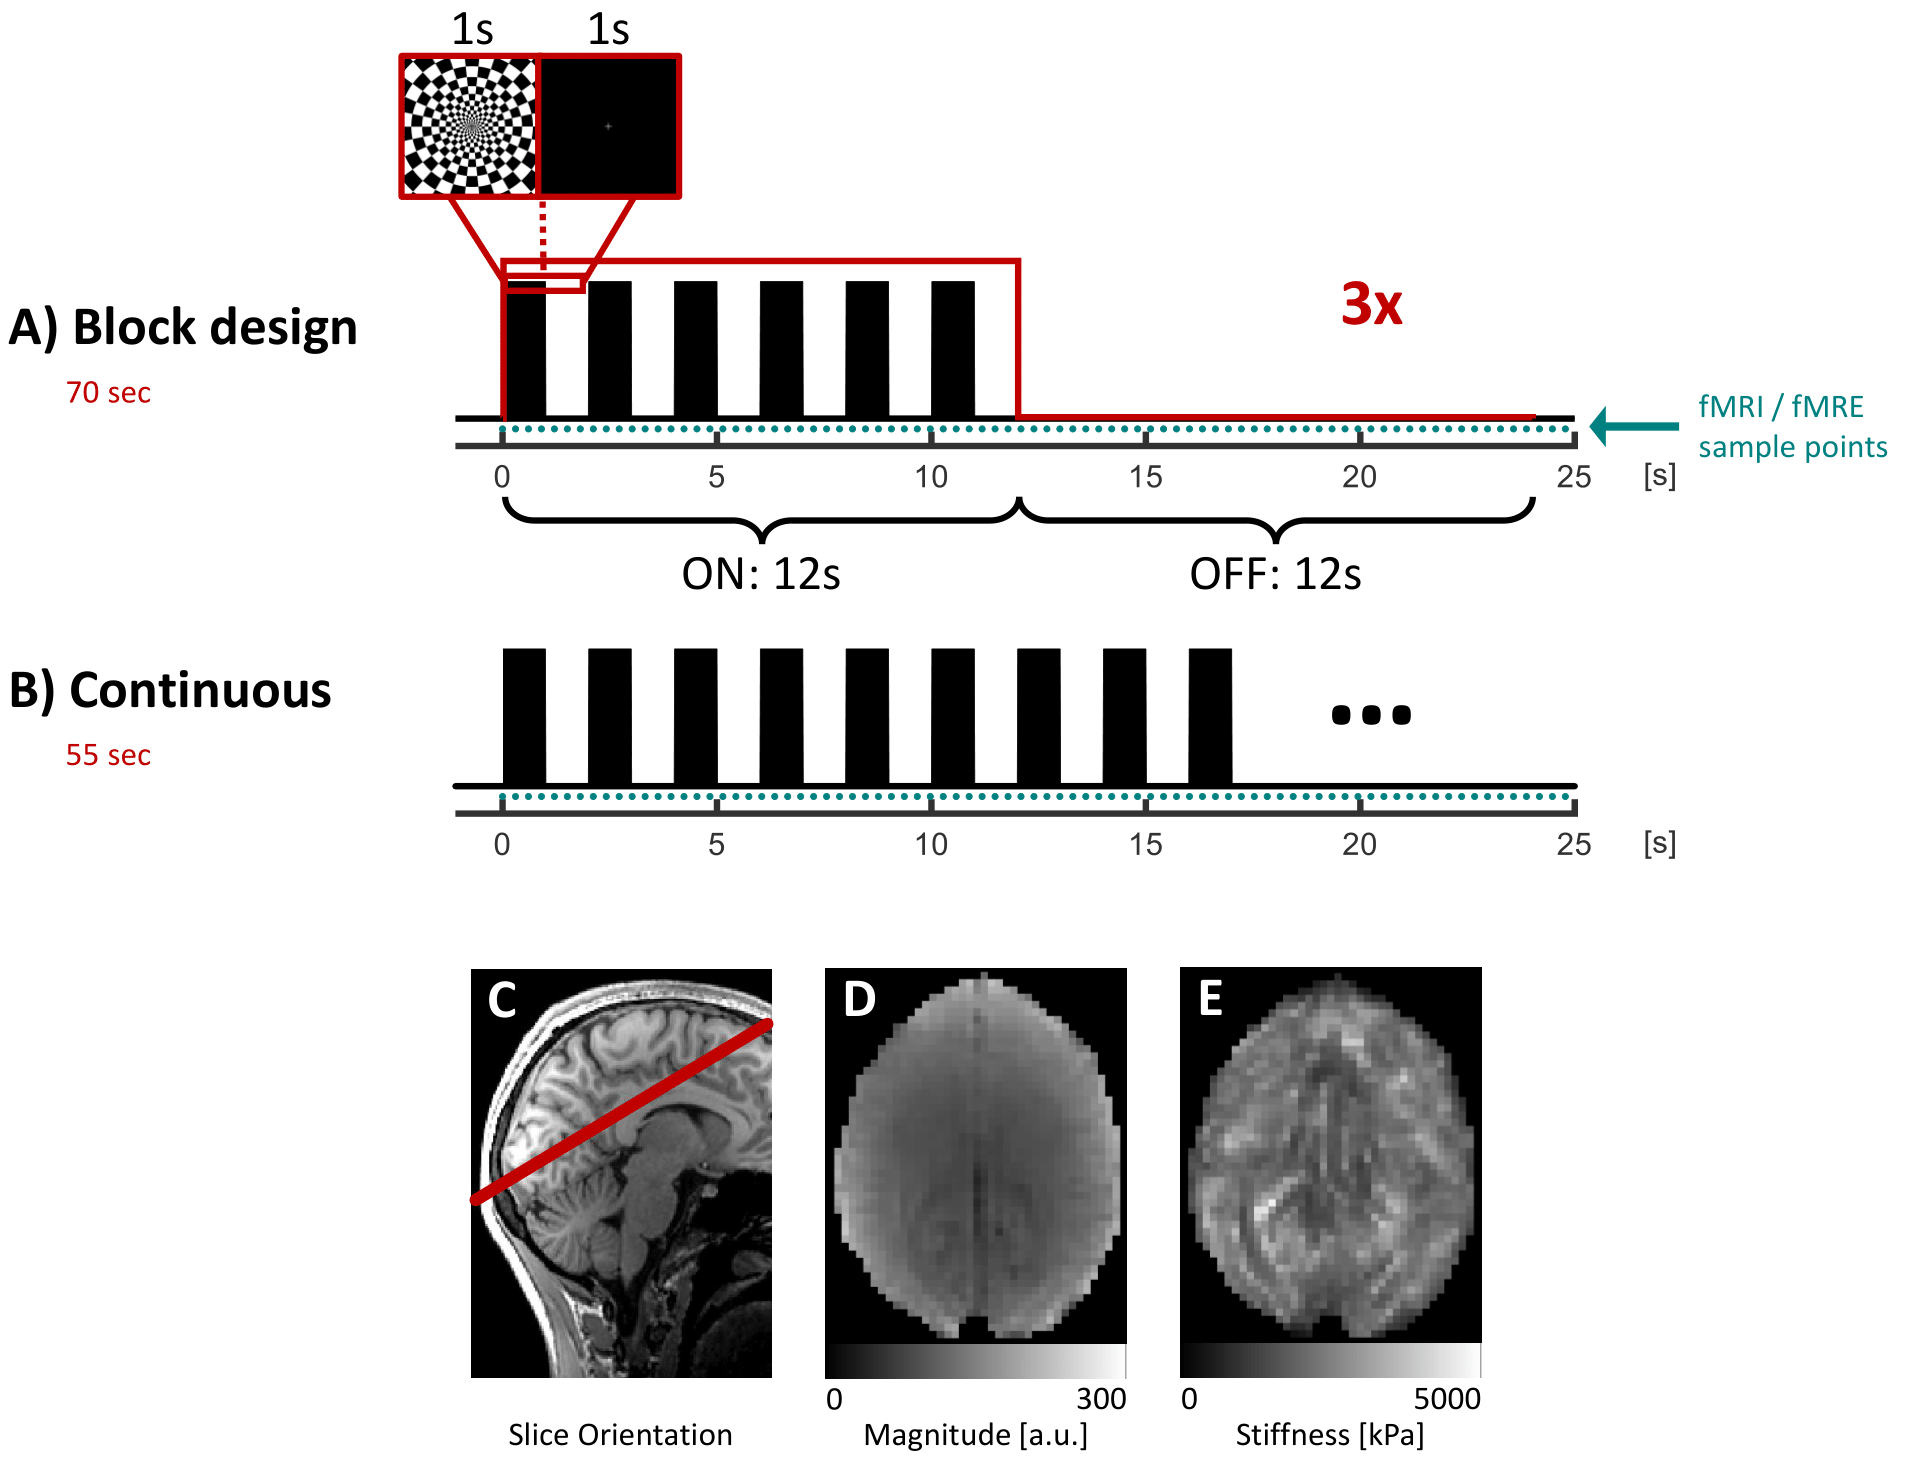
Four healthy volunteers underwent MRE with shear waves induced in the head at 40Hz using compressed air drivers[5] in a 3-Tesla scanner (MAGNETOM Prisma, Siemens, Erlangen).During real-time MRE data acquisition, the subjects were presented with two visual paradigms using a radial checkerboard flickering at 0.5Hz. The first paradigm consisted of 3 blocks of 12s stimulation and 12s rest (Figure 1A). This block-design allows slow neurovascular responses to develop a strong fMRI contrast. The second paradigm targeted a fast viscoelastic response and consisted of a continuous flickering checkboard (Figure 1B) stabilizing the neurovascular response at a plateau characterized by minimal hemodynamic signal fluctuations. The combination of this paradigm with a high-sample-rate MRE would allow the detection of sub-second viscoelasticity changes.
Elastograms were acquired over five wave-phase offsets using a 2D single-shot gradient-echo (GRE) real-time MRE sequence[6] with a single-slice spiral readout and following parameters: TR 55ms, TE 20ms, matrix 64x64, voxel size 3x3x5mm3. Motion was encoded into the phase using flow-compensated motion encoding gradients (MEG). The experiments were repeated for three orthogonal MEG directions, resulting in a temporal resolution of 275ms per elastogram. A total of 300 and 200 elastograms were recorded during the two paradigms, respectively. Following motion correction of fMRE raw data, maps of the magnitude of the complex shear modulus (|G*|) were reconstructed using the MDEV[7] inversion. As the magnitude of the complex MRE raw data is T2*-weighted, simultaneous BOLD and viscoelasticity contrast was provided.
After removal of low-frequency drifts from the BOLD and MRE time courses (IIR-filter, cutoff-frequency 0.03Hz), the signal changes during the block-design paradigm (Figure 1A) were analyzed in SPM12 employing the general linear model (GLM) by convolving the standard double-gamma hemodynamic response function (HRF) with the block-design stimulus waveform. The respective voxel-wise signal changes and average time courses were computed from the activated regions (p<0.001). Because the fast viscoelastic response function of the fast stimulus is unknown, oscillatory signal changes at the flicker frequency of 0.5Hz were extracted from the corresponding spectral component of the time series. The minimal detectable signal change[8] (MDS) was computed based on the voxel-wise coefficient of variation (CoV) of the time course and the number of time samples.
Results
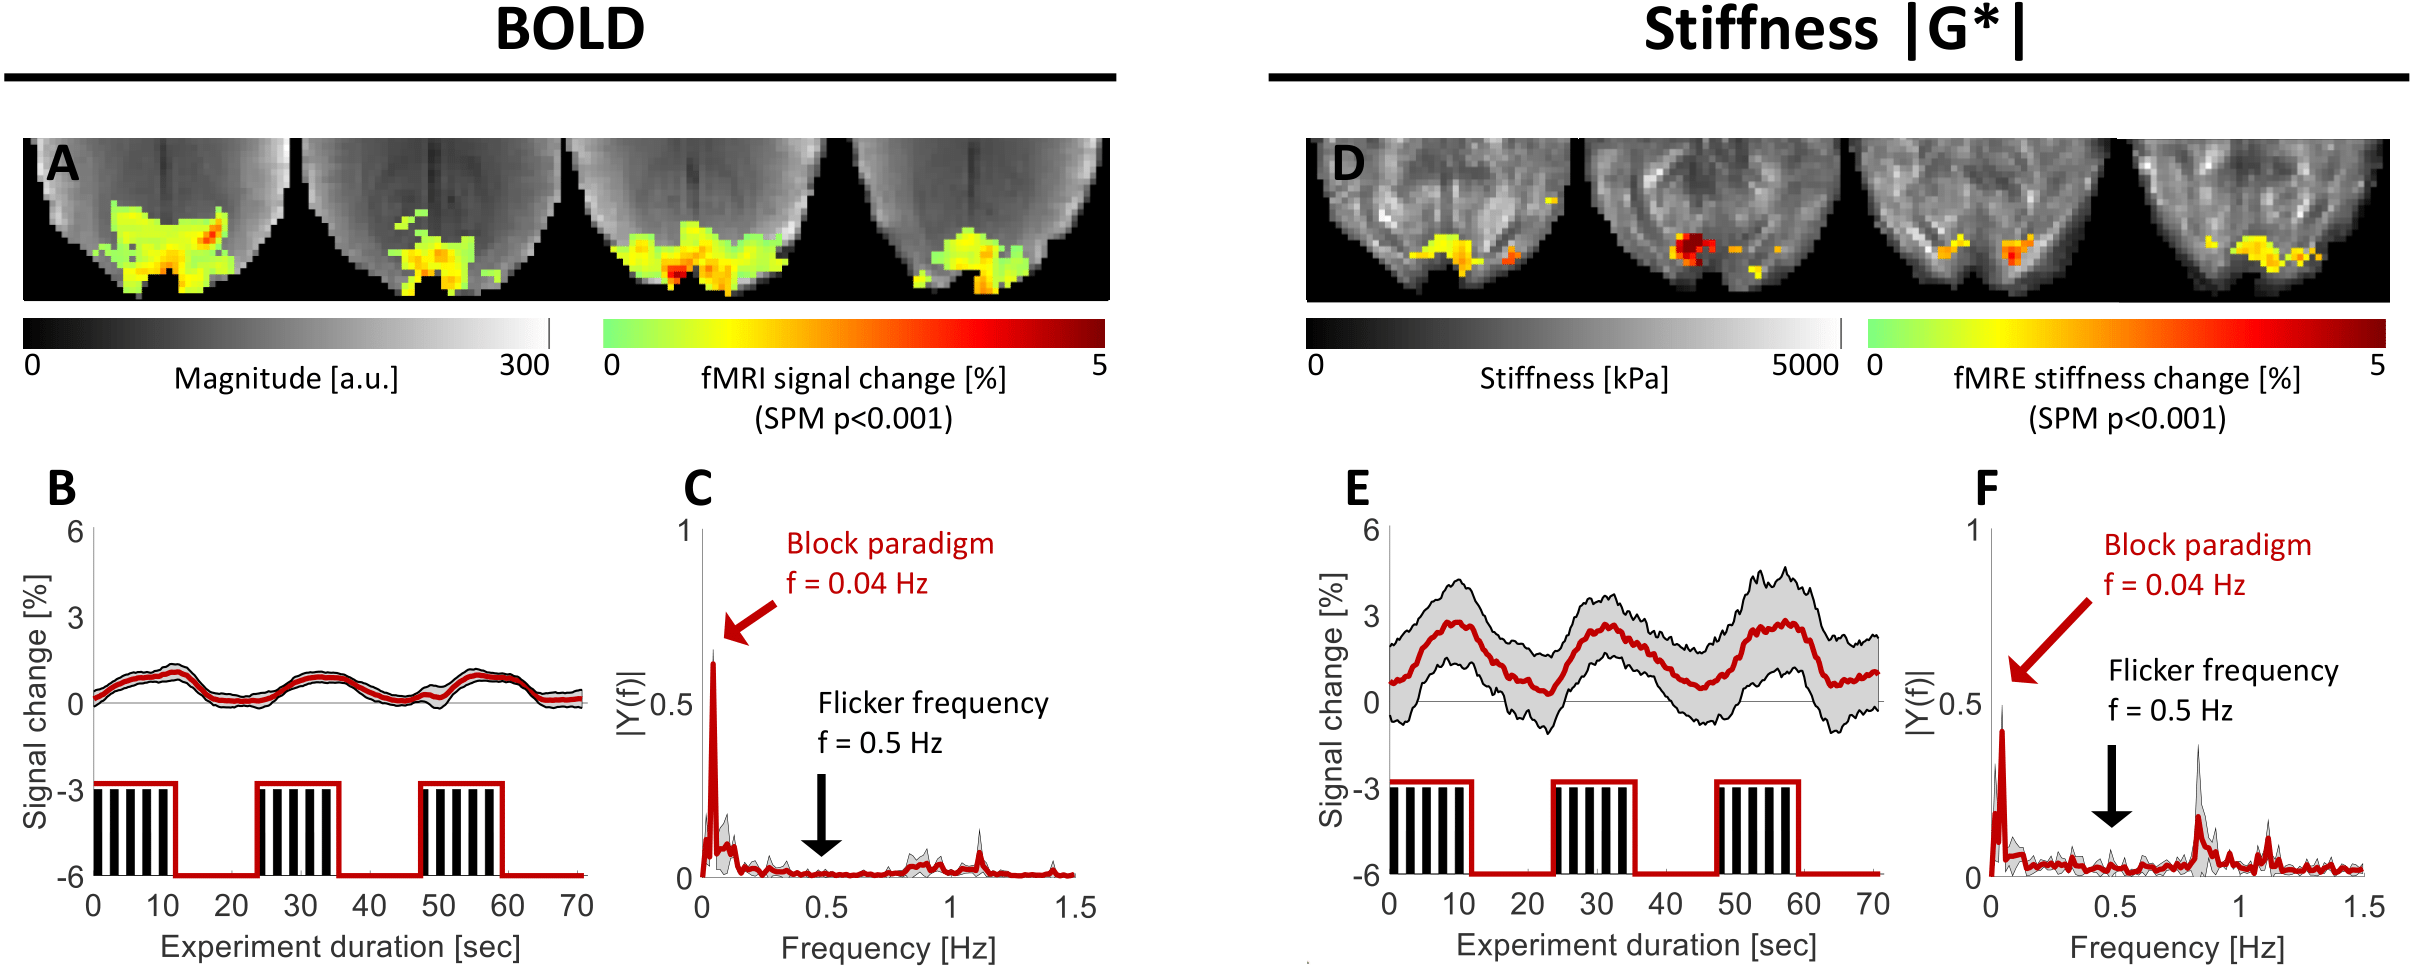
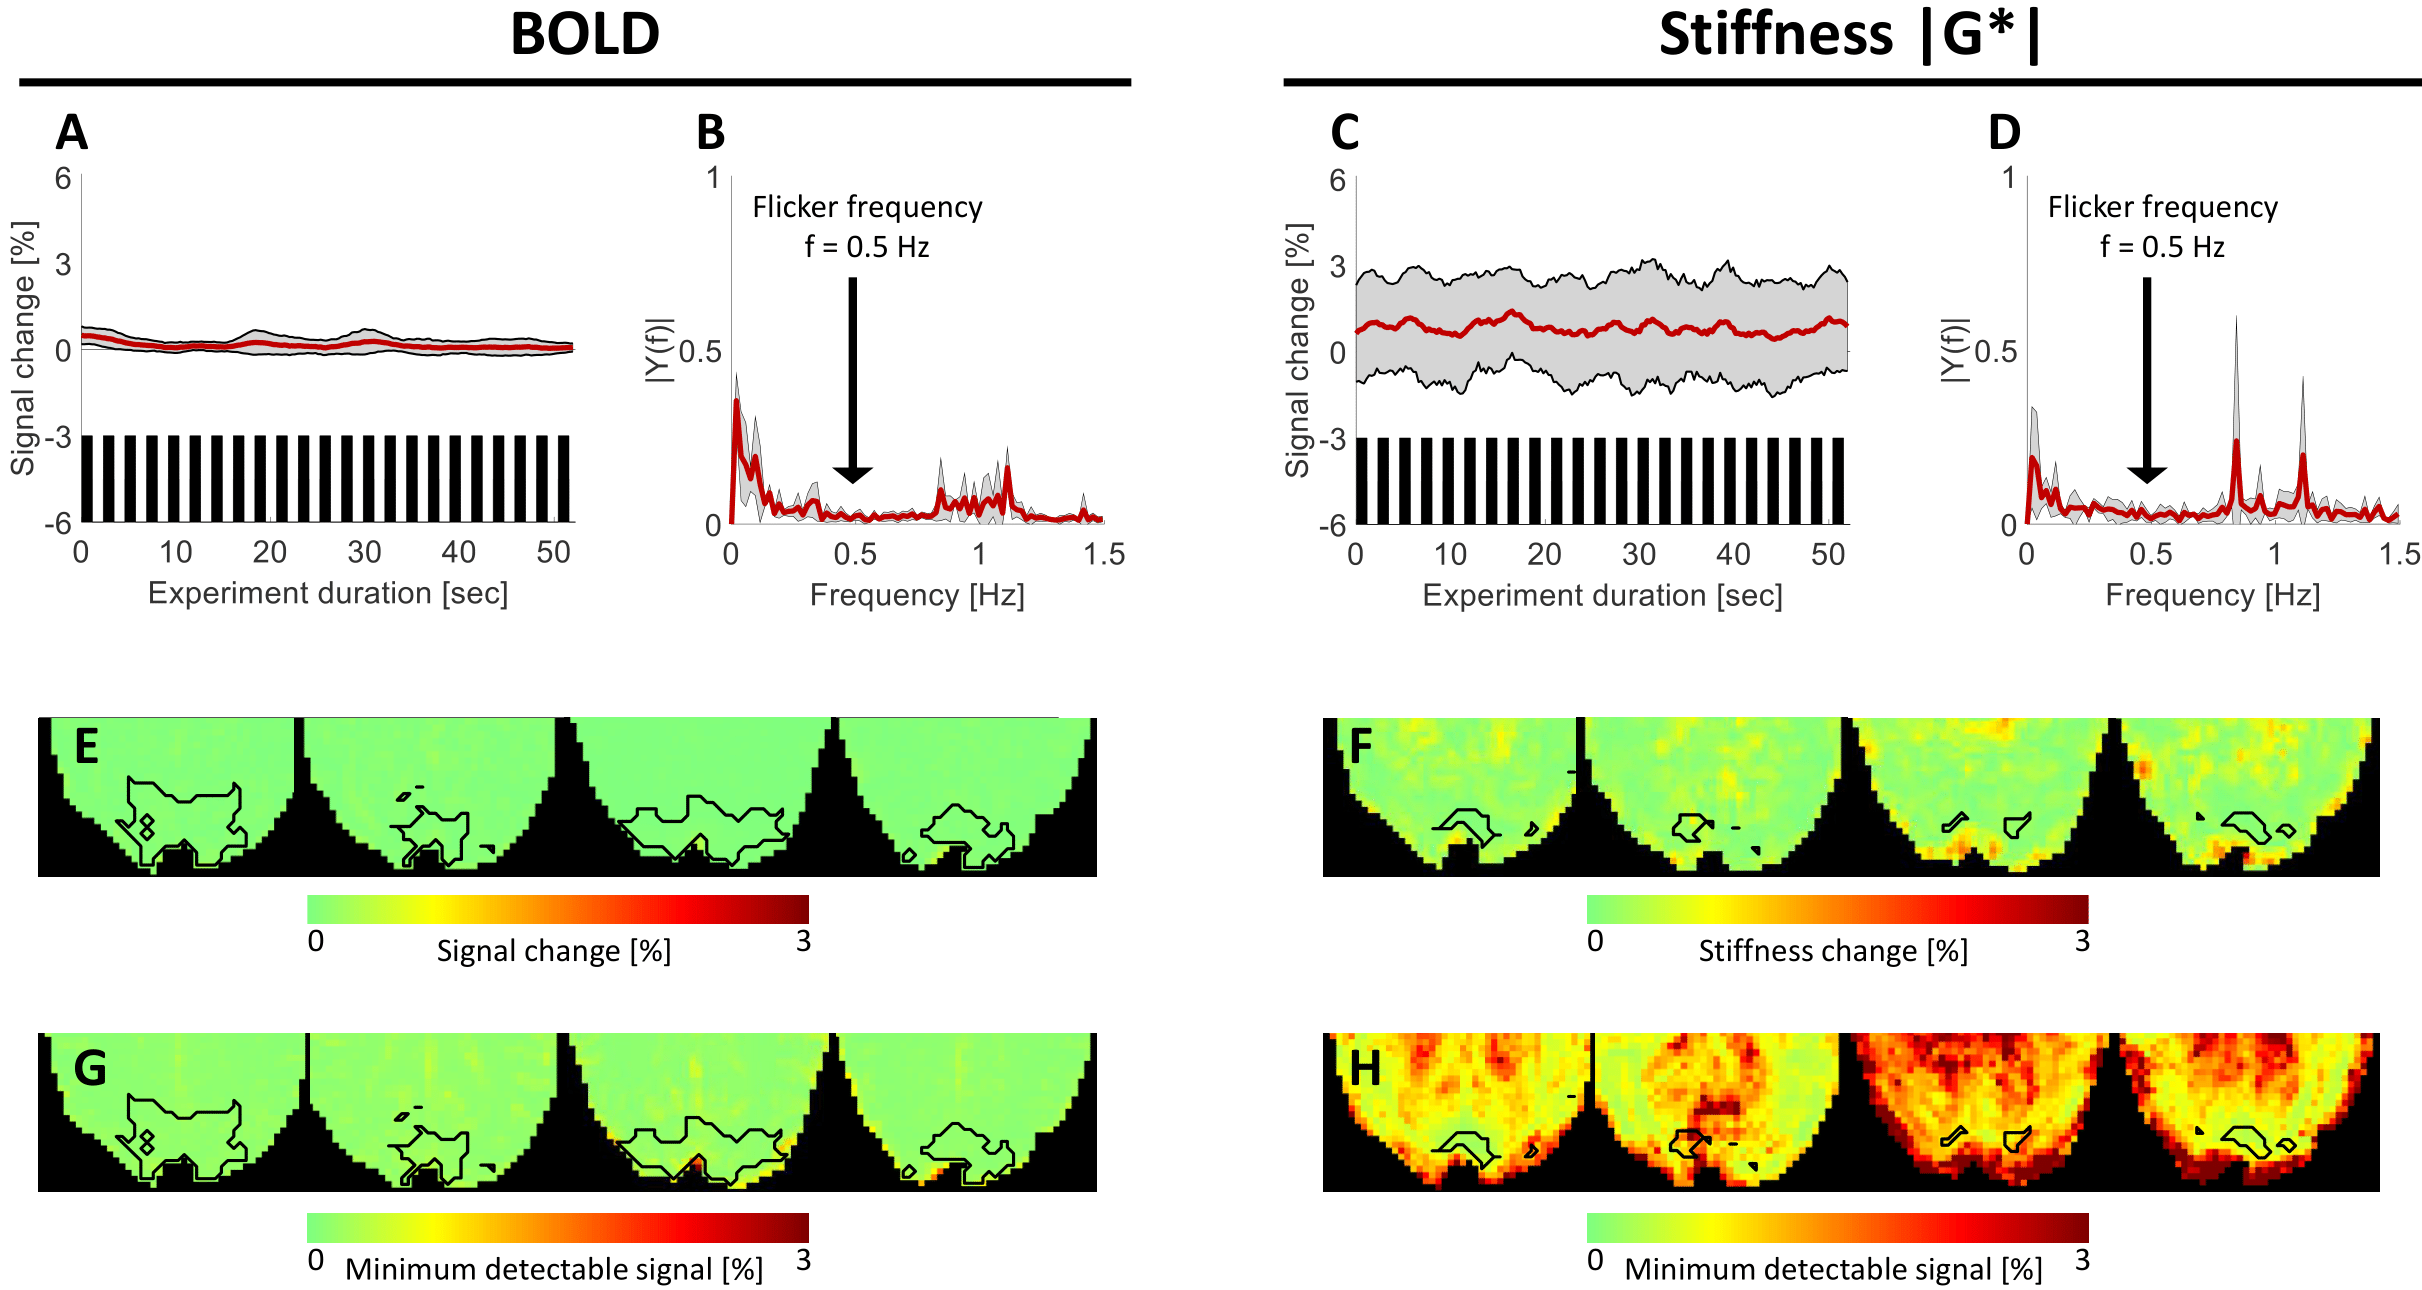
The sensitivity of the real-time MRE sequence to dynamic changes in viscoelasticity was demonstrated. The percent signal change in BOLD and |G*| within the active regions of the visual cortex in response to the slow paradigm are shown in figure 2A,D. The average BOLD activation amplitude was 0.92±0.16%, while the stiffness changed by 2.56±0.87%. Robust, spatially overlapping BOLD and viscoelastic activation patterns were observed in the visual cortex. The spectra for BOLD and |G*| within the active regions are shown in Figure 2C,F. A high spectral intensity was observed for the block-paradigm frequency (0.04Hz), however, not for the flicker frequency (0.5Hz).Real-time MRE was not sensitive to rapid changes in BOLD or |G*| induced by the 0.5Hz paradigm. No peak in the spectra of the time courses was detected at the flicker frequency in the regions activated during the slow paradigm (Figure 3B,D). The MDS was 0.17±0.12% and 0.91±0.70%, respectively. The signal changes based on the spectral intensity (0.5Hz) for BOLD and |G*| are 0.02±0.02% and 0.14±0.11% respectively and are shown in figure 3E,F.
Discussion and Conclusion
The observed viscoelastic changes in response to the slow paradigm are consistent with recent fMRE studies, suggesting that tissue stiffness may be a robust marker of neurovascular activation[2].However, we were unable to verify recent reports of rapid hemodynamic[9] or viscoelastic responses[4] to functional activation. The absence of fast viscoelastic responses in our data indicates that potential stiffness changes directly related to neuronal firing occur on spatiotemporal scales outside the sensitivity range of real-time MRE.
Acknowledgements
The authors gratefully acknowledge funding from the German Research Foundation (GRK2260, BIOQIC, Sa901/17-2, CRC1540 EBM).References
[1] Buxton, NeuroImage 2004, 23 Suppl 1:S220-33, 10.1016/j.neuroimage.2004.07.013
[2] Lan, NeuroImage 2020, 211:116592, 10.1016/j.neuroimage.2020.116592
[3] Forouhandehpour, Neuroimage Reports 1 2021, 100014, 10.1016/j.ynirp.2021.100014
[4] Patz, Sci. Adv. 2019, 5:3816 10.1126/sciadv.aav3816
[5] Schrank, JCBFM 2020, 40:991-1001, 10.1177/0271678X19850936
[6] Herthum, Front. Bioeng. Biotechnol 2021, 9:666456, 10.3389/fbioe.2021.666456
[7] Papazoglou, Phys. Med. Biol. 2012, 57:2329-2346, 10.1088/0031-9155/57/8/2329
[8] Murphy, NeuroImage 2007, 34:565-574, 10.1016/j.neuroimage.2006.09.032
[9] Toi, Science 2022, 378:160-168, 10.1126/science.abh4340
Figures