0334
A framework for graph theory analyses of functional connectivity within resting state networks (RSNs) of neonates1Biomedical Engineering Research Centre, Division of Biomedical Engineering, Department of Human Biology, Faculty of Health Sciences, University of Cape Town, Cape Town, South Africa, 2Neuroscience Institute, University of Cape Town, Cape Town, South Africa, 3Tygerberg Children’s Hospital, Faculty of Medicine and Health Sciences, Stellenbosch University, Cape Town, South Africa, 4A.A. Martinos Center for Biomedical Imaging, Massachusetts General Hospital, Charlestown, MA, United States, 5Department of Radiology, Harvard Medical School, Boston, MA, United States, 6Cape Universities Body Imaging Centre, University of Cape Town, Cape Town, South Africa
Synopsis
Keywords: Functional Connectivity, Neonatal
Motivation: The topological organisation of RSNs can be studied with graph theory. While graph nodes can be defined using atlases in adults, infant atlases are not readily available.
Goal(s): To create a framework to define nodes and edges for graph theory analyses of infant RSNs.
Approach: We resampled the original template voxel size and created evenly distributed nodes within RSNs.
Results: We present a mask comprising 605 evenly-spaced spheres to discretize neonatal RSNs. Graph theory demonstrated lower global and/or nodal efficiency in 4 networks in HEU neonates compared to HUU, indicating decreased information transmission throughout and regionally within affected networks.
Impact: The proposed method may enable more comprehensive analyses of the topological organisation of RSNs in infant cohorts. This will advance knowledge on how functional networks process and distribute information from birth.
Introduction
Infants and children who are HIV exposed and uninfected (HEU) are at risk of developmental delays compared to uninfected unexposed (HUU) populations. The effects of in utero and perinatal HIV and ART exposure on the developing brain are not well understood.Previous resting state functional MRI (rs-fMRI) studies have established that the basic functional network architecture seen in adults is already in place at birth. Typically, group independent-component analysis (ICA) is used to identify resting state networks (RSNs) within which pathology-related functional connectivity (FC) changes are examined on a voxelwise basis1. Graph theory approaches may increase understanding of group differences in the topological organisation of RSNs.
Graph theory requires discretisation of RSNs into distinct nodes and interconnecting edges. The breakdown of functional networks into discrete nodes is not trivial. Previous studies used structural seeds or functionally-defined atlases 2–6 to achieve this, but suitably parcellated infant templates are not readily available. Here we propose a framework for parcellating infant rs-fMRI data and RSNs into nodes for graph theory analyses and conduct group comparisons on a cohort of HEU and HUU infants.
Methods
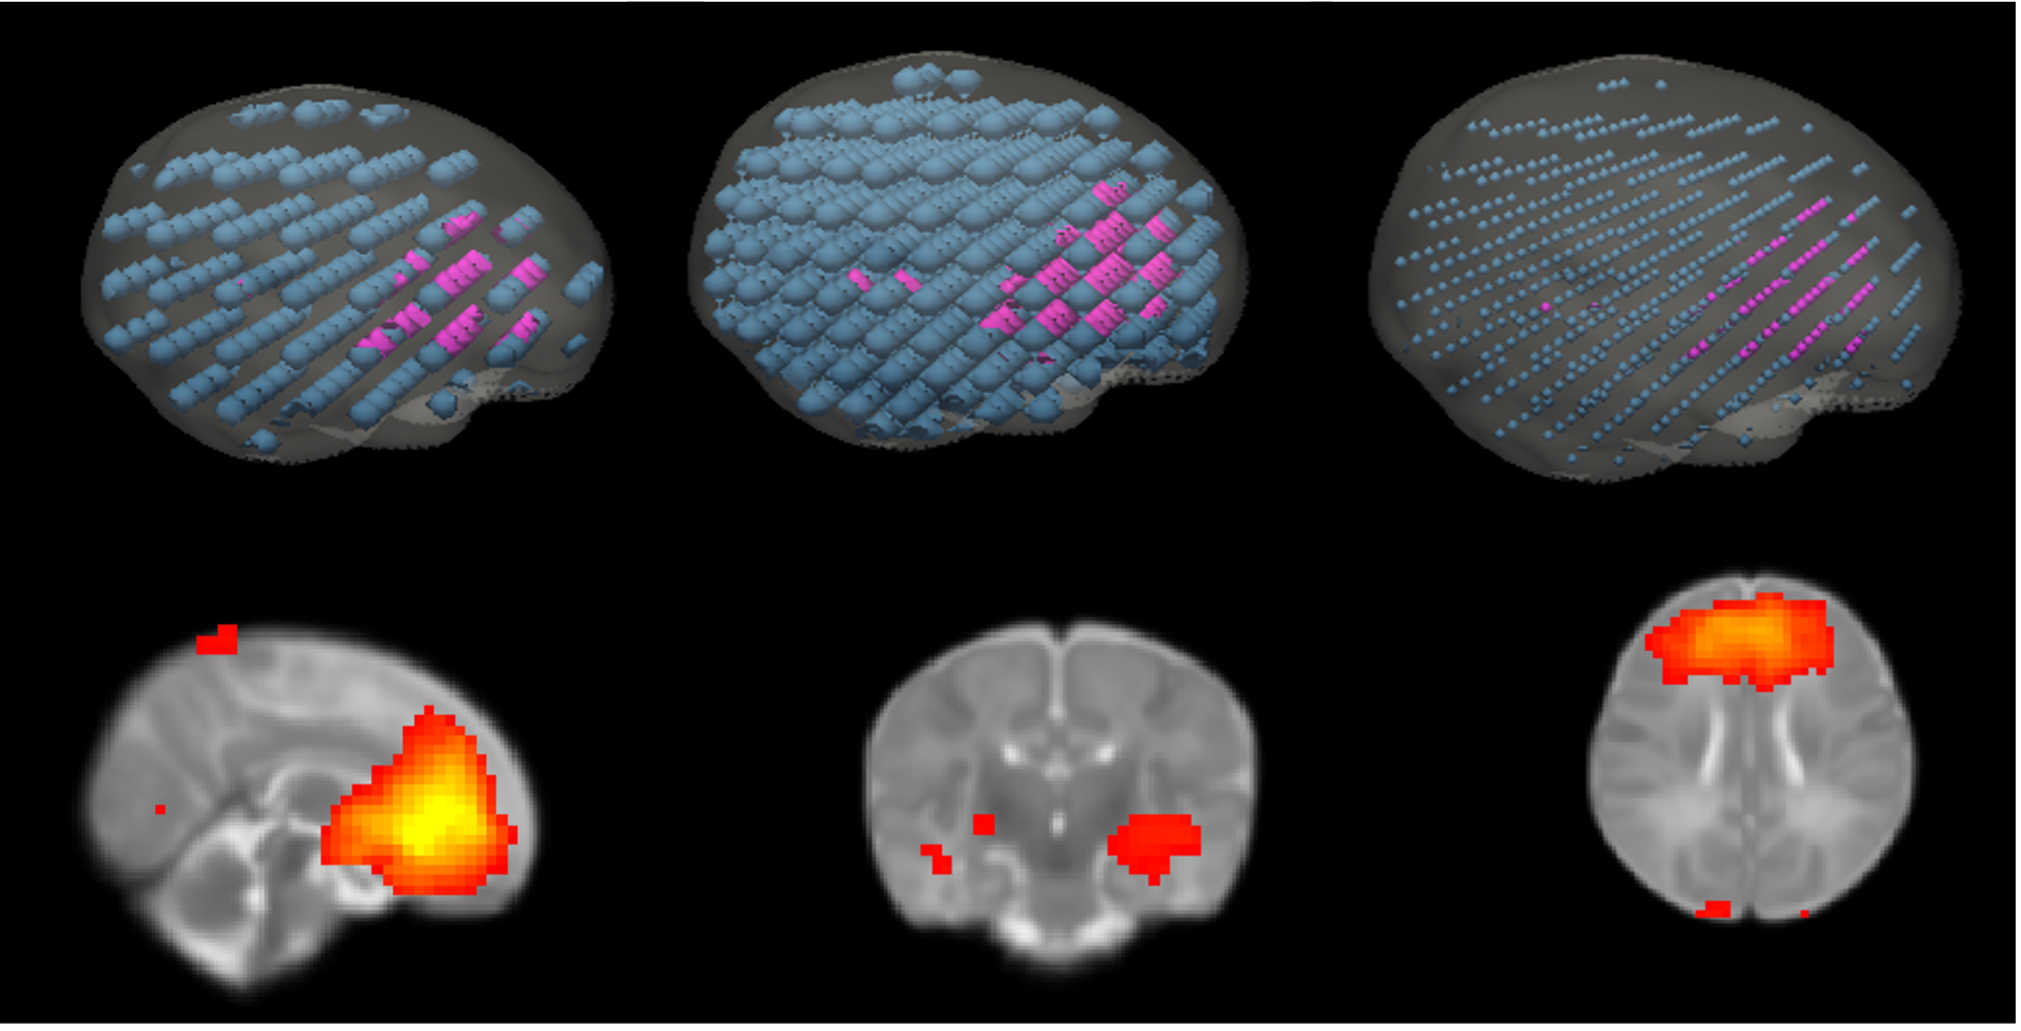
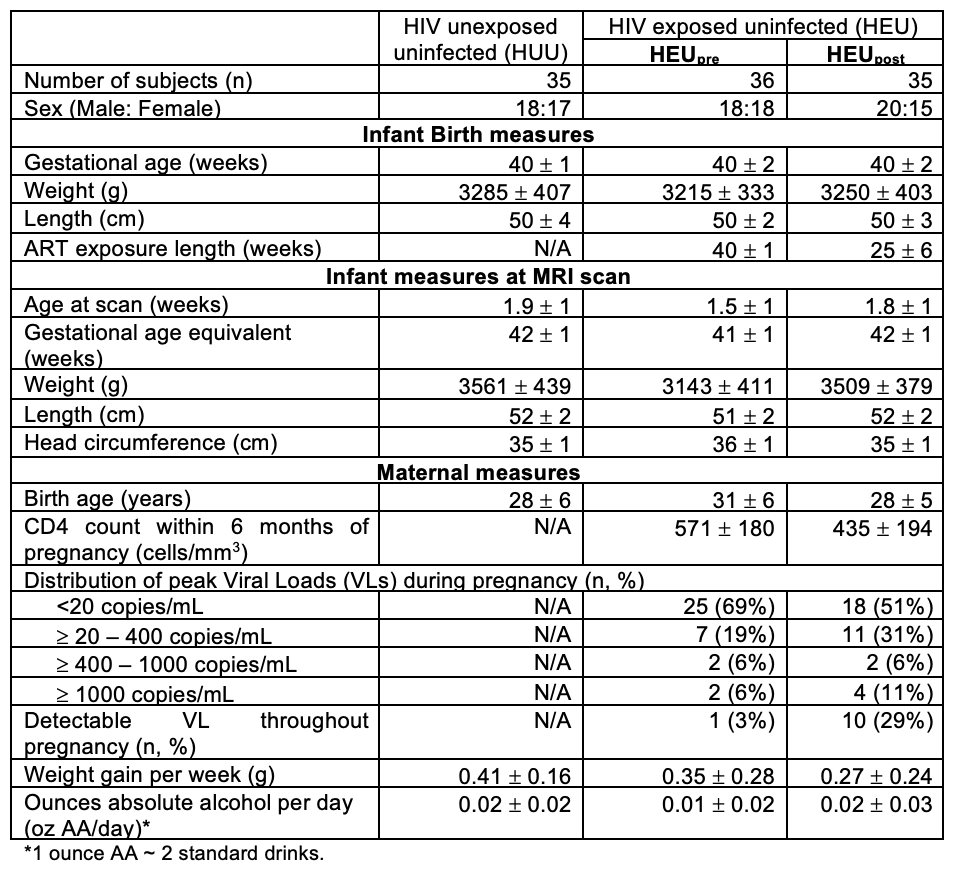
Resting-state functional MRI (rs-fMRI) were acquired on a 3T Skyra in neonates (mean GA 41.4 ± 1.0 weeks) who were exposed to HIV with antiretroviral therapy (ART) exposure either from the start of conception (HEUpre) or from 3-6 months post conception (HEUpost), and HIV unexposed controls (Table 1). Rs-fMRI data (2.53 mm3; 270 volumes) were processed in AFNI7 and co-registered to an infant atlas8. Group ICA was performed in FSL9 to identify 14 RSNs, which were binarised.Three whole-brain masks with 200 (radius 5mm) or 605 (radii 5 or 2.5mm) evenly-dispersed spheres were created in the template space by resampling the voxel size to 153mm3 and 103mm3, respectively, capturing the resulting image coordinates, and transforming the coordinates into spheres using AFNI’s 3dmaskdump and 3dUndump functions.
The masks of spheres were multiplied by binarized RSN masks to define 3 nodal sets for each RSN. A sphere was assigned to a RSN if ≥ 50% of its volume overlapped with the RSN mask. The optimal nodal set, in terms of the number of nodes per RSN and the nodes being spatially distinct, was selected for graph theory analysis.
For each RSN, the mean rs-fMRI time series data were extracted within each node for each subject. Pairwise Pearson correlations of time series data were computed between nodes to construct FC correlation matrices. These correlation matrices were then used as inputs for graph theory analysis, where the nodes are the spherical ROIs and the edge weights are the absolute values of the Fisher z-transformed Pearson correlation values.
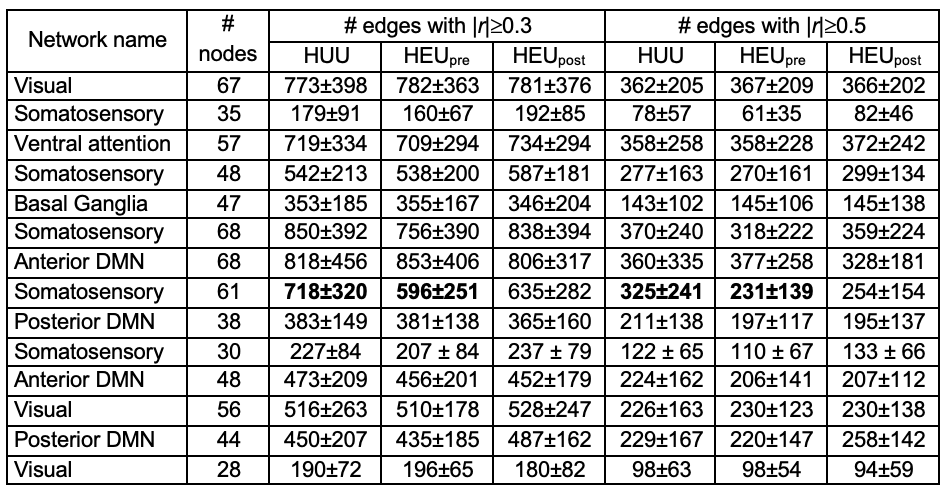
Regression modelling was performed to identify HIV and ART exposure related differences in graph measures within RSNs. We also compared between groups the number of edges within each RSN with absolute temporal correlations ≥0.3 and ≥0.5, respectively.
Results
For the 200- and 605-node masks, the number of nodes per RSN ranged from 8 to 22, and 28 to 68, respectively (Figure 1). Since 605 spheres with radius 5mm demonstrated spatial overlap, the 605-node mask with spheres of 2.5 mm radius was chosen for graph theory analysis.Neonates in the HEUpre group exhibited lower global efficiency than HUU in the ventral attention, visual and anterior default mode (DMN) networks. In HEUpost, the somatosensory network had lower global efficiency, as well as 3 nodes with lower nodal efficiencies, than HUU.
For each RSN, the number of edges at both FC thresholds were similar across groups, except within the somatosensory network where HEUpre tended to have fewer edges than HUU at both thresholds (2-tail student’s t-test p=0.09 and 0.07, respectively).
Discussion
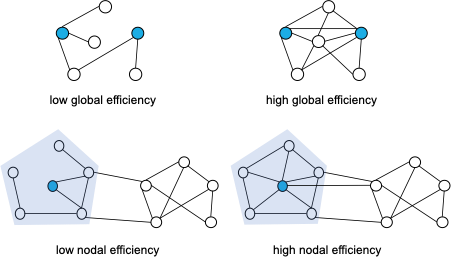
As illustrated in Figure 2, global efficiency is an integration network measure that represents the capacity to rapidly combine information from dispersed brain regions, while nodal efficiency characterises how connected a node is to every other node in the network. Global efficiency reductions therefore point to diminished information transmission within affected networks, and decreased nodal efficiency to decreased functional connectivity of affected nodes to the rest of the network. Fewer edges with strong FC suggest that the somatosensory network is affected in HEUpre, despite the absence of graph measure differences.Conclusion
We present a novel framework for parcellating neonatal RSNs into nodes for graph theory analyses. Using the proposed method, we found diminished global and/or nodal efficiency within 4 RSNs in HEU groups, highlighting potential diminished functional integration. Graph theory provides a more comprehensive picture regarding HIV exposure related changes in topological organisation.Acknowledgements
Funding:
- NIH grants R01 HD085813 & R01 HD093578
- NRF/DST South African Research Chairs Initiative (UID 48337, 120140 )
- UCT University Research Committee COVID salary relief
- UCT University Equipment Committee (MRI paediatric coil)
Many thanks to:
- MRI Research team
- CUBIC staff
- Mothers & their infants
References
1. Zhang, H., Shen, D. & Lin, W. Resting-state Functional MRI Studies on Infant Brains: a Decade of Gap-Filling Efforts. Neuroimage 185, 664 (2019).
2. Craddock, R. C., James, G. A., Holtzheimer, P. E., Hu, X. P. & Mayberg, H. S. A whole brain fMRI atlas generated via spatially constrained spectral clustering. Hum Brain Mapp 33, 1914–1928 (2012).
3. Zhang, S. et al. Joint Analysis of Functional and Structural Connectomes Between Preterm and Term Infant Brains via Canonical Correlation Analysis With Locality Preserving Projection. Front Neurosci 15, 724391 (2021).
4. Power, J. D. et al. Functional Network Organization of the Human Brain. Neuron 72, 665–678 (2011).
5. Smyser, C. D. et al. Resting-State Network Complexity and Magnitude Are Reduced in Prematurely Born Infants. Cereb Cortex 26, 322–333 (2016).
6. Jia, C. et al. Independent Component and Graph Theory Analyses Reveal Normalized Brain Networks on Resting-State Functional MRI After Working Memory Training in People With HIV. Journal of Magnetic Resonance Imaging 57, 1552–1564 (2023).
7. Cox, R. W. AFNI: Software for analysis and visualization of functional magnetic resonance neuroimages. Computers and Biomedical Research 29, 162–173 (1996).
8. Shi, F. et al. Infant Brain Atlases from Neonates to 1- and 2-Year-Olds. PLoS One 6, e18746 (2011).
9. Smith, S. M. et al. Advances in functional and structural MR image analysis and implementation as FSL. Neuroimage23 Suppl 1, (2004).
Figures