0330
Differential control of nonlinear functional dynamics by cerebro-cerebellar interactions during action execution and observation1Department of Brain and Behavioral Sciences, Università di Pavia, Pavia, Italy, 2Department of Diagnostic Radiology, College of Applied medical sciences, King Abdulaziz University, Jeddah, Saudi Arabia, 3NMR Research Unit, Queen Square MS Centre, Department of Neuroinflammation, UCL Queen Square Institute of Neurology, Faculty of Brain Sciences, University College London, London, United Kingdom, 4Digital Neuroscience Centre, IRCCS Mondino Foundation, Pavia, Italy, 5Department of Mental Health and Dependence, ASST of Pavia, Pavia, Italy
Synopsis
Keywords: Functional Connectivity, Brain Connectivity, Dynamic Causal Modeling, BOLD, Neuroscience
Motivation: Task-driven BOLD signal nonlinearities in visuomotor areas have been reported both during execution and observation of tasks.
Goal(s): We aim to study how cerebral and cerebellar regions of a visuomotor network influence each other and drive nonlinear BOLD responses.
Approach: Dynamic Causal Modeling was used to estimate causal influences as effective connectivity to assess how the activity of each region modulated BOLD signal nonlinearities in a visuomotor task.
Results: Execution and observation networks showed the same fixed (0th order) effective connectivity, while BOLD signal nonlinearities were modulated in the motor planning loop during execution only and were driven by the cerebellum.
Impact: Dynamic causal modeling elucidates the central role of the cerebellum as a forward controller in regulating input-driven modulation differentially in execution and observation. These mechanisms may be affected by pathologies and could have an important role in visuomotor disability.
Introduction
Functional Magnetic Resonance Imaging (fMRI) protocols were designed to investigate the complex involvement of cerebral and cerebellar areas in motor planning and execution. A “squeeze-ball” task assessed the relationship between applied grip-force (GF) levels and the Blood Oxygen Level Dependant (BOLD) signal in active brain regions during both action execution (AE) and action observation (AO)1,2.However, the causal interaction between the multiple brain areas involved in the task and the specific role of cerebellum in controlling the BOLD-GF nonlinearities, was not investigated.
Here we leveraged on fMRI and Dynamic Causal Modeling (DCM)3 to identify activated areas and their causal relationship in AE and AO, separately. We investigated the inter-regional causal influences (i.e., fixed effective connectivity) between active brain regions and then disentangled the linear and nonlinear transformations that occurred in the BOLD-GF relation in the motor planning loop (i.e., modulation on fixed effective connectivity). Analysing changes in fixed effective connectivity strength and in the complexity of the BOLD-GF transformation may clarify how motor processes are differently integrated during execution and observation.
Methods
Details of subjects engaged in AE and AO squeeze-ball tasks1,2 and technical details of the experiment are reported in Figure 1. The visuomotor network included: bilateral primary visual cortex (V1), left primary motor cortex (M1), left supplementary motor area with premotor cortex (SMAPMC), left cingulate cortex (CC), left superior parietal lobule (SPL), and right cerebellum (CRBL). Time-series (i.e., BOLD) extraction was implemented with a conjunction analysis (Figure 2A), including anatomical and functional constraint to extract subject-specific activations. Multiple models were hypothesised (H1 and H2) and then scored with Random Effects Bayesian Model Selection (RFX-BMS)4.H1) Fixed effective connectivity: Based on prior knowledge, a set of five models with different architectures of inward and outward connections were tested for AE and AO, separately5–10 (Figure 2B). Architectures were tested considering 0th order BOLD-GF relation (i.e., activation vs. rest)
H2) Modulations on the effective connectivity: The modulations were tested on the “winning” model resulting from H1) for AE and AO, separately (Figure 3). Combinations of linear (i.e., 1st order) and nonlinear (i.e., 2nd order) transformations of the BOLD-GF relation were investigated between the regions involved in visual processing and motor planning. An exhaustive search was performed across the model space, forward from V1 and backward to V1 separately, by implementing a stack procedure of model evaluation which, at each step, increased the number of modulations on models that reach convergence.
Results
H1): The same architecture of fixed effective connectivity was estimated with a probability > 90% both for AE, and AO with a forward and backward path in the visuomotor planning loop (V1, CRBL, SMAPMC and CC, Figure 4). AE exhibited stronger fixed effective connectivity than AO, with different excitatory/inhibitory connections.H2): Figure 5 shows the winning models for AE and AO, showing excitatory, inhibitory linear and nonlinear connections in the forward and backward pathways. Most distinguishable is that in AE there are nonlinear transformations between SMAPMC and CBRL as well as for self-recurrent CBRL; in AO, all transformations from region to region are linear. Moreover, in AE the forward path is mostly inhibitory, while the backward path is excitatory; in AO, most connections are excitatory.
Discussion
Our study showed specific interactions in the cerebro-cerebellar visuomotor circuit that subtend functional activation and are unique to AE and AO. Execution and observation conditions are best represented by the same effective connectivity architecture, demonstrating that the feedback provided by CC and projected towards V1 occurs not only in AE but also in AO. The diverging network activation in AE and AO was captured by the different excitatory/inhibitory connections. For instance, the cerebro-cerebellar motor planning loop (i.e., CRBL, SMAPMC, CC) exhibits excitation for AE and inhibition for AO: even though it is functionally activated during both execution and observation, the neuronal mechanisms subtending function are of different nature. This outcome emphasizes the importance of including microscale heterogeneity in macroscale connectivity studies11–13. Modulations analysis unveils the BOLD-GF transformation in visuomotor planning and associative areas. Nonlinearities found in the AE backward transmission suggest that CRBL mediates the interaction between visual and motor planning areas by performing motor prediction and error detection operations14,15 during AE; interestingly, the CRBL linearly sends back signals to V1 and motor planning areas during AO when predictive/control functions are less required.Conclusion
This DCM analysis reveals a central role of CRBL as a controller, which differentially regulates effective connectivity between visuomotor network regions. Further investigations are warranted on how these mechanisms might be impaired in neurological diseases.Acknowledgements
This research has received funding from the European Union’s Horizon 2020 Framework Program for Research and Innovation under the Specific Grant Agreement No. 945539 (Human Brain Project SGA3) to ED, CGWK, FP. CGWK received funding from BRC (#BRC704/CAP/CGW), MRC (#MR/S026088/1), Ataxia UK, Rosetree trust (#PGL22/100041 and #PGL21/10079). CGWK is a shareholder in Queen Square Analytics Ltd. This research has also received funding from Centro Fermi project “Local Neuronal Microcircuits” to ED. Special acknowledgement to EBRAINS and FENIX for informatic support and infrastructure. RL have been supported by Human Brain Project SGA3. This work was also supported by #NEXTGENERATIONEU (NGEU) and funded by the Ministry of University and Research (MUR), National Recovery and Resilience Plan (NRRP), project MNESYS (PE0000006) – A Multiscale integrated approach to the study of the nervous system in health and disease (DN. 1553 11.10.2022) to ED and CGWK; and Project EBRAINS-Italy (IR00011) - (M4C2 Line 3.1 of the PNRR, Action 3.1.1 - CUP B51E22000150006) to ED.References
[1] Alahmadi AAS, Samson RS, Gasston D, et al. Complex motor task associated with non-linear BOLD responses in cerebro-cortical areas and cerebellum. Brain Struct Funct. 2016;221(5):2443-2458. doi:10.1007/s00429-015-1048-1
[2] Casiraghi L, Alahmadi AAS, Monteverdi A, et al. I see your effort: Force-Related BOLD effects in an extended action execution-observation network involving the cerebellum. Cereb Cortex. 2019;29(3):1351-1368. doi:10.1093/cercor/bhy322
[3] Friston KJ, Harrison L, Penny W. Dynamic causal modelling. Neuroimage. 2003;19(4):1273-1302. doi:10.1016/S1053-8119(03)00202-7
[4] Stephan KE, Penny WD, Daunizeau J, Moran RJ, Friston KJ. Bayesian model selection for group studies. Neuroimage. 2009;46(4):1004-1017. doi:10.1016/j.neuroimage.2009.03.025
[5] Asemi A, Ramaseshan K, Burgess A, Diwadkar VA, Bressler SL. Dorsal anterior cingulate cortex modulates supplementary motor area in coordinated unimanual motor behavior. Front Hum Neurosci. 2015;9:309. doi:10.3389/fnhum.2015.00309
[6] Grefkes C, Eickhoff SB, Nowak DA, Dafotakis M, Fink GR. Dynamic intra- and interhemispheric interactions during unilateral and bilateral hand movements assessed with fMRI and DCM. Neuroimage. 2008;41(4):1382-1394. doi:10.1016/j.neuroimage.2008.03.048
[7] Keisker B, Hepp-Reymond MC, Blickenstorfer A, Meyer M, Kollias SS. Differential force scaling of fine-graded power grip force in the sensorimotor network. Hum Brain Mapp. 2009;30(8):2453-2465. doi:10.1002/hbm.20676
[8] Macar F, Coull J, Vidal F. The supplementary motor area in motor and perceptual time processing: fMRI studies. Cogn Process. 2006;7(2):89-94. doi:10.1007/s10339-005-0025-7
[9] Buckner RL, Krienen FM, Castellanos A, Diaz JC, Thomas Yeo BT. The organization of the human cerebellum estimated by intrinsic functional connectivity. J Neurophysiol. 2011;106(5):2322-2345. doi:10.1152/jn.00339.2011
[10] Yu C, Liu Y, Li J, et al. Altered functional connectivity of primary visual cortex in early blindness. Hum Brain Mapp. 2008;29(5):533-543. doi:10.1002/hbm.20420
[11] Gilson M, Zamora-López G, Pallarés V, et al. Model-based whole-brain effective connectivity to study distributed cognition in health and disease. Netw Neurosci. 2019;4(2):338-373. doi:10.1162/netn_a_00117
[12] Deco G, Tononi G, Boly M, Kringelbach ML. Rethinking segregation and integration: contributions of whole-brain modelling. Nat Rev Neurosci. 2015;16(7):430-439. doi:10.1038/nrn3963
[13] Gagliano G, Monteverdi A, Casali S, et al. Non-Linear Frequency Dependence of Neurovascular Coupling in the Cerebellar Cortex Implies Vasodilation–Vasoconstriction Competition. Cells. 2022;11(6). doi:10.3390/cells11061047
[14] D’Angelo E, Casali S. Seeking a unified framework for cerebellar function and dysfunction: from circuit operations to cognition. Front Neural Circuits. 2012;6:116. doi:10.3389/fncir.2012.00116
[15] to M. Error detection and representation in the olivo-cerebellar system. Front Neural Circuits. 2013;7(JAN):1-8. doi:10.3389/fncir.2013.00001
[16] Zeidman P, Jafarian A, Corbin N, et al. A guide to group effective connectivity analysis, part 1: First level analysis with DCM for fMRI. Neuroimage. 2019;200(June):174-190. doi:10.1016/j.neuroimage.2019.06.031
Figures
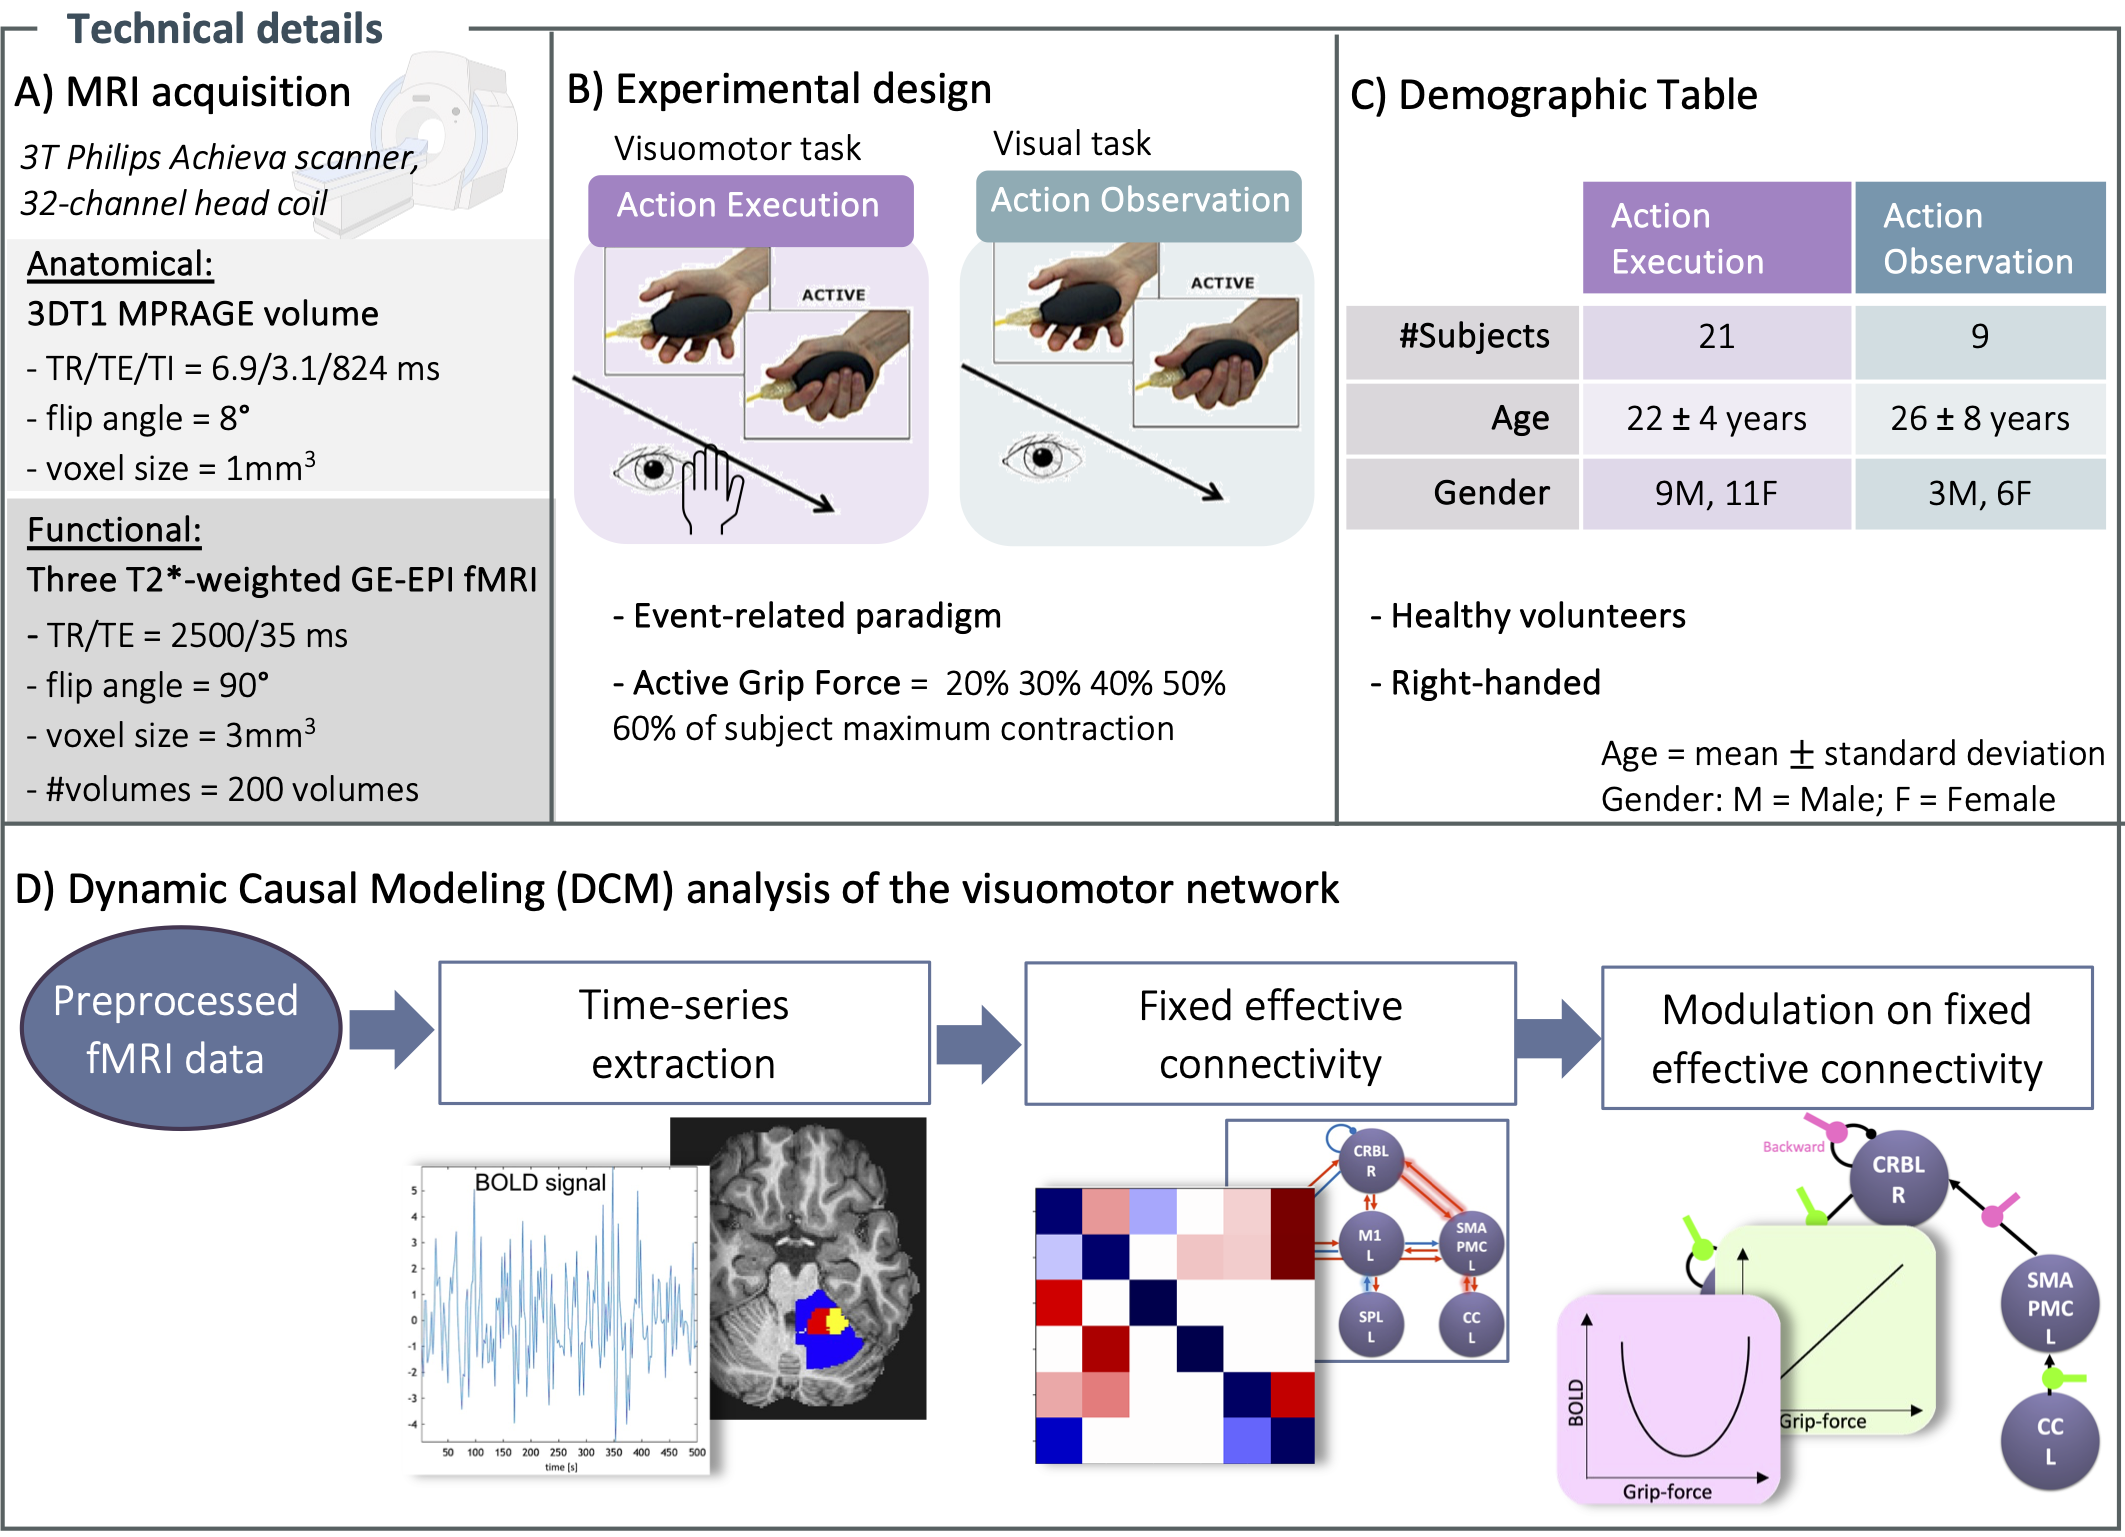
Figure 1) A) Acquisition. B) fMRI protocol. The paradigm for Action Execution consisted in squeezing a ball using the right hand, with different level of grip-force controlled by a visual cue. Action Observation consisted in watching a video of an actor performing the same task. C) Demographics details. D) DCM analysis. Definition of a visuomotor network and time series extraction of the activated regions. Investigation of fixed effective connectivity and modulation on it as linear/nonlinear transformations of BOLD-Grip Force performed by regions embedded in visuomotor network.
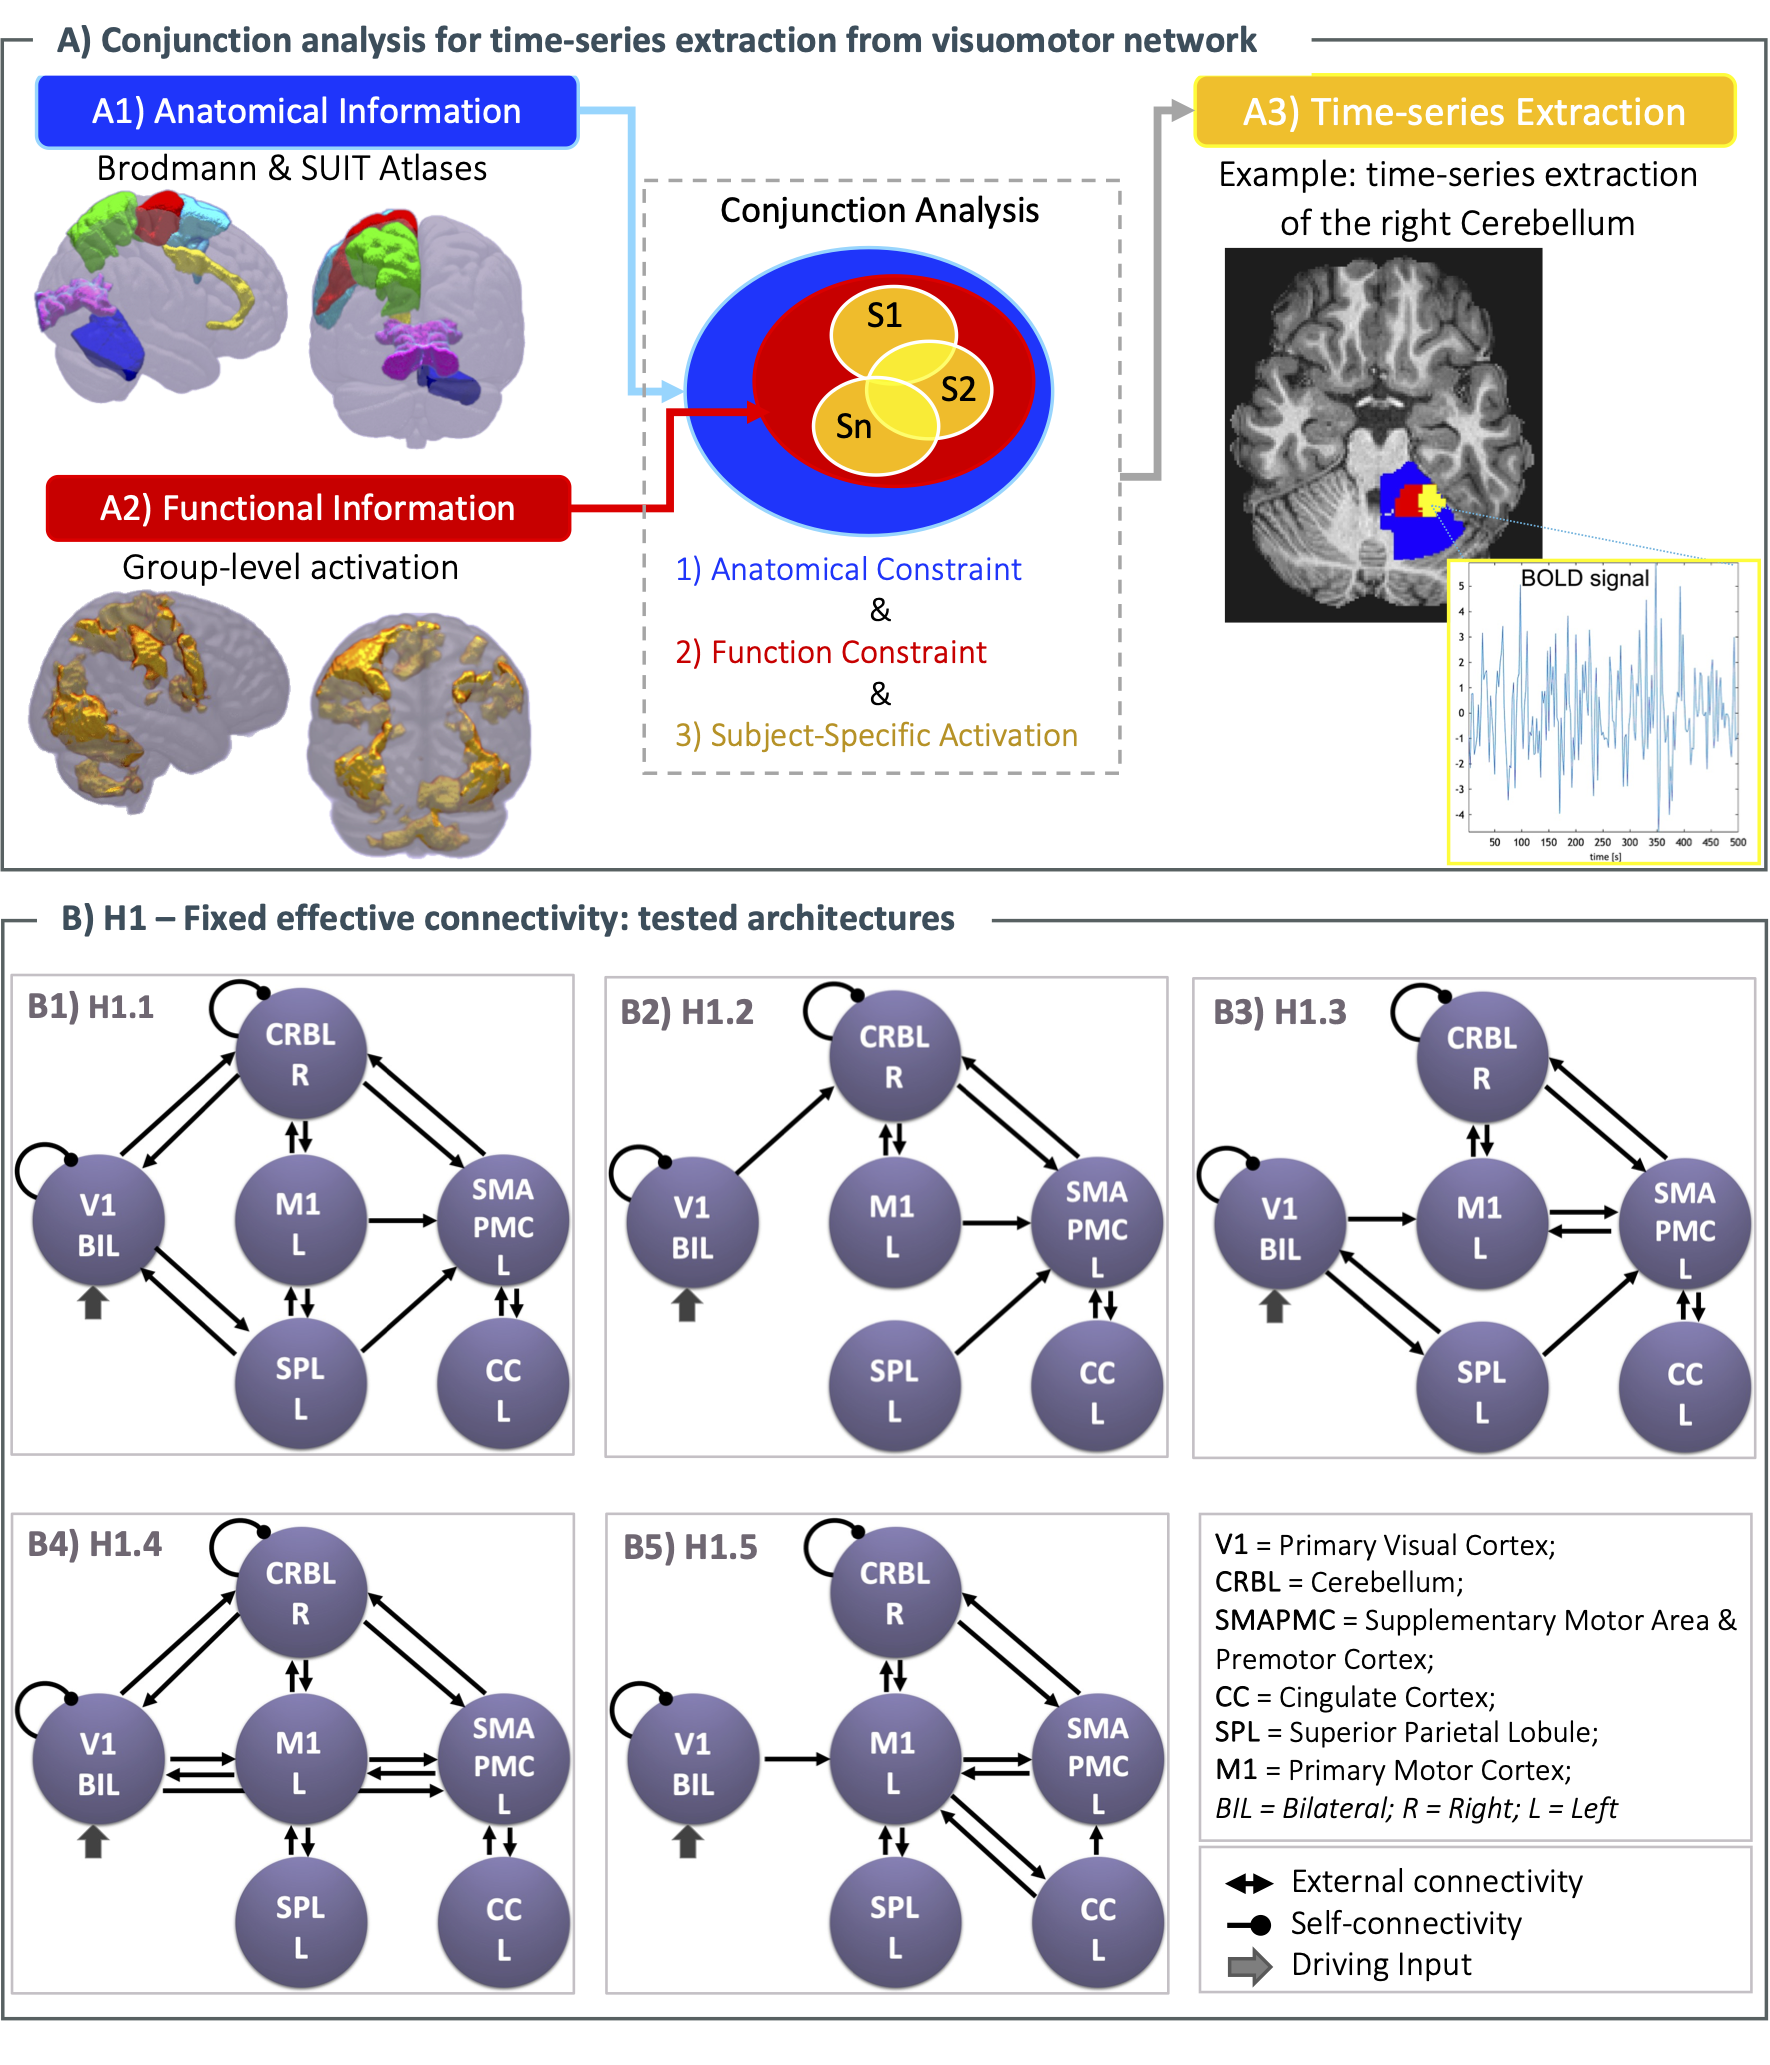
Figure 2. A) Conjunction analysis. For each region, subject specific activation is bounded by anatomical and functional constraints B) H1 - Tested fixed effective connectivity architectures. The same architectures, driven by V1, are tested for Action Execution (AE) and Action Observation (AO) separately (B1-B5). Directional external connections model different architectures of network causal relationships, while self-connections model region intrinsic activity. Bayesian model inversion estimates execution and observation effective connection strength.
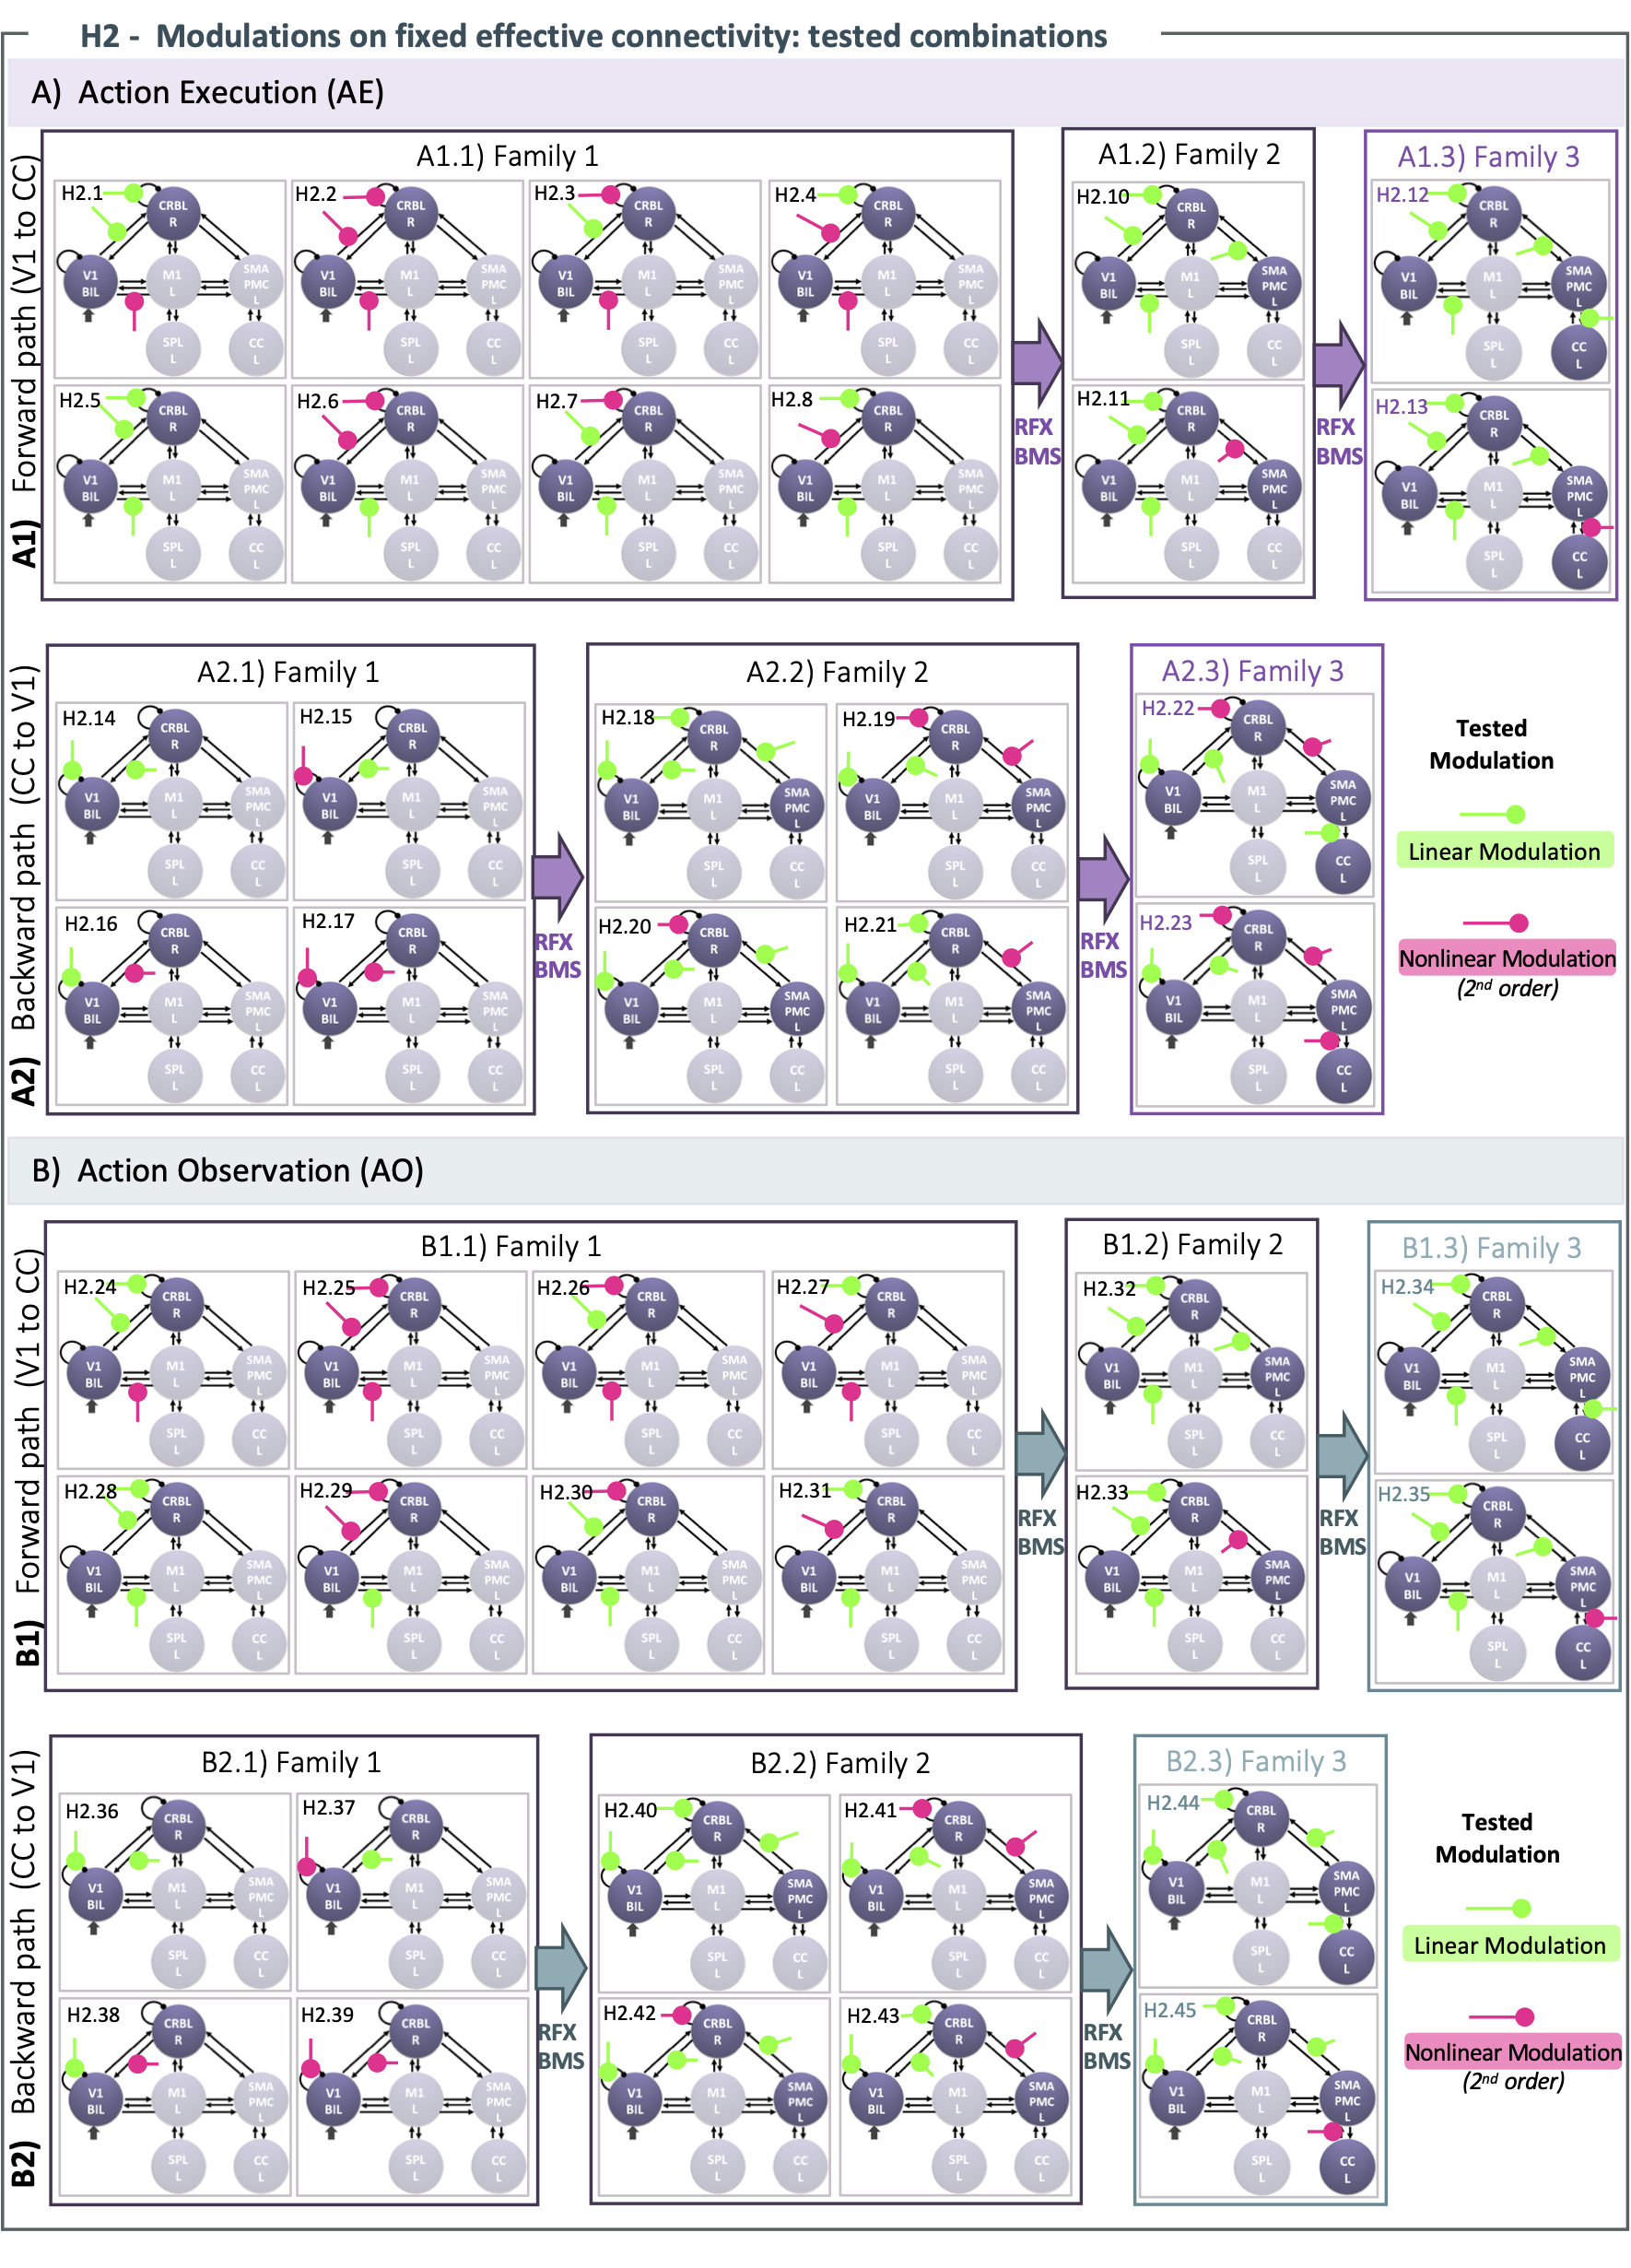
Figure 3) H2 – Tested modulations. Linear/nonlinear modulations are tested on Action Execution (AE - A) and Action Observation (AO - B) cortico-cerebellar connections (V1-CRBL-SMAPMC-CC). Configurations are tested in forward (from V1) and backward (to V1) path. Different modulations of the same connection are grouped: the output of simpler configuration (Family i) is the input for more complex one (Family i+1). Random Effects-Bayesian Model Selection (RFX-BMS) estimates the winning model at each stage: the last one is the overall winning model for AE/AO forward and backward paths
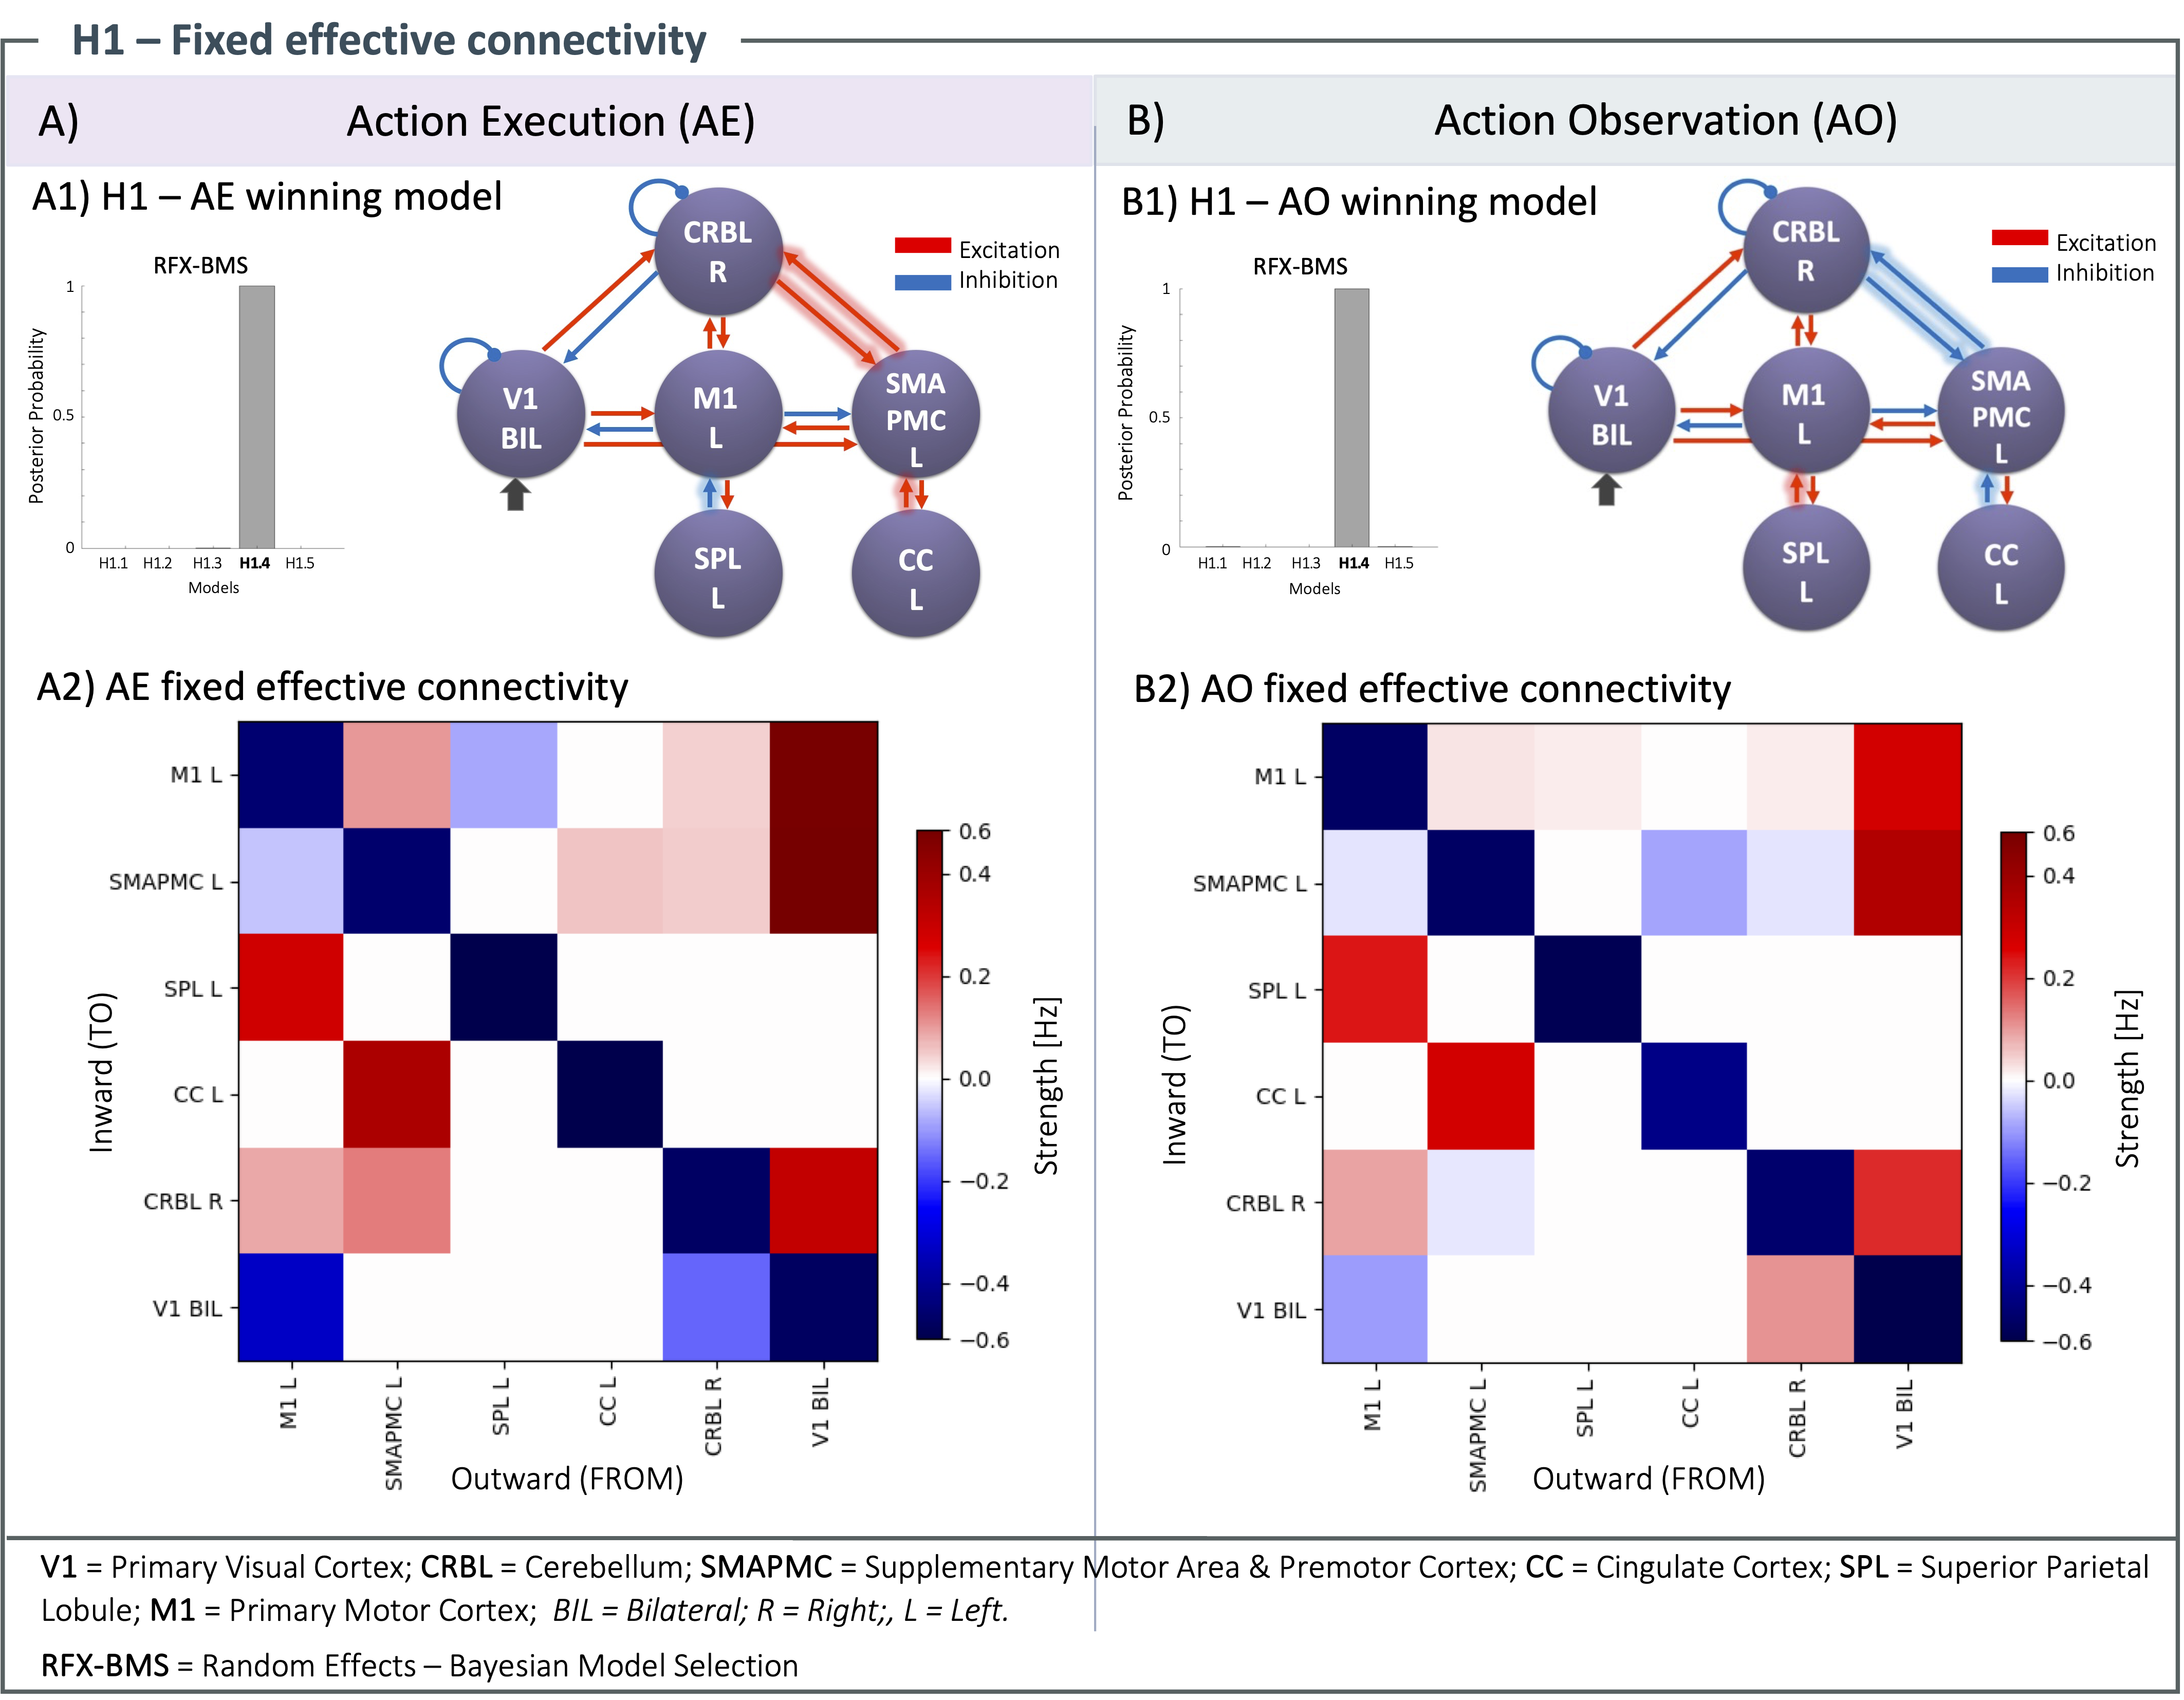
Figure 4) H1 – Fixed effective connectivity results for action execution (AE - A) and observation (AO - B). (A1, B1) Random Effects Bayesian Model Selection (RFX-BMS) identifies Model H1.4 as winning model (posterior probability > 90%). Differences between AE and AO connections are indicated with shadows on the arrows. (A2, B2) Red refers to excitation (positive values), blue to inhibition (negative values). Self-connectivity (diagonal), inhibitory by definition17, shows a notable activity of all regions in AE and AO, while external connectivity is stronger in AE.
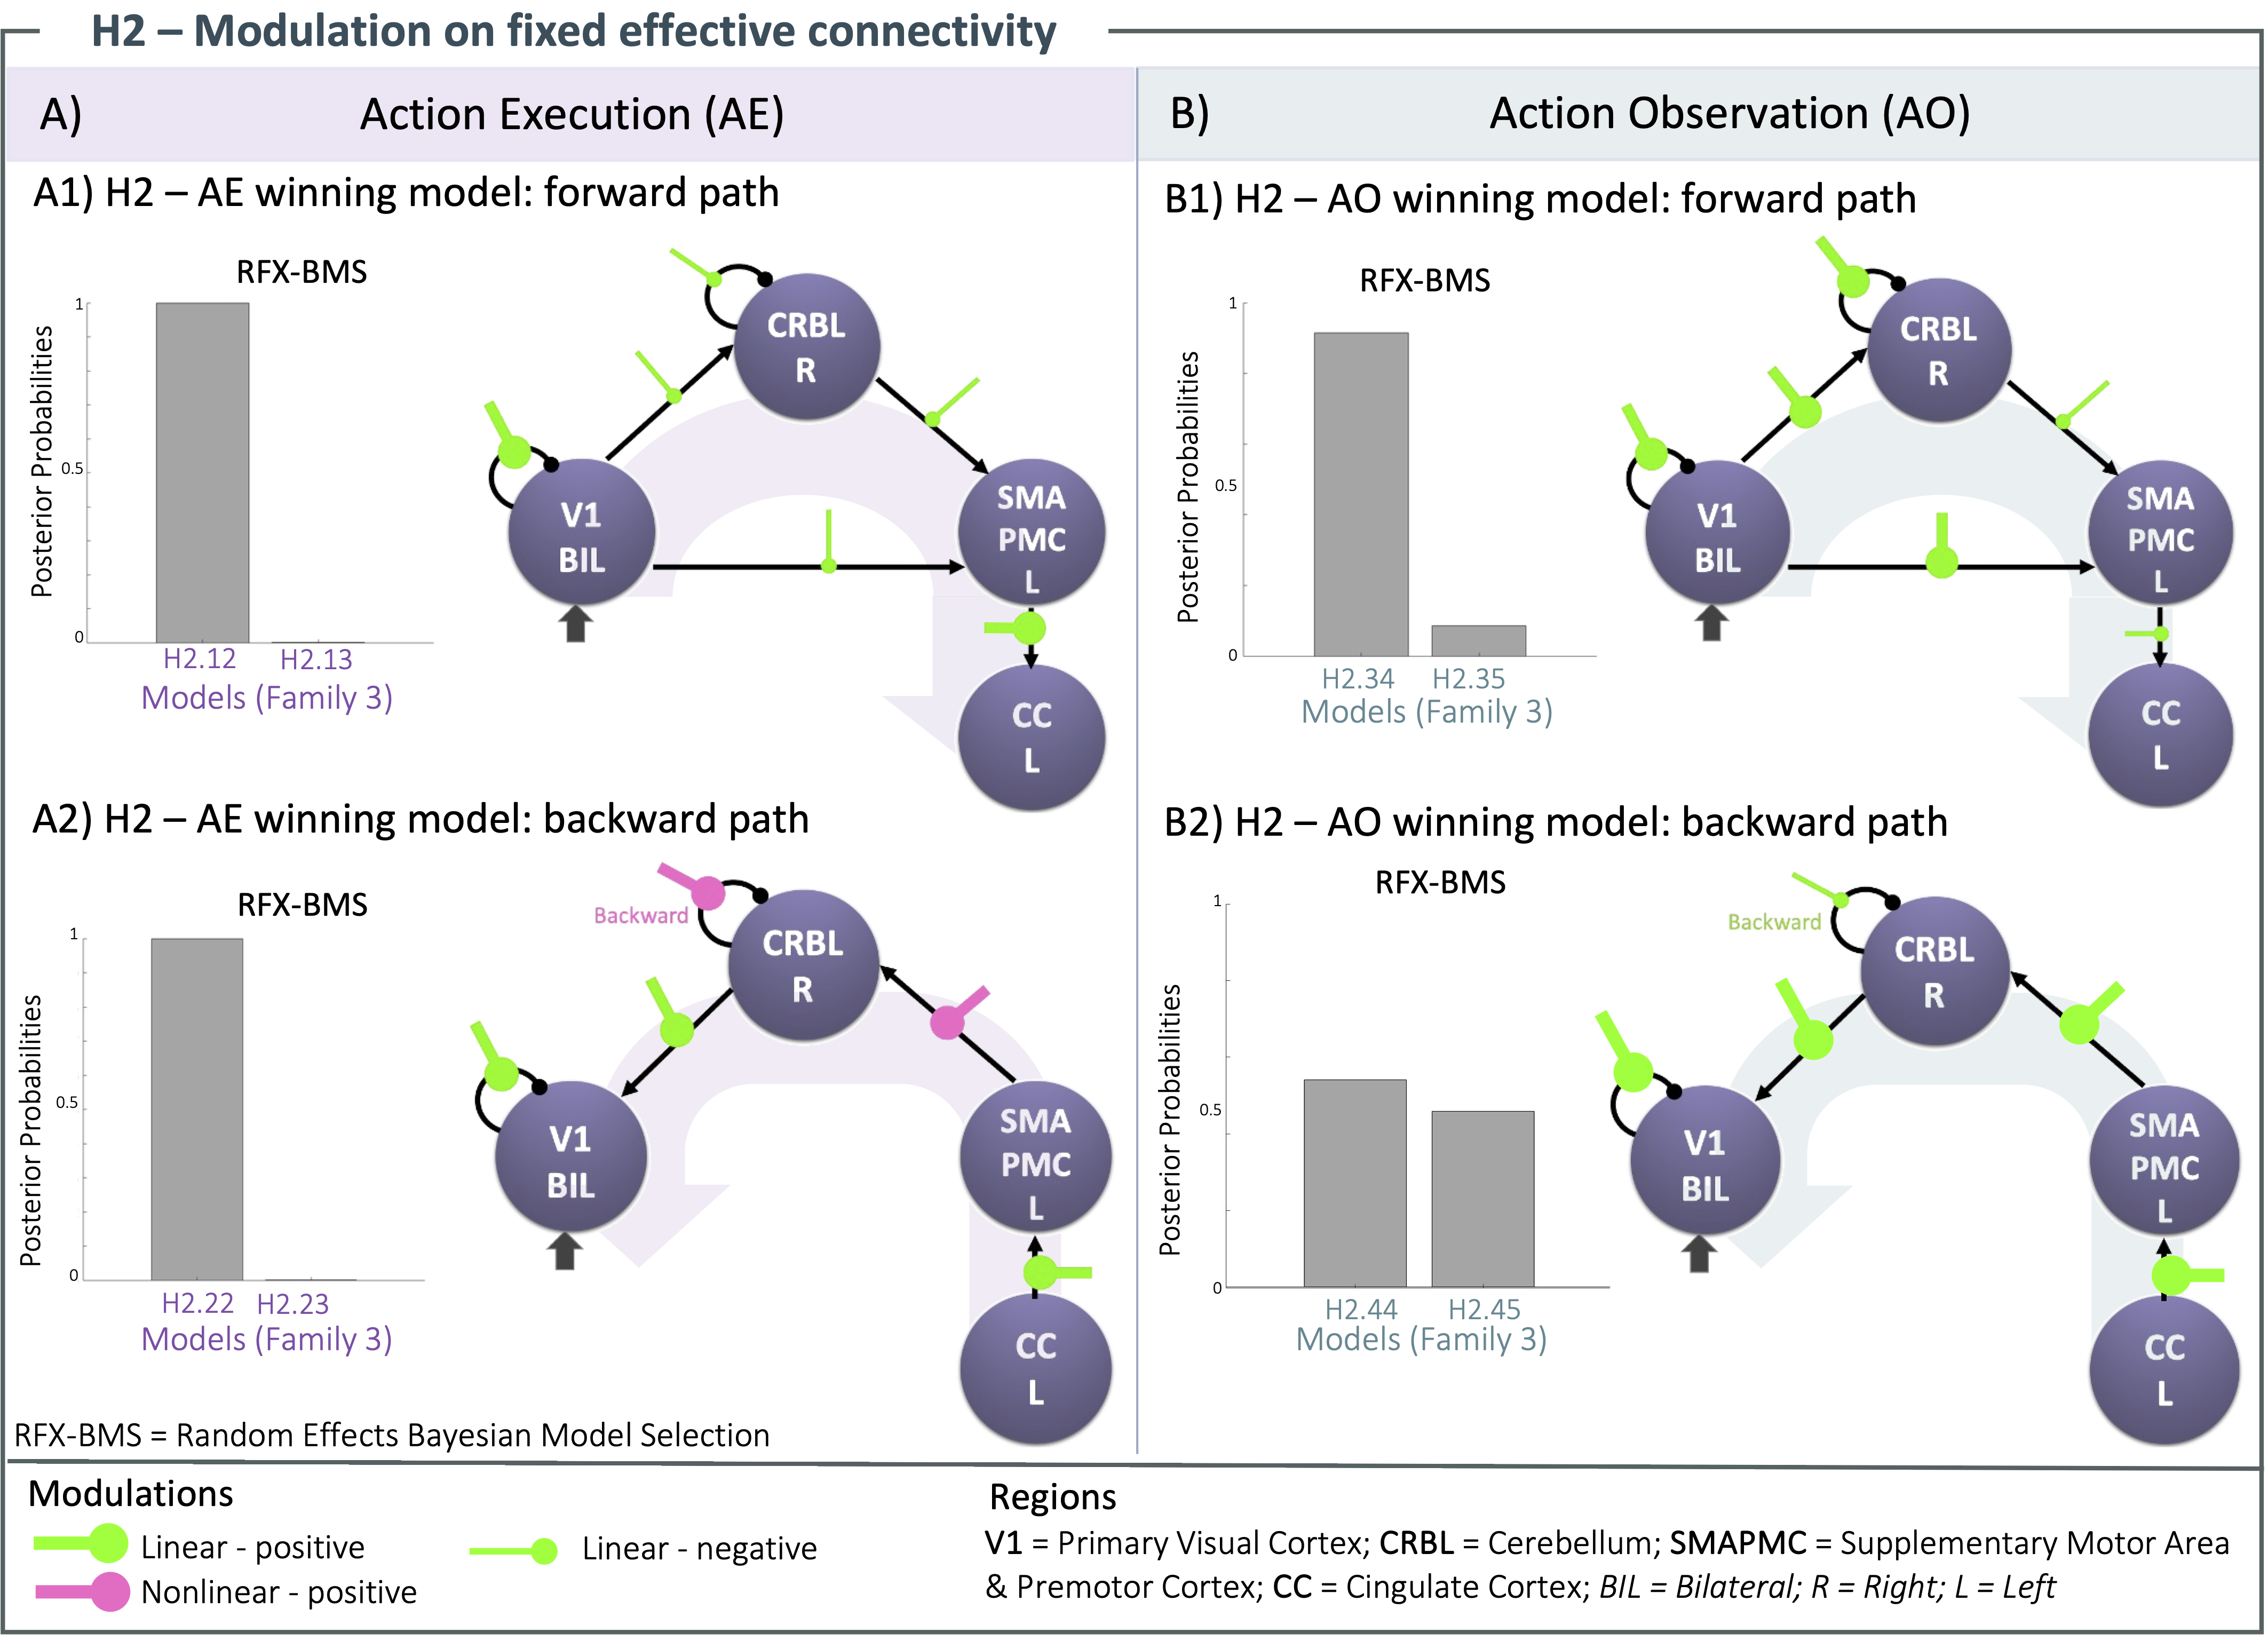
Figure 5) Modulations outcomes for action execution (AE - A) and observation (AO - B). Random Effects - Bayesian Model Selection (RFX-BMS) identifies winning models for forward (1) and backward (2) paths. Modulations of BOLD-GF relation increase (bold) or decrease (thin) the effective connectivity. Nonlinear increments are identified in AE backward path (A2), while all the other paths reveal a combination of only linear increments and decrements of the effective connectivity.