0328
Resting-state functional connectivity with diffusion fMRI minimizes anti-correlations and captures white matter connectivity at 3T and 7T1Université de Lausanne, Lausanne, Switzerland, 2Lausanne University Hospital (CHUV), Lausanne, Switzerland, 3Ecole Polytechnique Fédérale de Lausanne (EPFL), Lausanne, Switzerland
Synopsis
Keywords: Functional Connectivity, fMRI (resting state), novel contrast mechanisms, non-BOLD fMRI, diffusion fMRI, resting-state connectivity
Motivation: Unlike BOLD (neurovascular contrast), dfMRI offers neuromorphological contrast that can detect white matter (WM) activity and attenuates anti-correlations in functional connectivity (FC) analysis.
Goal(s): This work investigated resting-state gray and white matter connectivity and anti-correlations in BOLD and dfMRI, at 3T and 7T.
Approach: FC matrices and graph metrics were computed.
Results: Positive correlations were consistent among the contrasts whereas anti-correlations were attenuated with reduced hemodynamic contributions, suggesting a vascular origin to the latter. DfMRI FC displayed higher clustering than BOLD in WM. DfMRI provides unique insights into brain connectivity, particularly in WM, suggesting its value in enhancing our understanding of brain function.
Impact: In functional connectivity analysis, diffusion fMRI exhibits comparable positive correlations to BOLD but reduces anti-correlations, indicating a potential vascular origin for the latter. Additionally, it uncovers previously overlooked white matter connectivity, traditionally treated as a nuisance variable.
Introduction
Resting-state functional MRI (rsfMRI) examines the brain activity at rest1. Historically based on Blood Oxygenation-Level-Dependent (BOLD) signal, rsfMRI has recently been characterized using diffusion fMRI (dfMRI)2. The latter differs from BOLD by focusing on neuromorphological coupling (transient cell deformation), that the apparent diffusion coefficient (ADC) is sensitive to, instead of neurovascular coupling. As it arises from neuronal activity rather than neighboring veins or capillaries3, it could enable to distinguish vascular from neuronal signal contribution. Furthermore, dfMRI could bring additional information on white matter (WM) activity and shed light on the origins of functional connectivity (FC) anti-correlations. Due to less vasculature and metabolic activity, BOLD exhibits low sensitivity in WM and has often been treated as a nuisance regressor in spite of recent efforts to investigate WM BOLD4. As for anti-correlations, some networks are known to negatively correlate with each other in BOLD rsfMRI (e.g. default mode vs dorsal attention system5). These anti-correlations are thought to be caused by either neuronal inhibition inducing negative BOLD or purely vascular effects5-7. We examine the specific signatures of rs dfMRI and BOLD in terms of WM sensitivity and anti-correlations at 3T and 7T.Methods
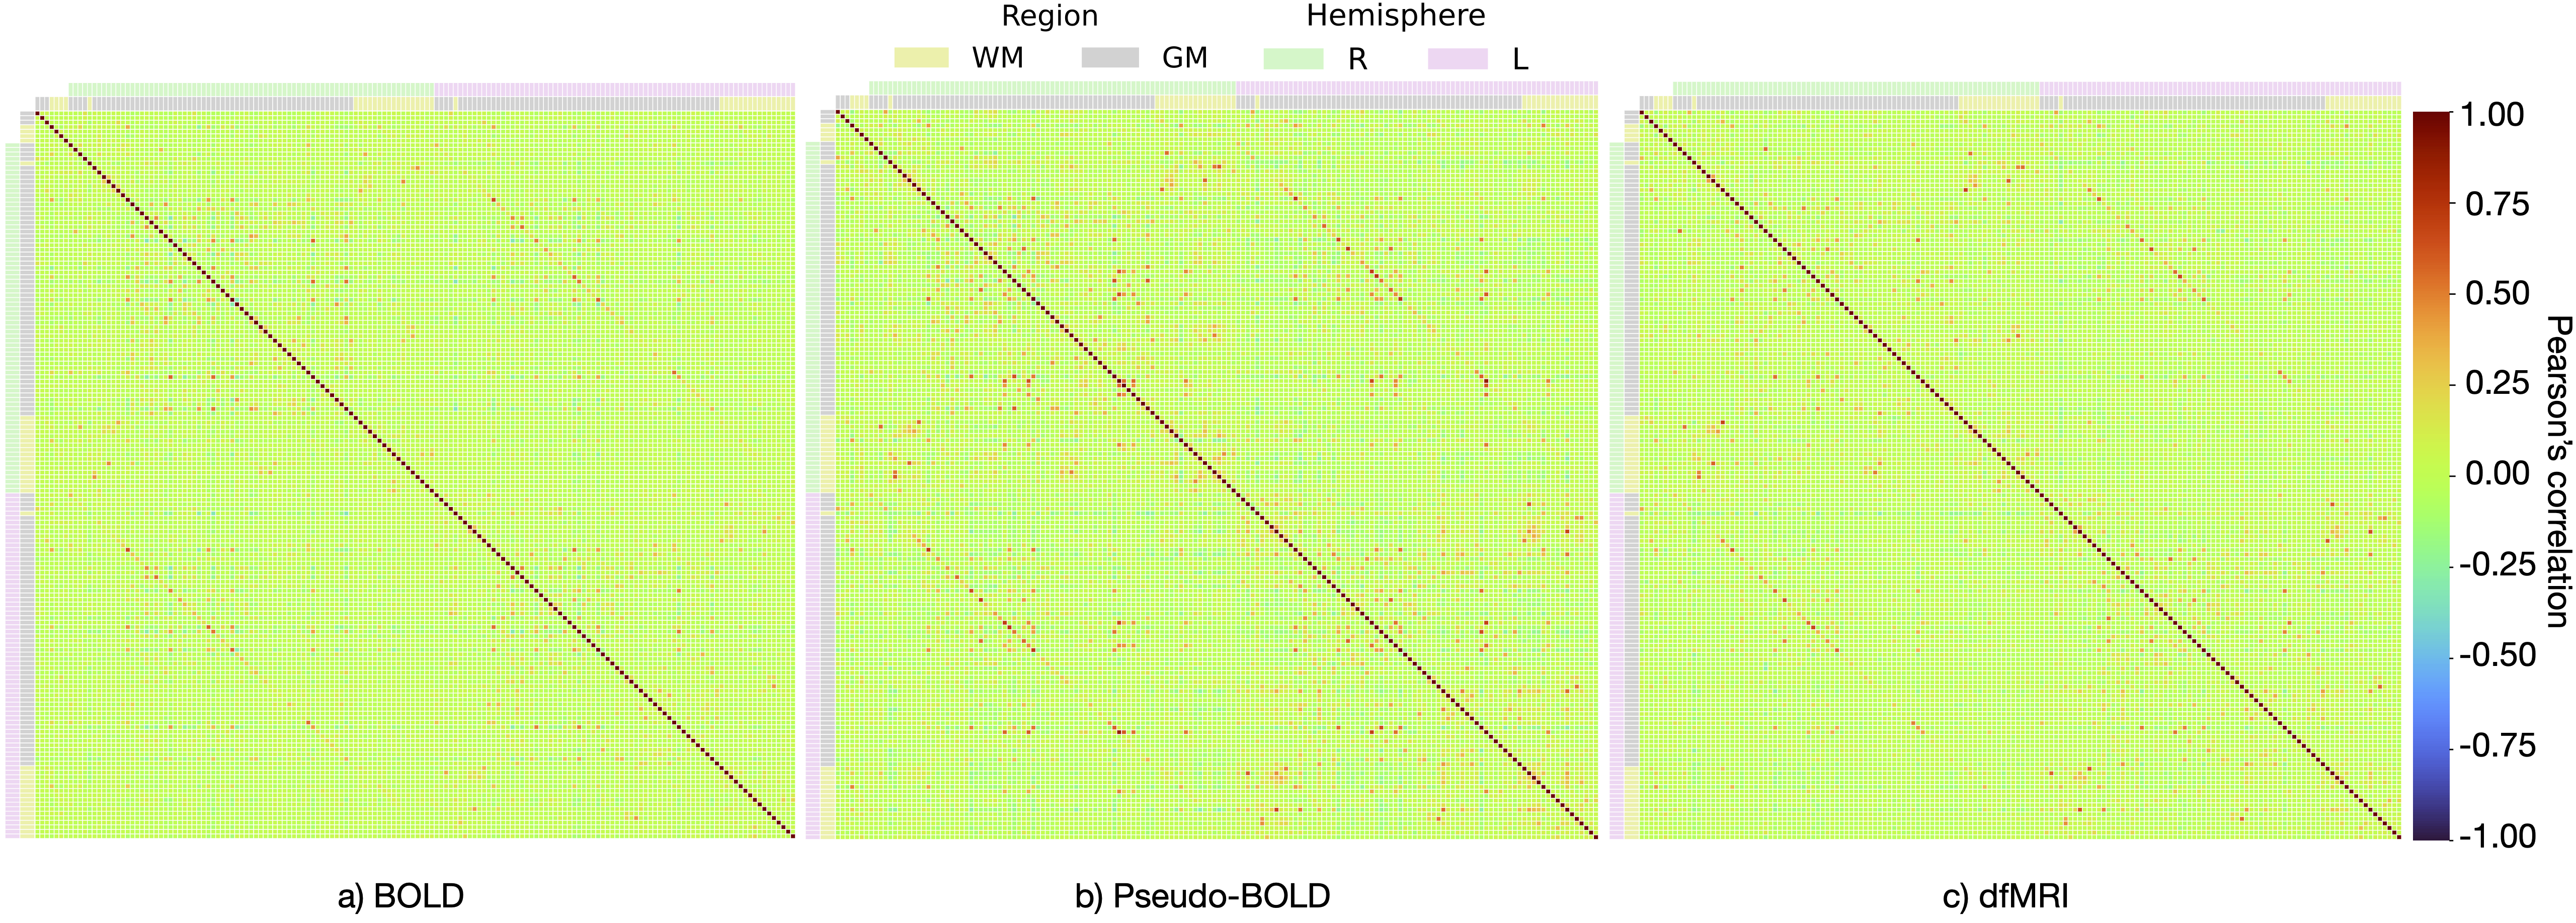
Data were collected on clinical Siemens Prisma 3T (n=11) and Magnetom 7T (n=10) MRI systems. Two modalities were used: (1) SE-EPI yielding T2-BOLD contrast with 1s temporal resolution, (2) DW-TRSE-EPI with pairs of b-values 0.2 and 1 ms/μm2, yielding ADC timecourses (dfMRI) and T2w/low-b contrast timecourses based on the b=0.2ms/μm2 data only (Pseudo-BOLD) with 2s resolution. Sequence parameters were: TE=62ms(7T)/72ms(3T), TR=1035ms, 2.5-mm isotropic resolution, matrix size 94x94, 16 slices, GRAPPA x2, MB2, 600 volumes per run. Following established pre-processing2, FC matrices were calculated (Fig.1) using ROIs of GM (Neuromorphometrics -NMM-) and WM (Johns Hopkins University -JHU-) atlases, and partial pairwise correlation, regressing out the global signal, the ventricles and the cerebrospinal fluid (CSF). FDR-corrected Wilcoxon signed-rank tests were employed to determine significant Fisher-transformed correlations of the BOLD FC. FC in these significant edges was compared between the three techniques within different WM + GM edges, using Mann-Whitney U tests with Bonferroni correction. Graph analysis was then conducted on the significant correlations (FDR-corrected Wilcoxon signed-rank tests) for BOLD and dfMRI and the average clustering coefficient8 was calculated.Results
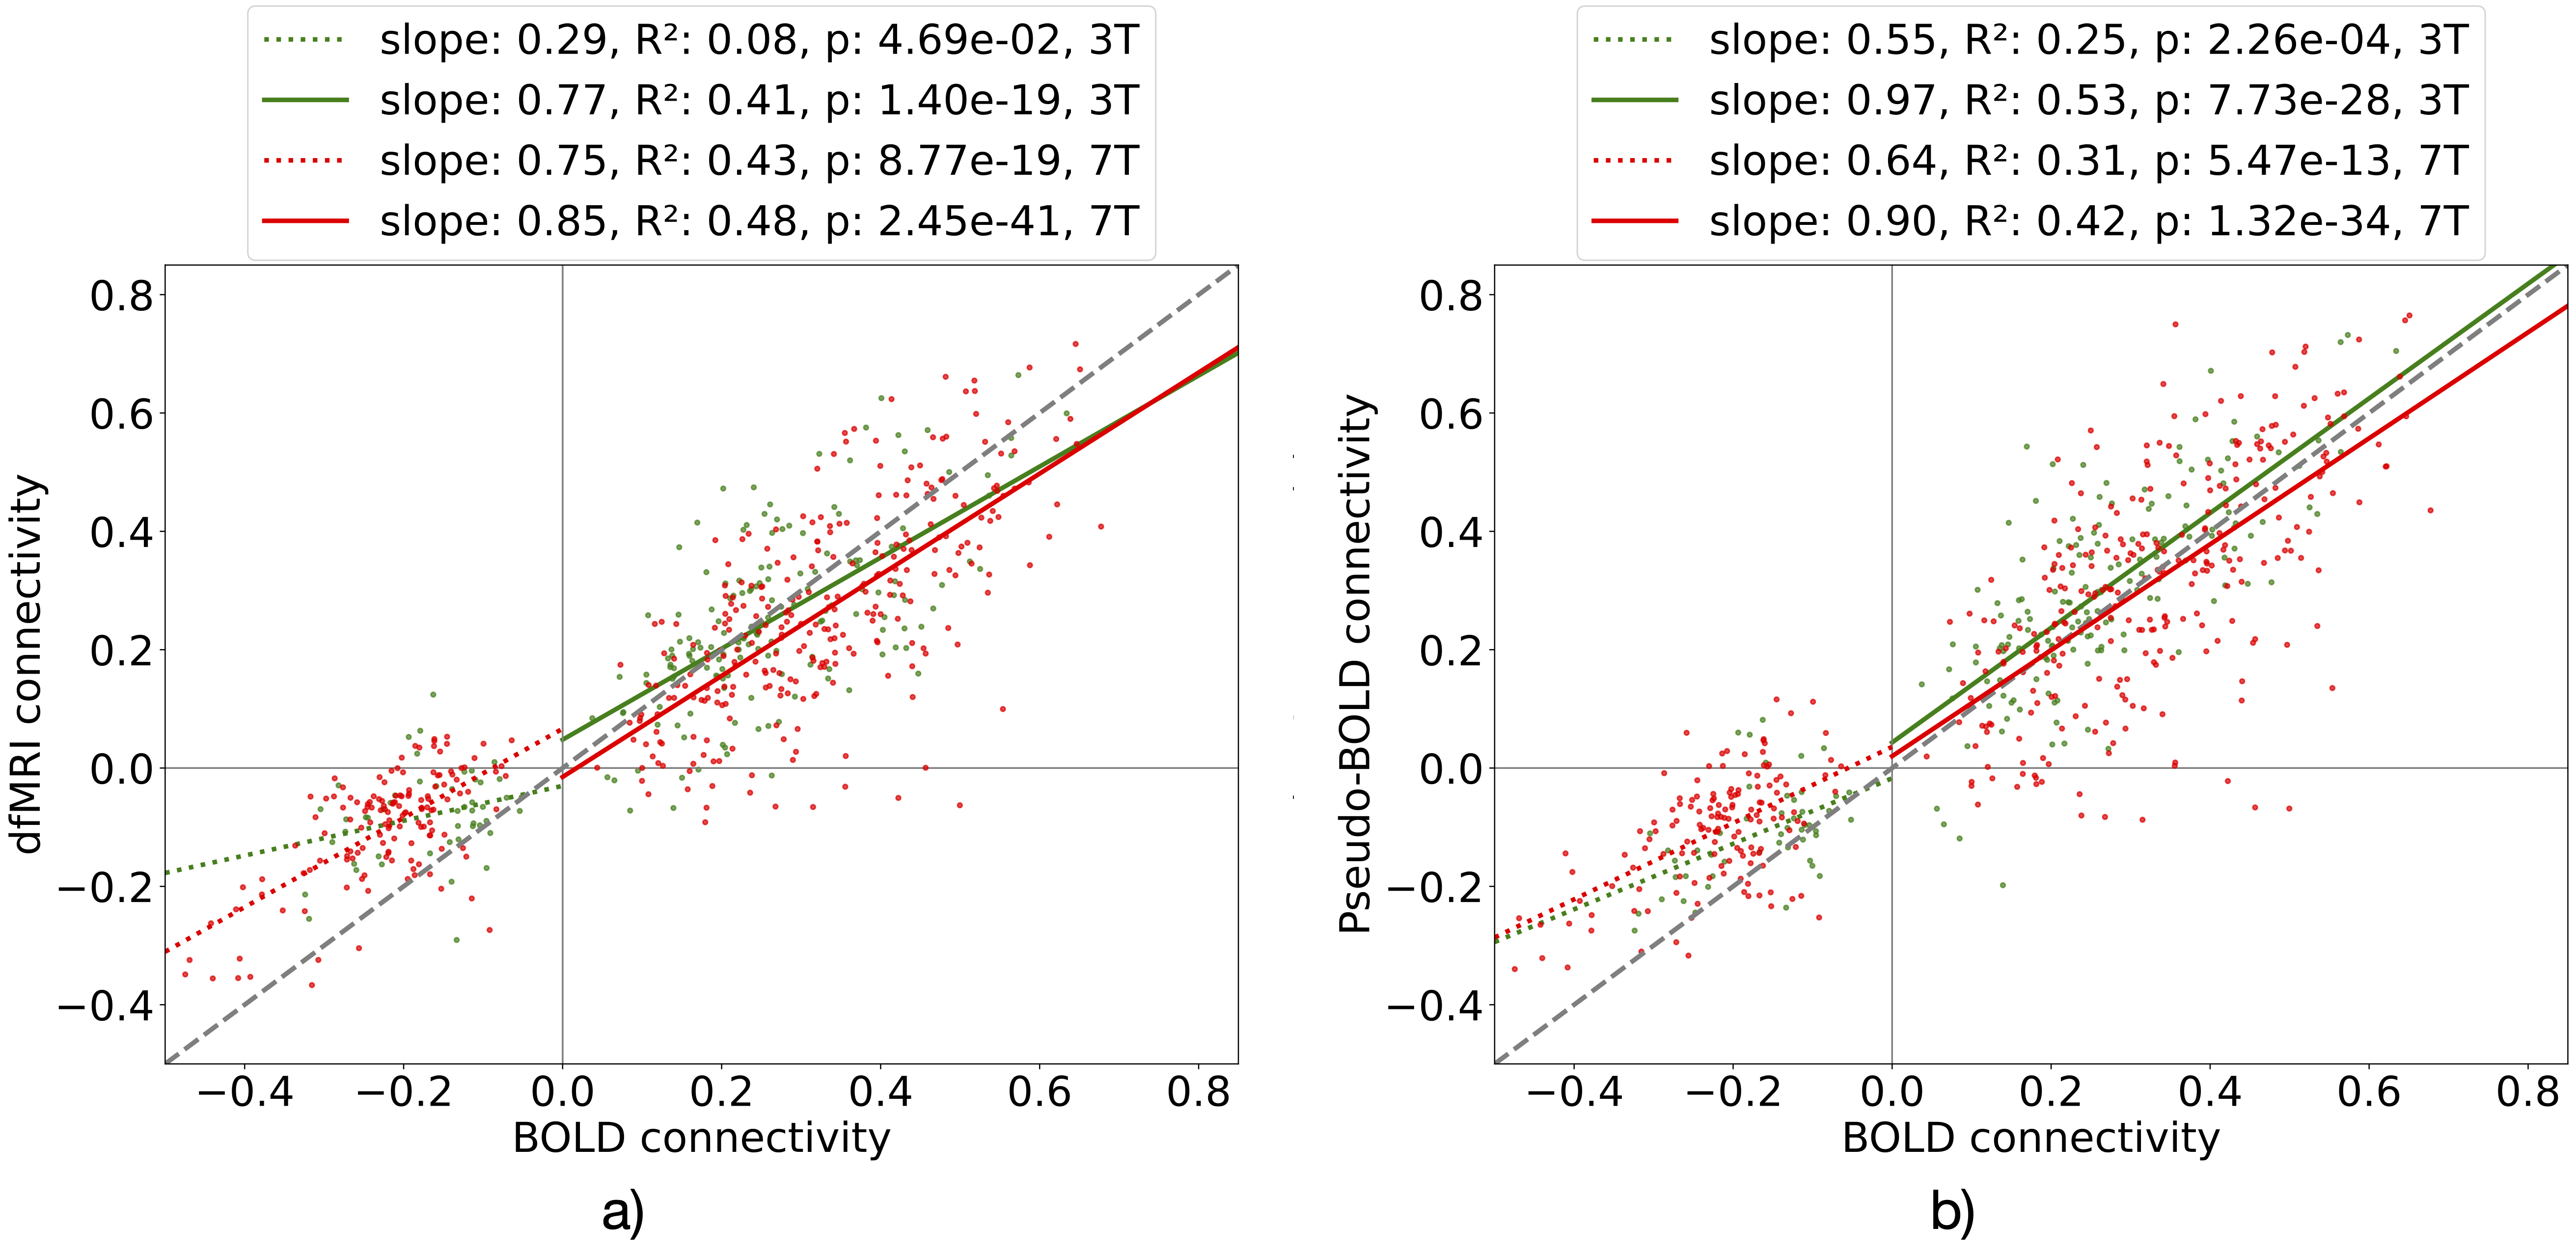
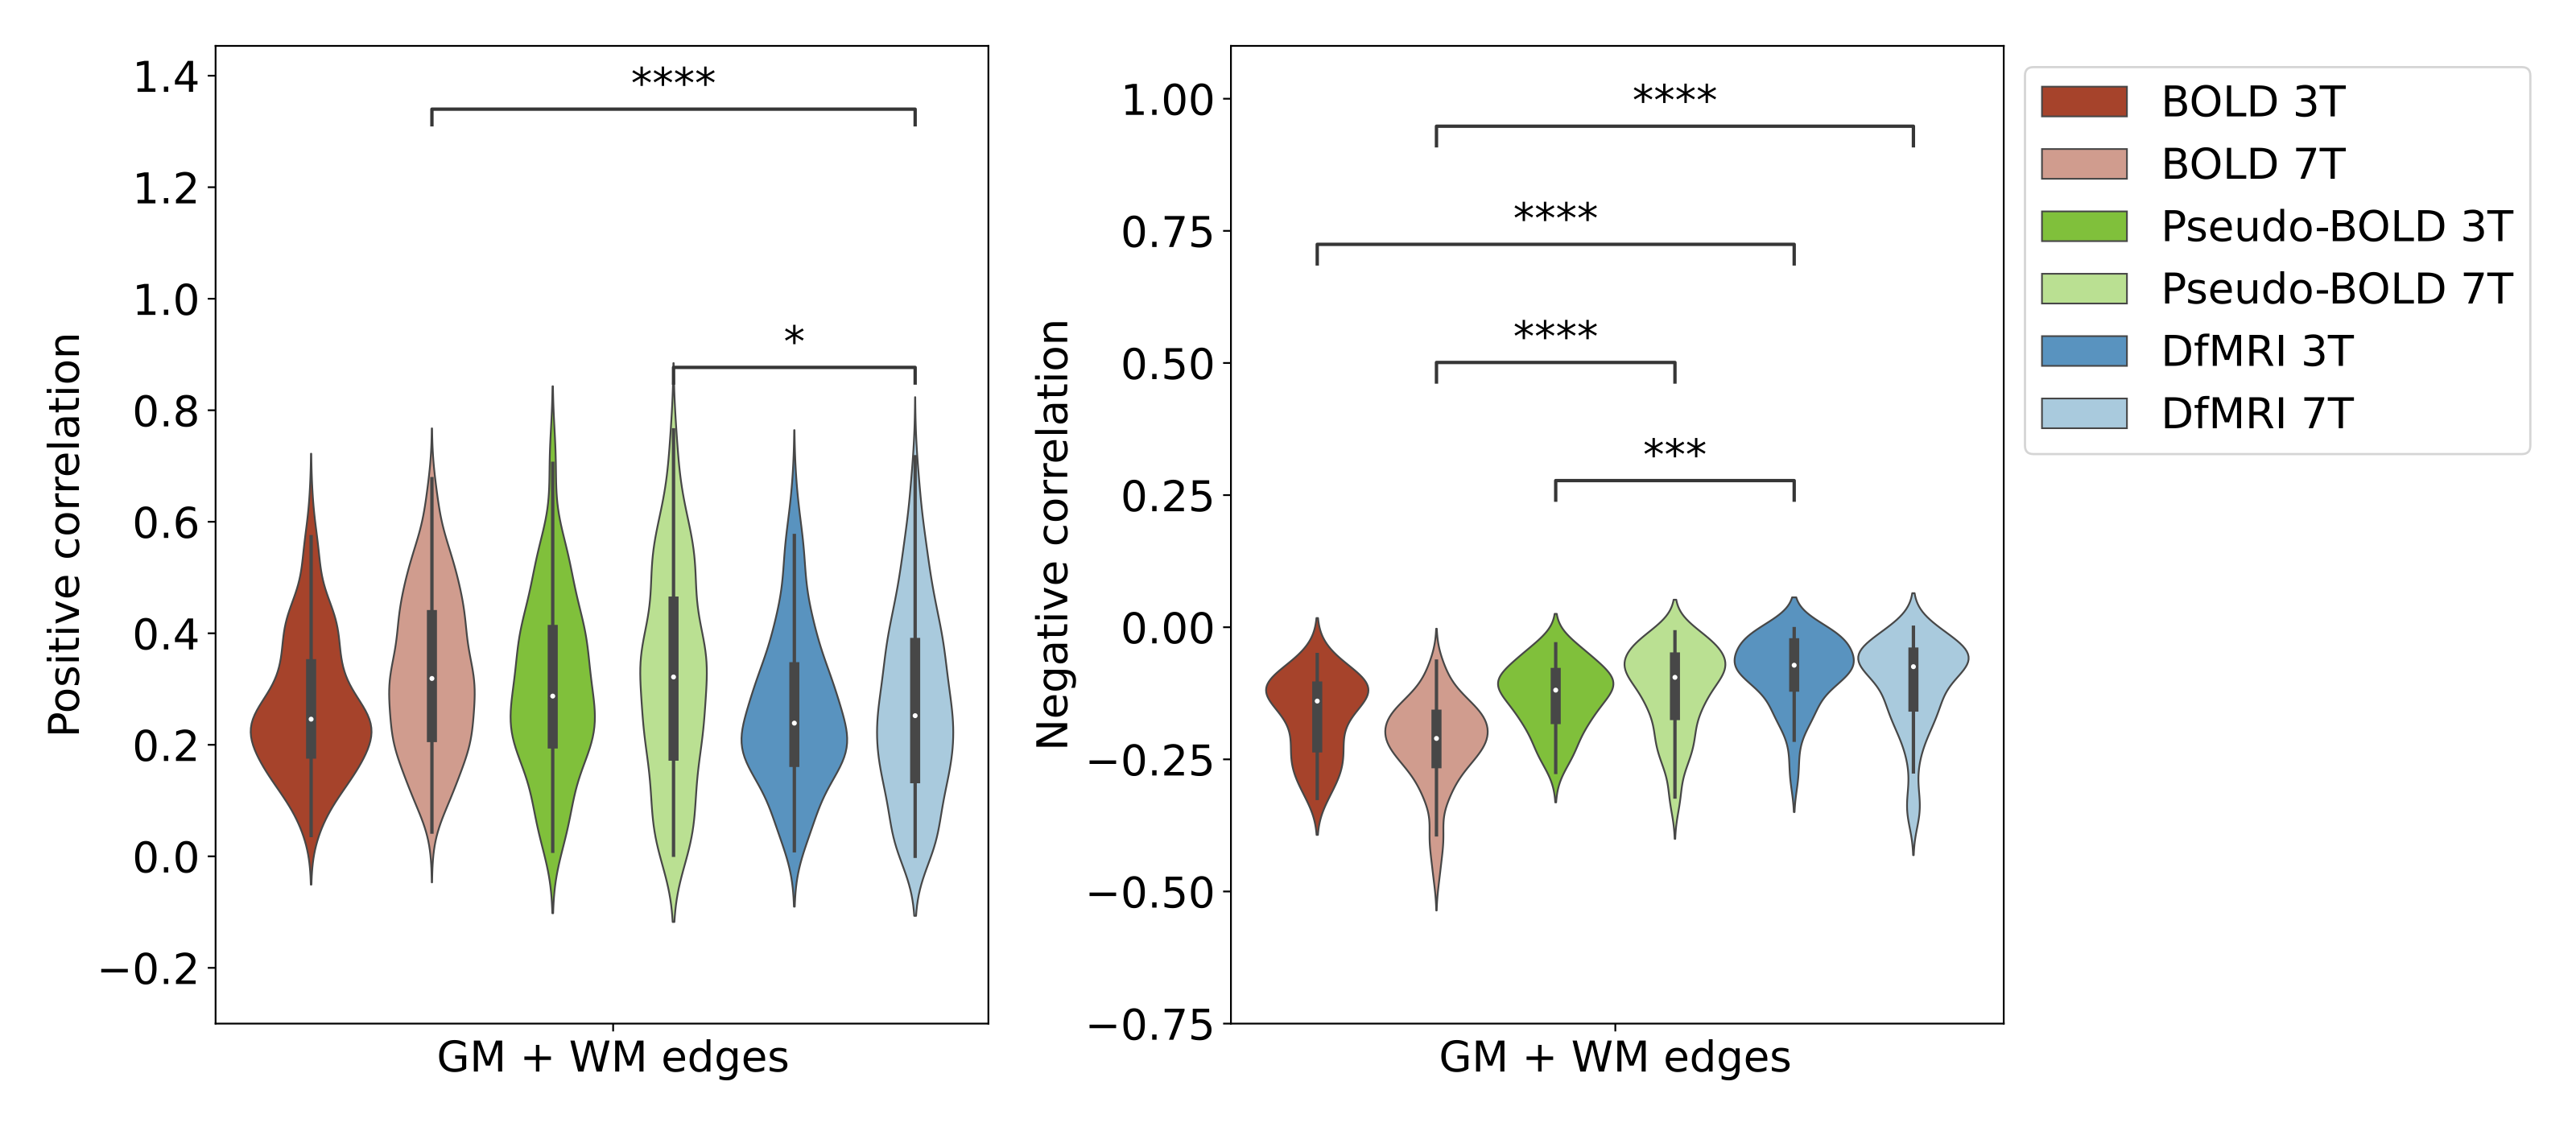
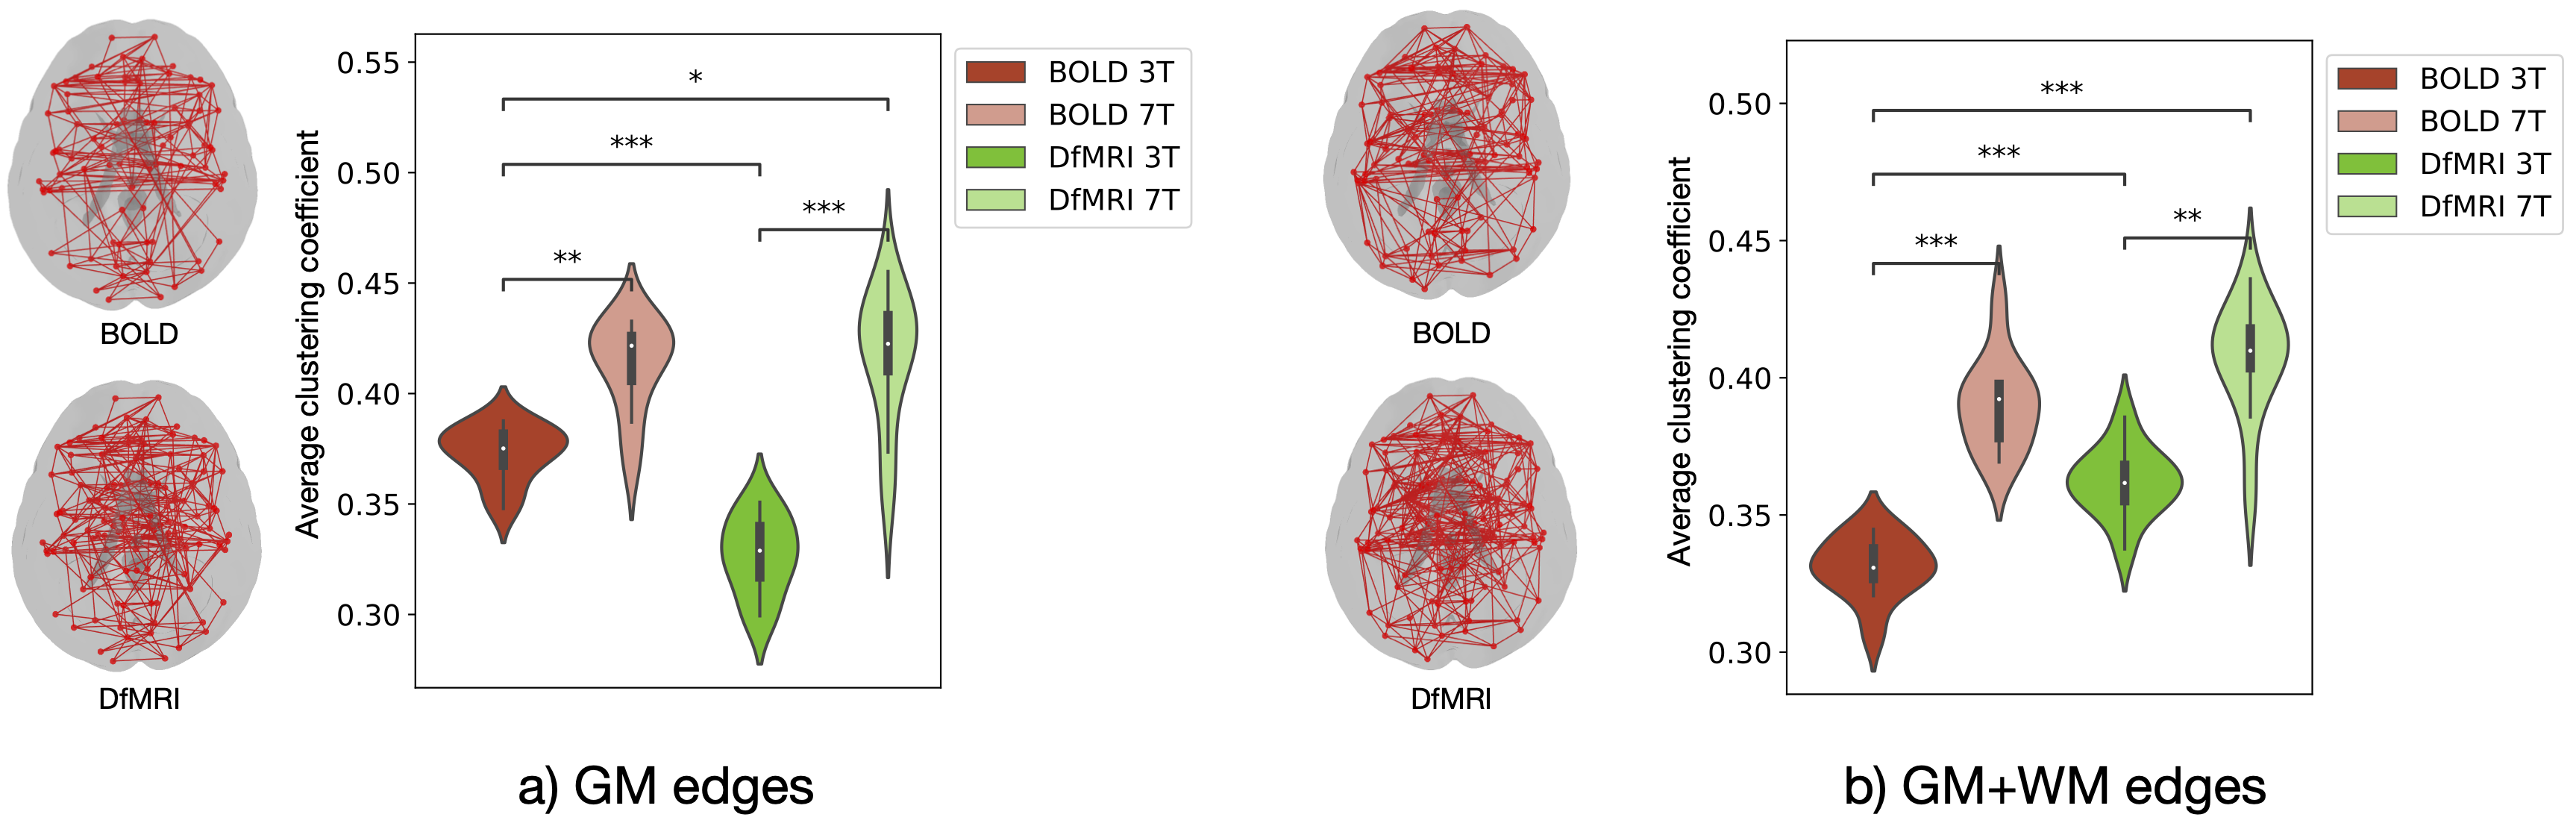
As previously reported2, positive correlations revealed excellent agreement between BOLD, Pseudo-BOLD and dfMRI, while anti-correlations were heavily suppressed in dfMRI only (Fig.2). At 3T, no significant differences in positive connectivity strength appear (Fig.3). However at 7T, dfMRI exhibits significantly smaller connectivity strength than BOLD and Pseudo-BOLD. Regarding the anti-correlations at 3T, they were systematically attenuated with decreasing vascular contribution to the functional contrast (Fig. 3, BOLD < Pseudo-BOLD < dfMRI < 0). At 7T, the differences between Pseudo-BOLD and dfMRI are not significant anymore (BOLD < Pseudo-BOLD ~ dfMRI < 0). The connectivity graph based on BOLD had a larger average clustering coefficient than that based on dfMRI when including only GM ROIs (Fig. 4a). For graphs based on GM and WM ROIs, the average clustering coefficient became stronger with dfMRI vs BOLD (Fig. 4b).Discussion
The agreement of FC positive correlations (Fig. 2) suggests that ROIs have congruent activation among the three contrasts, further supported by their similar positive connectivity strength at 3T (Fig.3). At 7T, dfMRI positive connectivity strength is smaller than in BOLD and Pseudo-BOLD, due to its intrinsic independence on the field strength. Remarkably, the three functional contrasts induce different anti-correlations. The increasing amplitude of anti-correlations with reduced hemodynamic contributions (BOLD < Pseudo-BOLD < dfMRI < 0) at 3T supports a vascular origin underlying anti-correlations which is largely absent in dfMRI. Neuronal inhibition may also drive negative BOLD via vasoconstriction7. As opposed to membrane depolarization that induces significant cell swelling to be detected as ADC drop, cell shrinkage is small during hyperpolarization9. This may explain why the anti-correlations are not as prominent in dfMRI as in BOLD at 3T and especially 7T. The significantly reduced anti-correlations in Pseudo-BOLD vs BOLD at 7T also suggest a direct contribution from blood water T2* to negative BOLD (since b=0.2 diffusion-weighting largely suppressed blood signal in Pseudo-BOLD). Finally, the larger clustering coefficient of the GM and WM connectivity in dfMRI vs BOLD strengthens the hypothesis that dfMRI brings additional information about WM activity.Conclusion
Under comparable brain activity and physiological conditions, dfMRI and BOLD fMRI capture different connectivity patterns, which represents a positive stride towards maximizing the potential of FC. Attenuation of anti-correlations in dfMRI suggests a neurovascular origin to this phenomenon. Additionally, dfMRI seems to capture information about WM connectivity that is absent in BOLD.Acknowledgements
This work was supported by SNSF Spark grant CRSK-2_190882 and ERC Starting Grant 'FIREPATH', SERI no. MB22.00032.References
1M. Lee, C. Smyser, and J. Shimony, “Resting-State fMRI: A Review of Methods and Clinical Applications,” AJNR: American Journal of Neuroradiology, vol. 34, pp. 1866–1872, Oct. 2013.
2W. Olszowy, Y. Diao, and I. O. Jelescu, “Beyond BOLD: Evidence for diffusion fMRI contrast in the human brain distinct from neurovascular response,” preprint, Neuroscience, May 2021.
3A. Shmuel, E. Yacoub, D. Chaimow, N. K. Logothetis, and K. Ugurbil, “Spatio-temporal point-spread function of fMRI signal in human gray matter at 7 Tesla,” NeuroImage, vol. 35, pp. 539–552, Apr. 2007.
4J. C. Gore, M. Li, Y. Gao, T.-L. Wu, K. G. Schilling, Y. Huang, A. Mishra, A. T. Newton, B. P. Rogers, L. M. Chen, A. W. Anderson, and Z. Ding, “Functional MRI and resting state connectivity in white matter - a mini-review,” Magnetic Resonance Imaging, vol. 63, pp. 1–11, Nov. 2019.
5M. Bianciardi, M. Fukunaga, P. van Gelderen, J. A. de Zwart, and J. H. Duyn, “Negative BOLD-fMRI signals in large cerebral veins,” Journal of Cerebral Blood Flow and Metabolism: Official Journal of the International Society of Cerebral Blood Flow and Metabolism, vol. 31, pp. 401–412, Feb. 2011.
6A. R. Wade, “The negative BOLD signal unmasked,” Neuron, vol. 36, pp. 993–995, Dec. 2002.
7A. Devor, P. Tian, N. Nishimura, I. C. Teng, E. M. C. Hillman, S. N. Narayanan, I. Ulbert, D. A. Boas, D. Kleinfeld, and A. M. Dale, “Suppressed Neuronal Activity and Concurrent Arteriolar Vasoconstriction May Explain Negative Blood Oxygenation Level-Dependent Signal,” The Journal of Neuroscience, vol. 27, p. 4452, Apr. 2007. Publisher: Society for Neuroscience.
8M. Rubinov and O. Sporns, “Complex network measures of brain connectivity: Uses and interpretations,” NeuroImage, vol. 52, pp. 1059–1069, Sept. 2010.
9J. A. Fraser and C. L.-H. Huang, “A quantitative analysis of cell volume and resting potential determination and regulation in excitable cells,” The Journal of Physiology, vol. 559, pp. 459–478, Sept. 2004.
Figures