0327
Improved estimates of cerebral circulation time from BOLD fMRI data using putamen and sagittal sinus signals1Physical Therapy and Human Movement Sciences, Feinberg School of Medicine, Northwestern University, Chicago, IL, United States, 2Biomedical Engineering, McCormick School of Engineering and Applied Sciences, Northwestern University, Evanston, IL, United States, 3Department of Cognitive Neuroscience, Maastricht University, Maastricht, Netherlands, 4Radiology, Feinberg School of Medicine, Northwestern University, Chicago, IL, United States, 5Medical Imaging, Lurie Children's Hospital of Chicago, Chicago, IL, United States
Synopsis
Keywords: fMRI Analysis, fMRI, cerebral circulation time
Motivation: Cerebral circulation time (CCT) is a metric that provides insight into cerebrovascular health. However, conventional CCT measurements typically require injection of contrast agents, or demonstrate high variability.
Goal(s): We propose an improved, contrast-free method to calculate CCT by cross-correlating fMRI signals from the putamen and sagittal sinus.
Approach: n 16 healthy adult datasets (8 subjects, 2 sessions), we compared CCT estimates using the internal carotid artery (as proposed in the literature) or putamen as “arterial” references in breath-hold and resting-state data.
Results: The putamen ROI provides more reliable CCT estimates, consistent with values from bolus-tracking methods.
Impact: A modified analysis of fMRI data provides a robust method to measure cerebral circulation time on a single-subject level. This method may offer an accessible, contrast-free metric of cerebrovascular health for future application in patient populations.
Introduction
Cerebral circulation time (CCT), the time required for blood to pass from cerebral arteries to veins, is a metric that captures overall cerebrovascular health. CCT is prolonged with normal aging1 and pathology (e.g., multiple sclerosis2), and is a predictor of ischemic events in carotid stenosis3. Various methods exist to measure CCT, such as dynamic susceptibility contrast MRI4, X-ray angiography5, or Doppler sonography6-7. These methods typically involve imaging of injected contrast agents, which may not be appropriate for all patient populations. Resting-state fMRI has been used to measure CCT, by examining the cross-correlation between BOLD signals from the internal carotid artery (ICA) and sagittal sinus (SS)1,8. However, this method may not be robust to estimate CCT on an individual level. First, resting-state signals have low SNR resulting in weak cross-correlations. Breath-hold fMRI, in which a vascular stimulus drives large systemic BOLD signal changes, may increase confidence in cross-correlations and improve CCT measurements9. Second, the fMRI signal in the ICA is not dominated by BOLD contrast and is sensitive to artifacts and vessel irregularities in pathology that make them difficult to mask. Alternative reference regions, representing early arterial arrival times in tissue, may also improve reliability of BOLD CCT. Thus, we studied the putamen BOLD signal as an alternative “arterial” reference due to its proximity to the ICAs, early perfusion compared to other brain regions, and predominant contributions from BOLD contrast.Methods
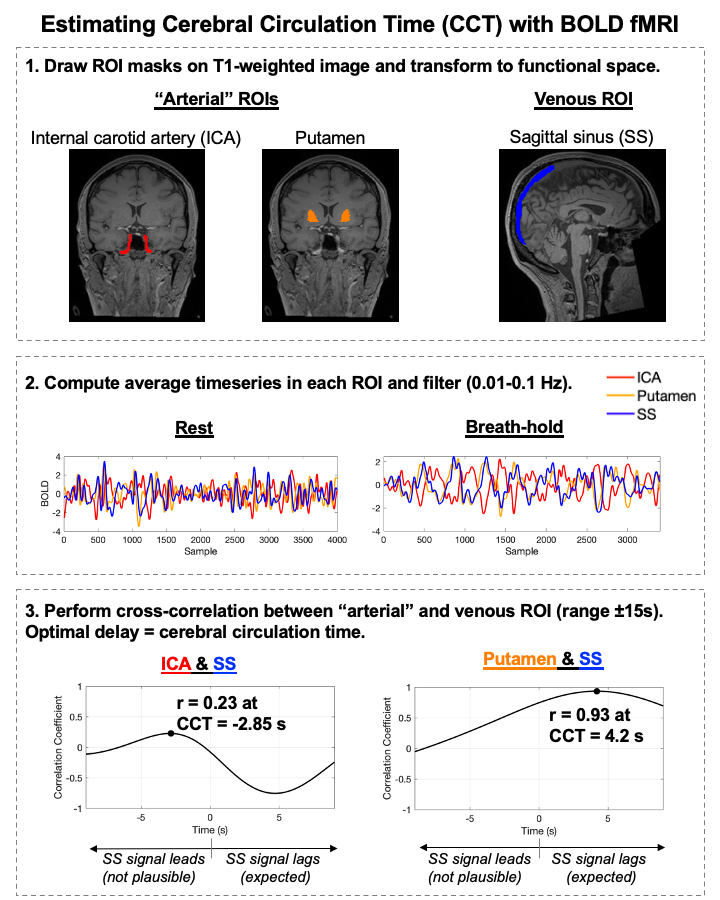
Data: 8 healthy adults (32±6 yrs, 5F) underwent two sessions (one week apart) on a 3T MRI. In each session, two multi-echo echo-planar-imaging scans (TR=1.5 s, TEs=10.6/28.69/46.78/64.87/82.96 ms, flip angle=70°, multi-band factor=4, GRAPPA=2, resolution=2.4×2.4×3 mm3) were acquired: one during a repeated breath-hold task (340 volumes) and another during fixated rest (400 volumes). Data were pre-processed as previously described10, including volume registration, nuisance regression, and distortion correction. To maintain ICA and SS signals, images were not brain-extracted.Calculating CCT: Fig1 illustrates the calculation of CCT. ICA, SS, and putamen masks were manually drawn on T1-weighted anatomical images in FSLeyes and transformed to functional space. The mean timeseries in each ROI was computed from the pre-processed, optimally-combined functional data. Timeseries were upsampled (66 Hz) and band-pass filtered (0.01-0.1 Hz, 4th-order Butterworth filter). Cross-correlations were performed between “arterial” timeseries (ICA or putamen) and SS timeseries (range=±15 seconds), in breath-hold and rest. The shift (in seconds) that maximized the positive correlation coefficient represents CCT.
Comparisons: Paired t-tests were used to compare CCT estimates between each method (breath-hold vs. rest; ICA vs. putamen ROIs), after Bonferroni correction for multiple comparisons (α=8.3E-3). Coefficient of variation (CoV) was computed to assess CCT reliability.
Results
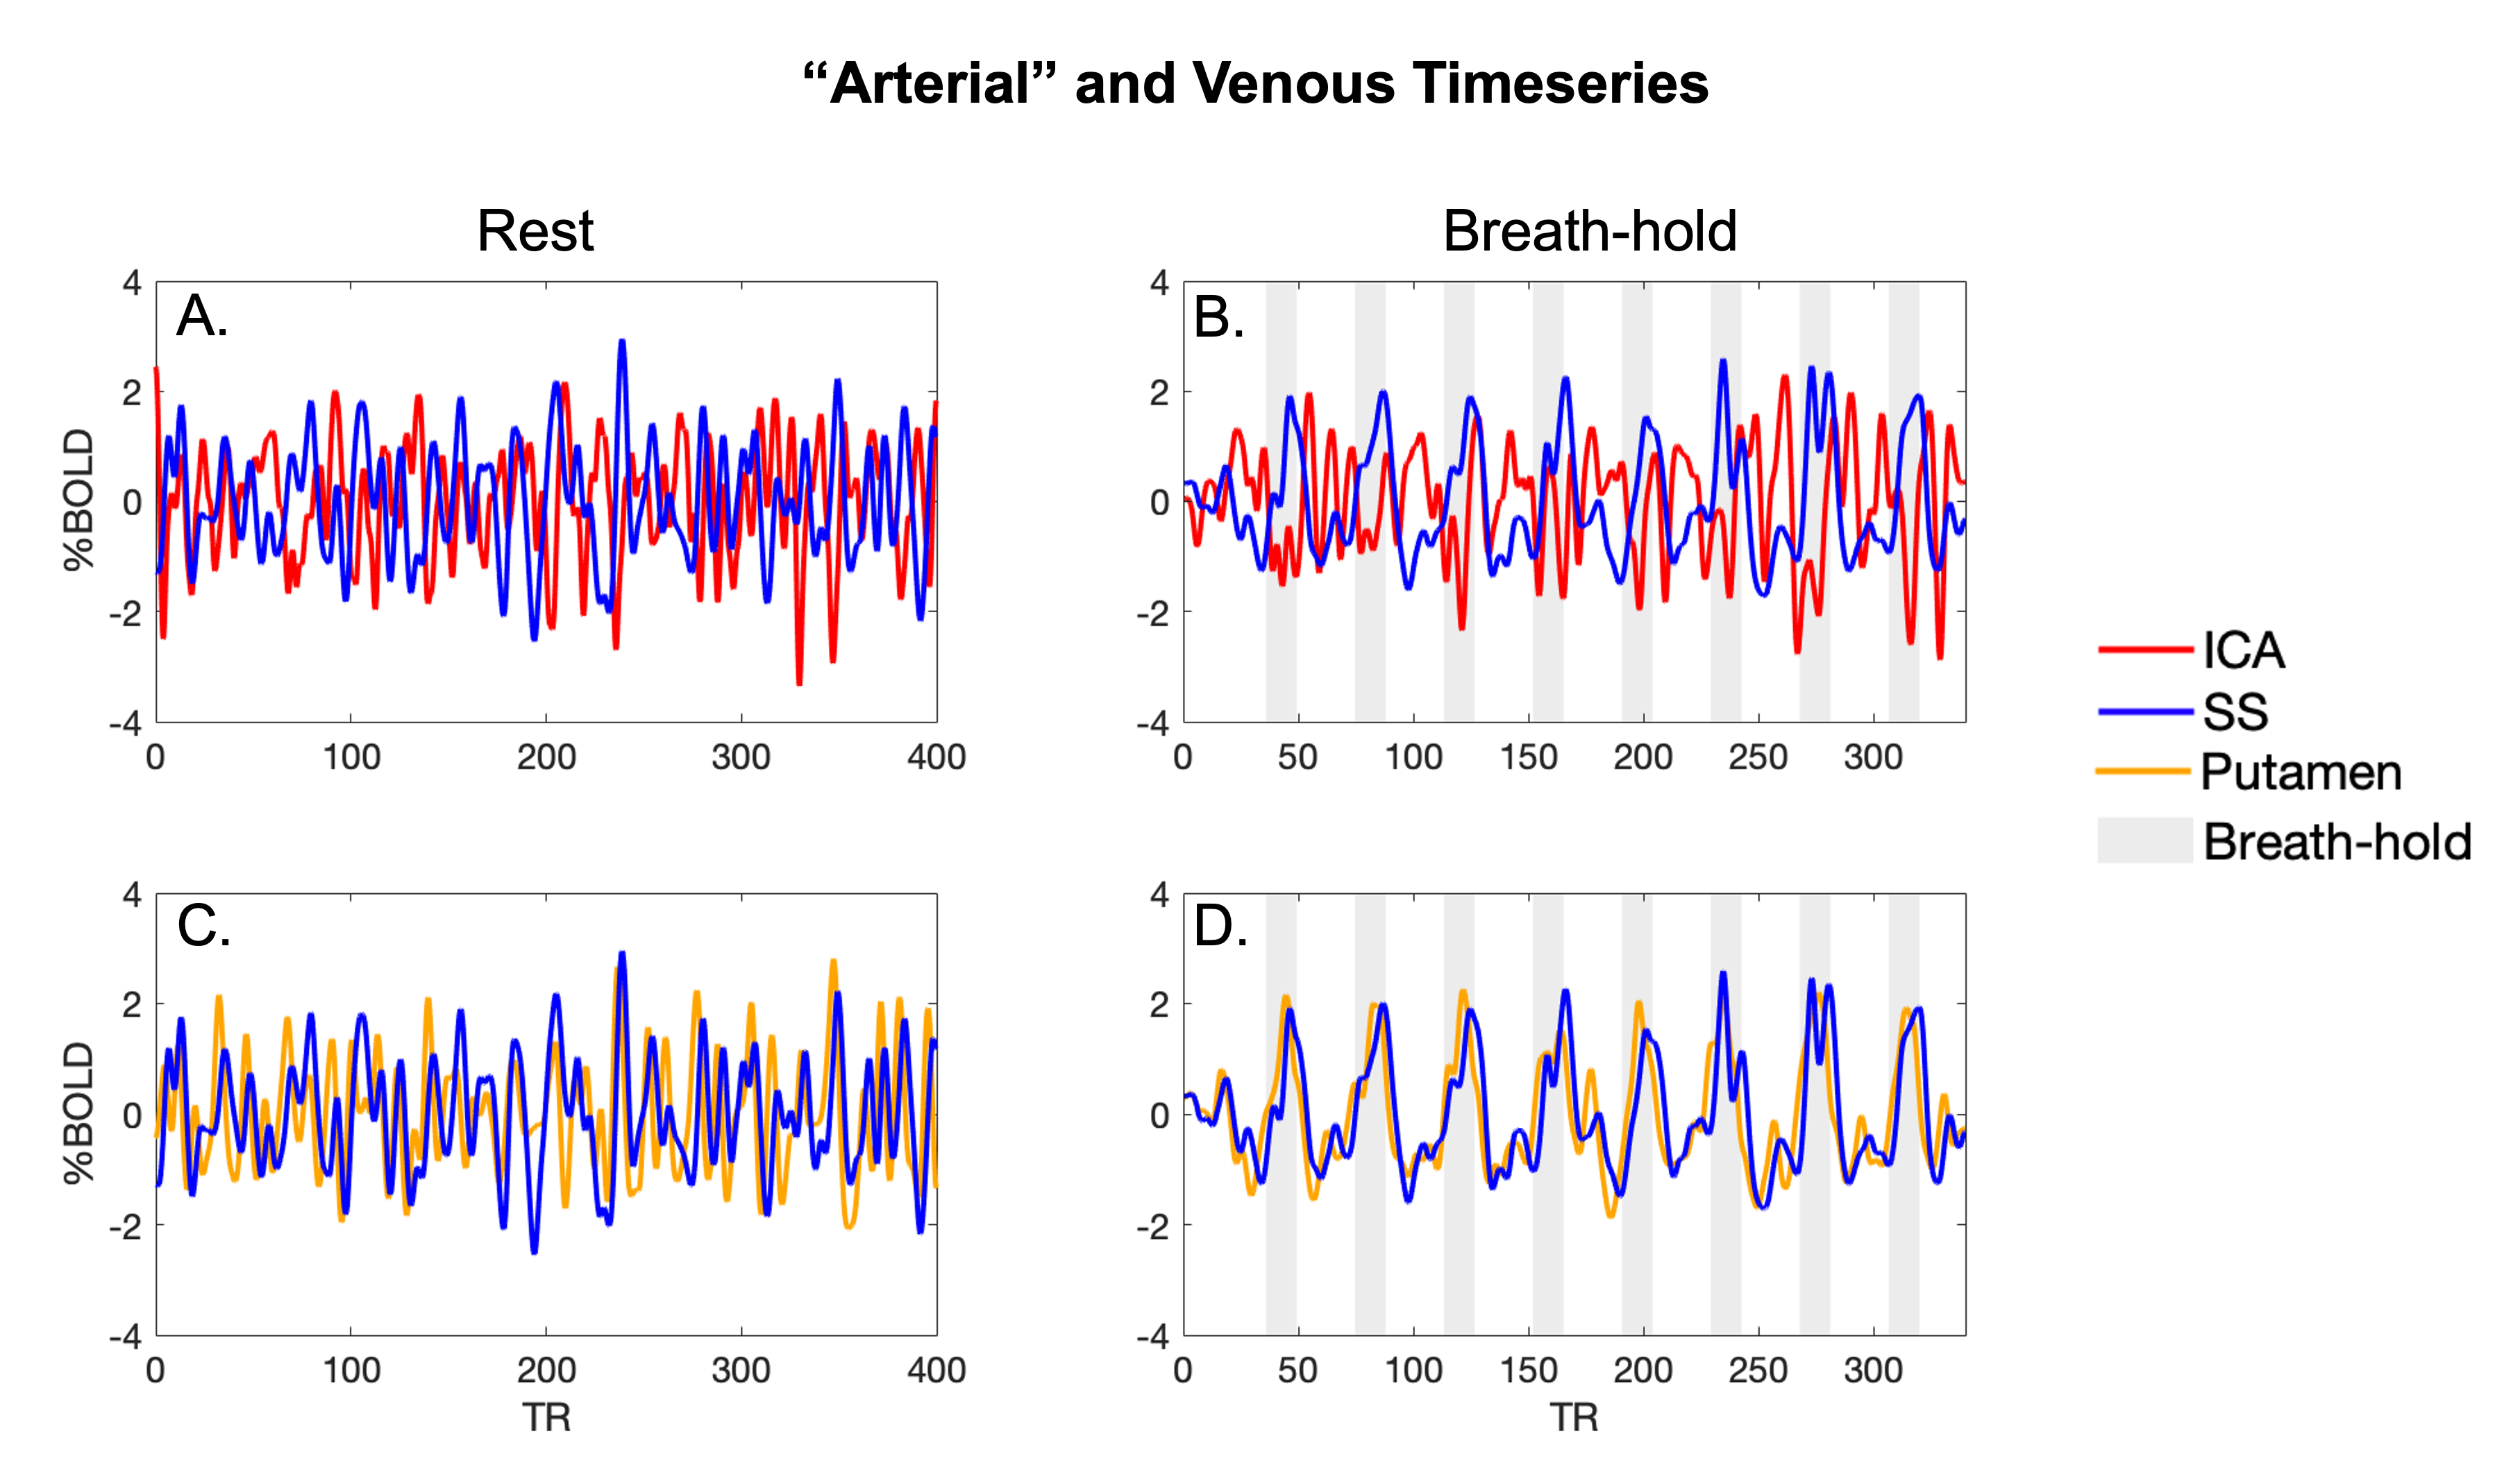
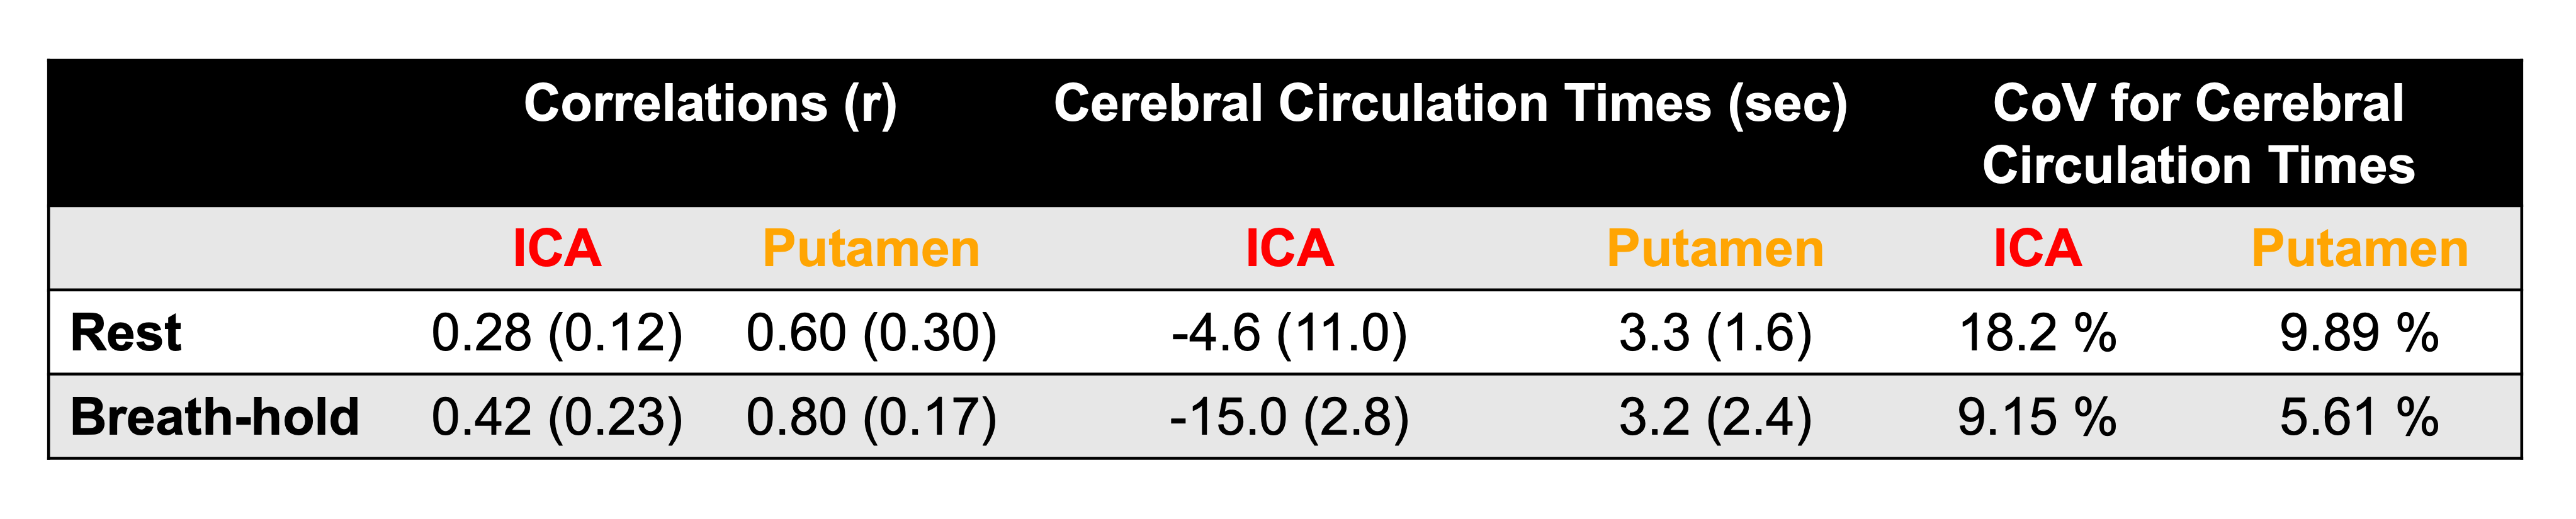
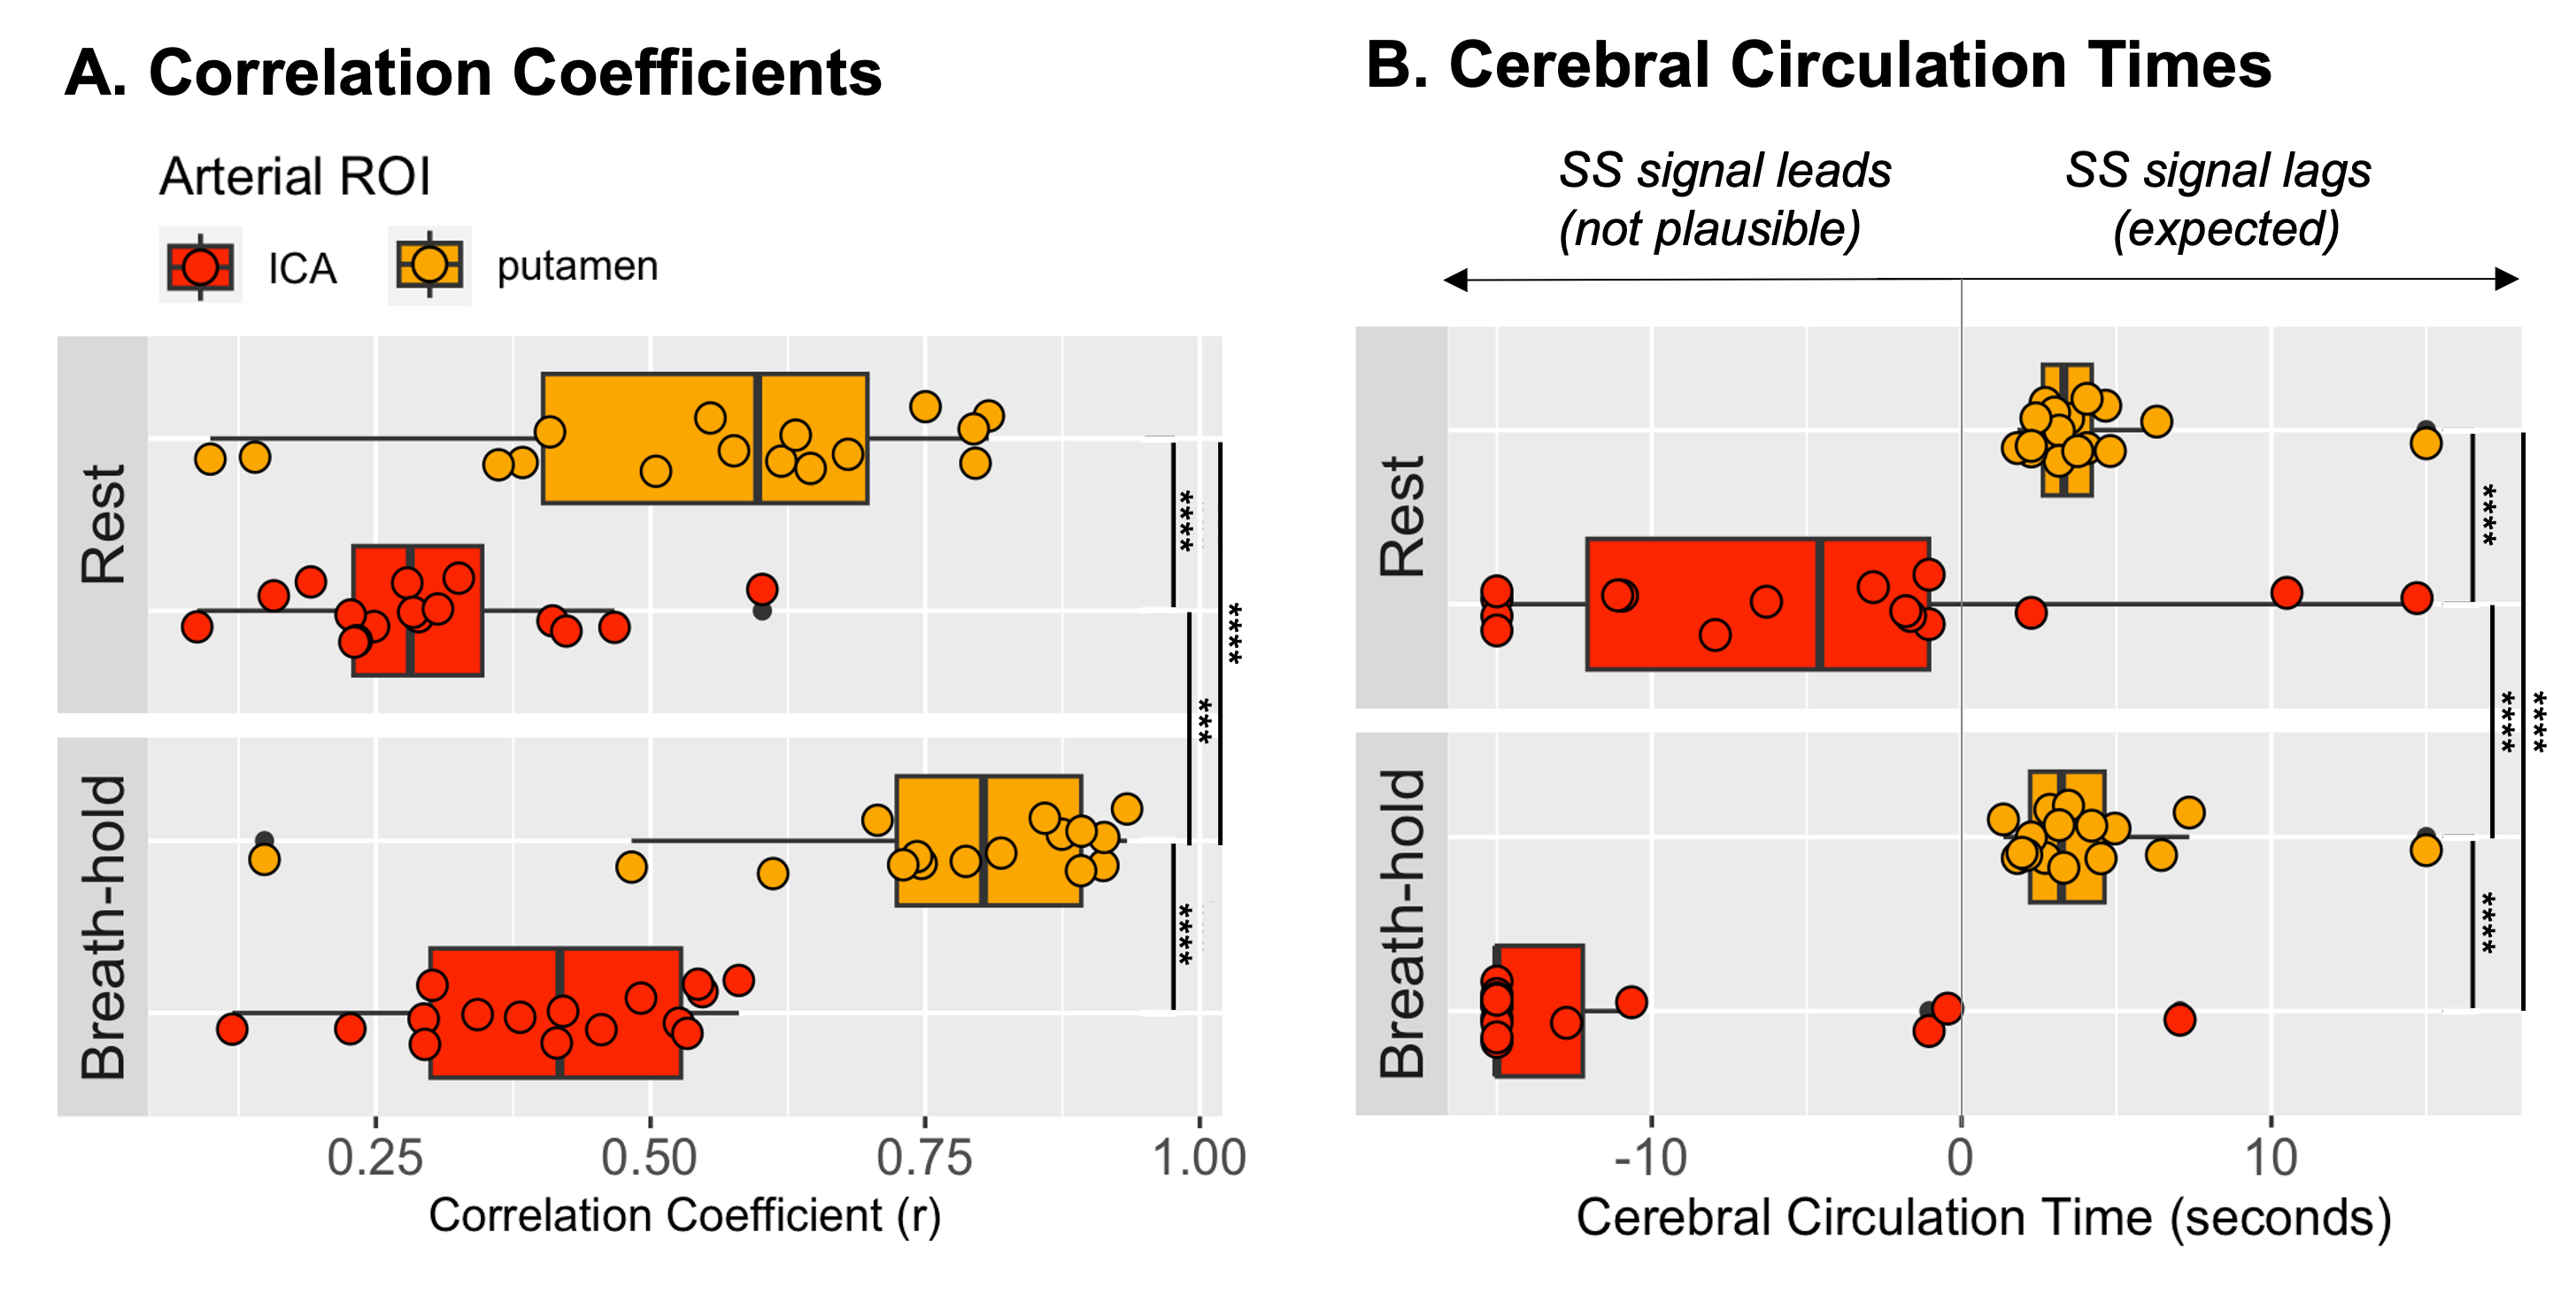
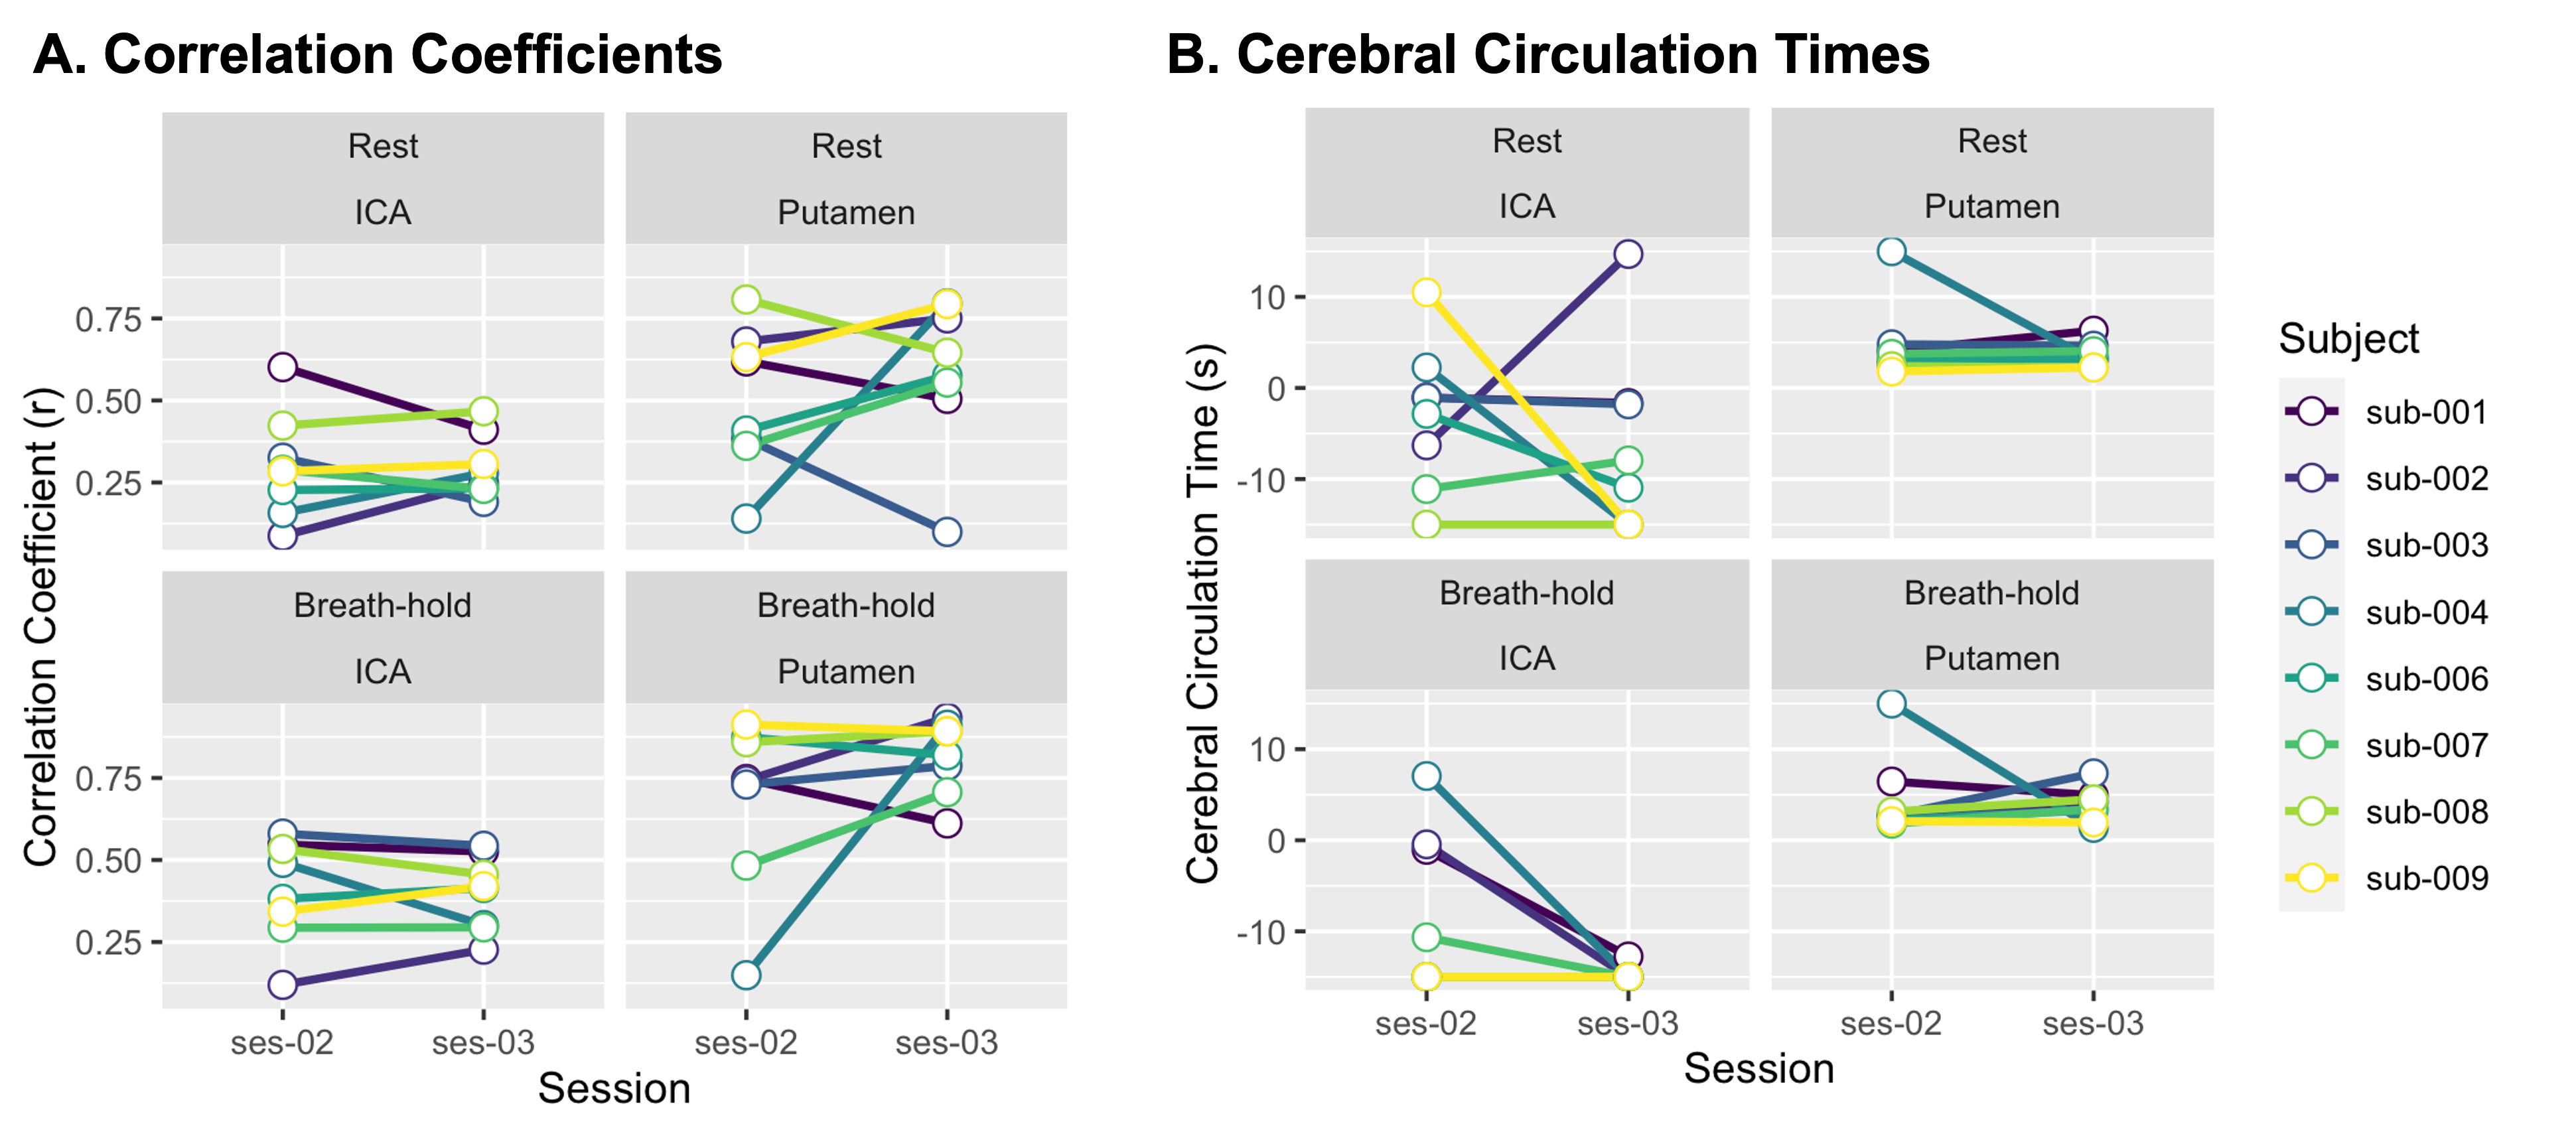
In resting-state data, ROI timeseries were dominated by spontaneous fluctuations (Fig2A,C), whereas timeseries from breath-hold data contained periodic BOLD increases time-locked to the task (Fig2B,D). Correlation amplitudes between “arterial” and venous timeseries were generally higher in breath-hold data, particularly when using the putamen ROI (Table1, Fig3A). When using the ICA as the “arterial” ROI, CCT estimates were highly variable and predominantly negative, indicating a physiologically implausible phenomenon of blood signals moving from SS to ICA (Table1, Fig3B). CCT estimates using the putamen ROI were less variable in both resting-state and breath-hold data, and within the expected range of 4-5 seconds for healthy adults1 (Table1). CCT estimates were also more consistent between two sessions when using the putamen ROI, indicated by a lower CoV (Table1, Fig4).Discussion
In a sample of healthy adults, we demonstrate that CCT can be robustly measured by cross-correlating putamen and SS signals in resting-state or breath-hold fMRI data. Using the putamen as an alternative ROI to the ICA provides more reliable estimates in both data types. While previous reports saw sensible group-average CCT estimates from ICA and SS signals in resting-state data, they used a large dataset to account for inter-subject variability and observed mostly negative correlations1. We restricted our analysis to positive correlations to better interpret signal offsets, and our method may be more robust for measuring CCT on an individual subject level (improving the utility of CCT in patients).Although breath-hold data increased correlations and thus may enhance confidence in CCT values, resting-state fMRI appears to be a viable strategy for CCT estimation when the putamen is used as a reference region. Thus, CCT measurements could be obtained retrospectively from existing resting-state data repositories. Putamen and SS ROIs could also be obtained from an atlas to reduce analysis time. Future work will evaluate alternatives to cross-correlation for estimating CCT and investigate the reliability of these methods in a larger, densely sampled adult cohort.
Acknowledgements
Research reported in this publication was supported by the National Heart, Lung, And Blood Institute of the National Institutes of Health under Award Number F31HL166079. The content is solely the responsibility of the authors and does not necessarily represent the official views of the National Institutes of Health. The authors would like to thank our collaborators at the Basque Center on Cognition, Brain, and Language for generously sharing data and pre-processing code used in this abstract. Data can be accessed at doi:10.18112/openneuro.ds003192.v1.0.1 and code is available at https://github.com/smoia/EuskalIBUR_dataproc.References
[1] O. Di Donato et al., “Multiple Sclerosis : Cerebral Circulation Time,” Radiology, vol. 262, no. 3, pp. 947–955, 2012.
[2] Z. Chen et al., “Cerebral Circulation Time Is a Potential Predictor of Disabling Ischemic Cerebrovascular Events in Patients With Non-disabling Middle Cerebral Artery Stenosis,” Front. Neurol., vol. 12, no. May, pp. 1–7, 2021.
[3] M. Ibaraki et al., “Cerebral vascular mean transit time in healthy humans: A comparative study with PET and dynamic susceptibility contrast-enhanced MRI,” J. Cereb. Blood Flow Metab., vol. 27, no. 2, pp. 404–413, 2007.
[4] K. Asai et al., “X-ray angiography perfusion imaging with an intra-Arterial injection: Comparative study with 15 O-gas/water positron emission tomography,” J. Neurointerv. Surg., vol. 10, no. 8, pp. 780–783, 2018.
[5] S. J. Schreiber, U. Franke, F. Doepp, E. Staccioli, K. Uludag, and J. M. Valdueza, “Doppler sonographic measurement of global cerebral circulation time using echo contrast-enhanced ultrasound in normal individuals and patients with arteriovenous malformations,” Ultrasound Med. Biol., vol. 28, no. 4, pp. 453–458, Apr. 2002.
[6] O. Hoffmann, M. Weih, S. Schreiber, K. M. Einhäupl, and J. M. Valdueza, “Measurement of Cerebral Circulation Time by Contrast-Enhanced Doppler Sonography,” Cerebrovasc. Dis., vol. 10, no. 2, pp. 142–146, Apr. 2000.
[7] Y. Tong, J. (Fiona) Yao, J. J. Chen, and B. de B. Frederick, “The resting-state fMRI arterial signal predicts differential blood transit time through the brain,” J. Cereb. Blood Flow Metab., vol. 39, no. 6, pp. 1148–1160, 2019.
[8] J. Yao et al., “Cerebral Circulation Time Derived From fMRI Signals in Large Blood Vessels,” J. Magn. Reson. Imaging, vol. 50, no. 5, p. 1504, Nov. 2019.
[9] R. C. Stickland, K. M. Zvolanek, S. Moia, A. Ayyagari, C. Caballero-Gaudes, and M. G. Bright, “A practical modification to a resting state fMRI protocol for improved characterization of cerebrovascular function,” Neuroimage, vol. 239, no. June, p. 118306, 2021.
[10] S. Moia et al., “ICA-based denoising strategies in breath-hold induced cerebrovascular reactivity mapping with multi echo BOLD fMRI,” Neuroimage, vol. 233, p. 117914, Jun. 2021.
Figures