0326
Molecular-informed Functional Imaging of Working Memory Processes1CIMeC, Center for Mind/Brain Sciences, University of Trento, Trento, Italy, 2Department of Medical and Surgical Specialties, Radiological Sciences and Public Health, University of Brescia, Brescia, Italy, 3Department of Neuroimaging, Institute of Psychiatry, Psychology and Neuroscience, King’s College London, London, United Kingdom, 4Department of R&D Advanced Applications, Olea Medical, La Ciotat, France
Synopsis
Keywords: fMRI Analysis, fMRI (task based), Working Memory, Brain Functional Connectivity, Neuroreceptors
Motivation: Task-based fMRI studies highlighted the dorsolateral prefrontal cortex (dlPFC) involvement during working memory (WM) processes. However, BOLD fMRI indirectly estimates neural activity and lacks neuroreceptor specificity.
Goal(s): We investigated inhibitory and excitatory receptor density influence on functional connectivity (FC) during varying WM loads.
Approach: Using N-back fMRI tasks and Receptor-Enriched Analysis of Functional Connectivity by Targets (REACT), we assessed GABA-A and mGluR5 connectivity effects.
Results: We found decreased GABA-A- and increased mGluR5-enriched FC with increasing WM load in networks involving the dlPFC, in line with fMRI and single-voxel MRS studies. Therefore, REACT is a promising tool bridging whole-brain molecular organization and FC.
Impact: Our molecular-enriched fMRI analysis revealed how varying working memory load modulates functional connectivity related to the underlying neurotransmitters. This provides crucial information for a better understanding of the neural mechanisms underlying brain disorders like Alzheimer’s disease and Schizophrenia.
Introduction
Existing literature tried to establish the link between fMRI BOLD signal and neurotransmitters, often relying on invasive methods, like Positron Emission Tomography1, or focusing on single brain regions using Magnetic Resonance Spectroscopy (MRS)2. In this context, the "Receptor-Enriched Analysis of Functional Connectivity by Targets" (REACT)3 framework has emerged as a promising approach for understanding how neuroreceptor information enhances functional connectivity. Our study, conducted with healthy subjects, sought to evaluate REACT's consistency with previous fMRI and MRS studies by applying it to a working memory (WM) task involving parametrically increasing cognitive load. Previous MRS results revealed reduced GABA levels in the Dorsolateral Prefrontal cortex (dlPFC)4, part of the Control and Salience networks, and increased glutamate levels in the dlPFC and Intraparietal Sulcus5,6 with elevated WM loads.Methods
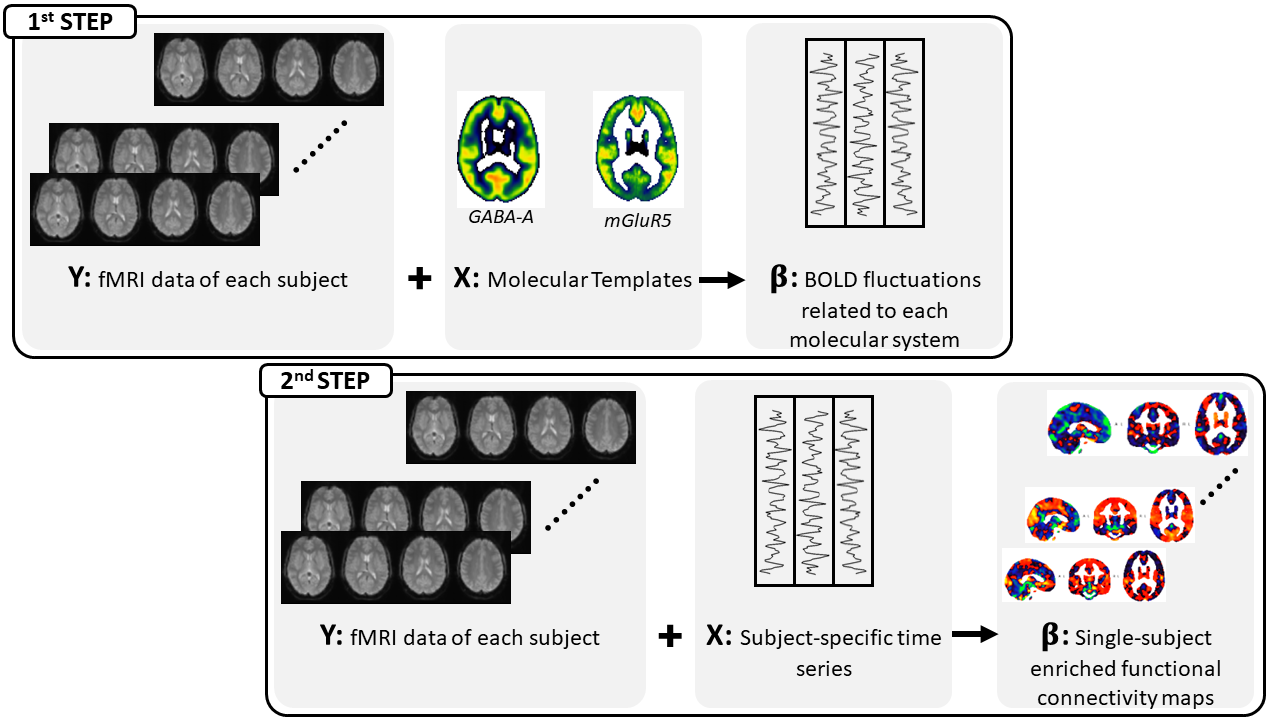
MRI data of 33 healthy subjects (18 men; 25.6±3.2 years) were collected at CIMeC in Trento, Italy, with a 3T scanner (MAGNETOM Prisma, Siemens) equipped with a 64-channel head-neck RF coil. The acquisition protocol included a high resolution structural T1-weighted image; three runs of an N-back task with increasing cognitive load (0-back, 1-back, and 2-back) acquired with a 2D Echo-Planar Imaging (TR=2s, TE=28ms, 3mm-isotropic voxels, flip-angle=59°, Multiband Acceleration Factor=2), and a standard double-echo gradient echo sequence used for geometric distortion correction. Reaction times (RT) and accuracy were collected to assess participants’ behavioral performances and compared across the three N-back runs with a paired two-sample t-test. After standard preprocessing (slice timing, motion and distortion corrections, normalization and spatial smoothing), fMRI data were analyzed using REACT3, by exploiting two molecular templates of GABA-A7 and mGluR58 neuroreceptors. This framework (Fig.1) consists of a two-step multiple regression analysis: 1) the templates are used as spatial regressors to weight the subject-specific fMRI data and determine the BOLD fluctuation associated with each molecular system; 2) the BOLD fluctuations serve as temporal regressors to create single-subject FC maps enriched by the receptor density distribution. To better characterize the enriched-FC at the network level, we employed the Schaefer atlas (200 parcels, 7 networks)9 and extracted the average GABA-A-enriched and mGluR5-enriched FC for each subject and cognitive load. Differences in the distribution of the average enriched-FC were assessed with a Wilcoxon rank-sum test within each network and between N-back runs. We also investigated FC changes between WM loads at the whole-brain level for each molecular-enriched FC map by running paired t-tests between N-back runs, implemented with FSL’s randomise10,11.Results
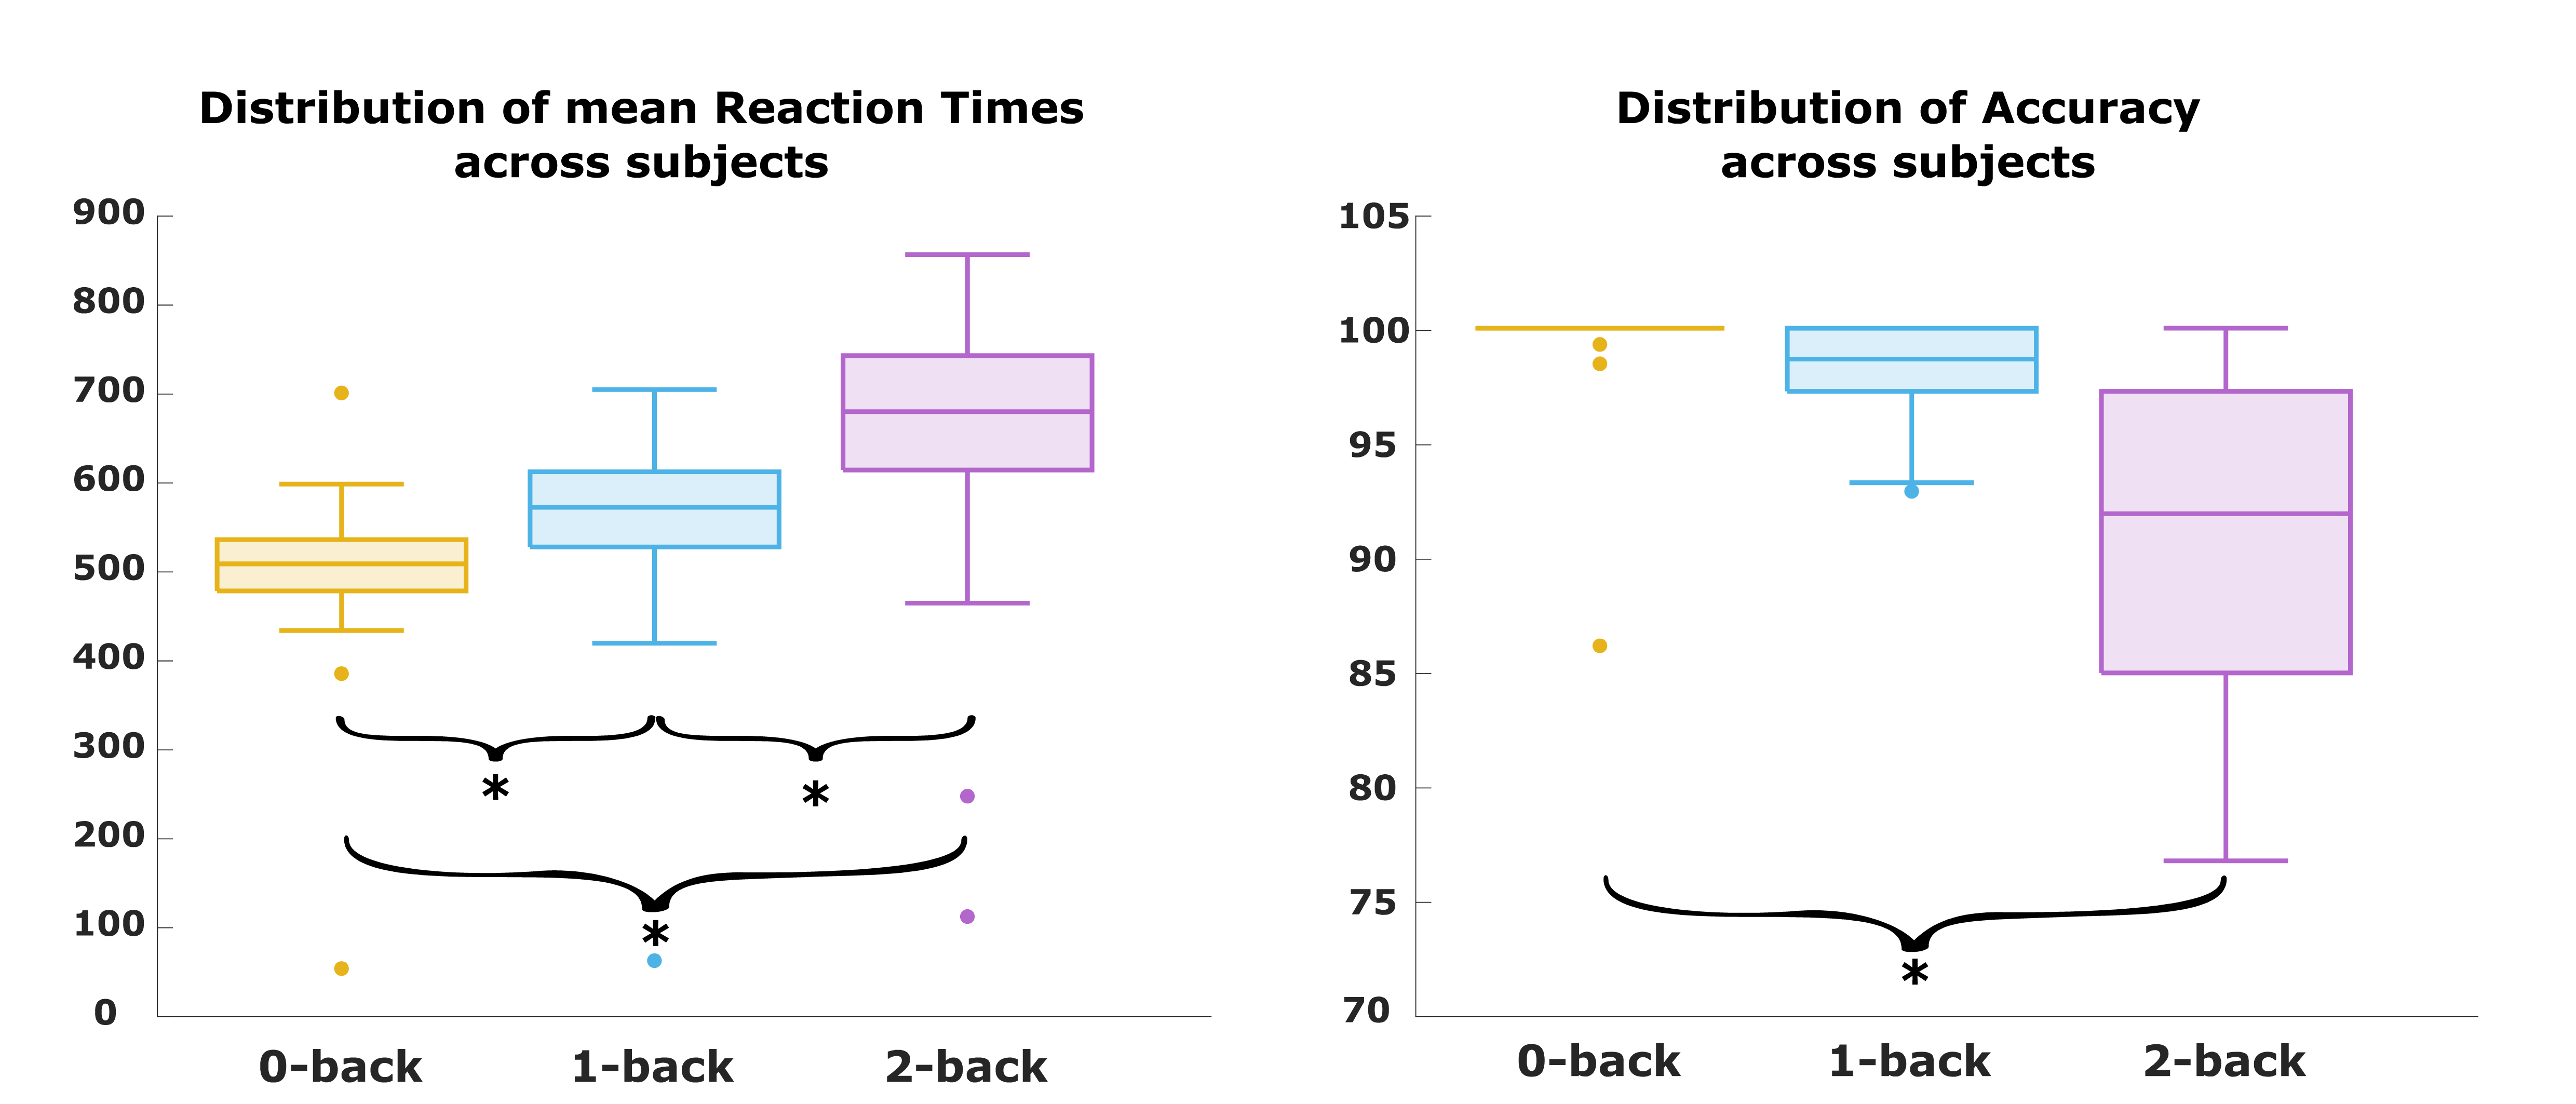
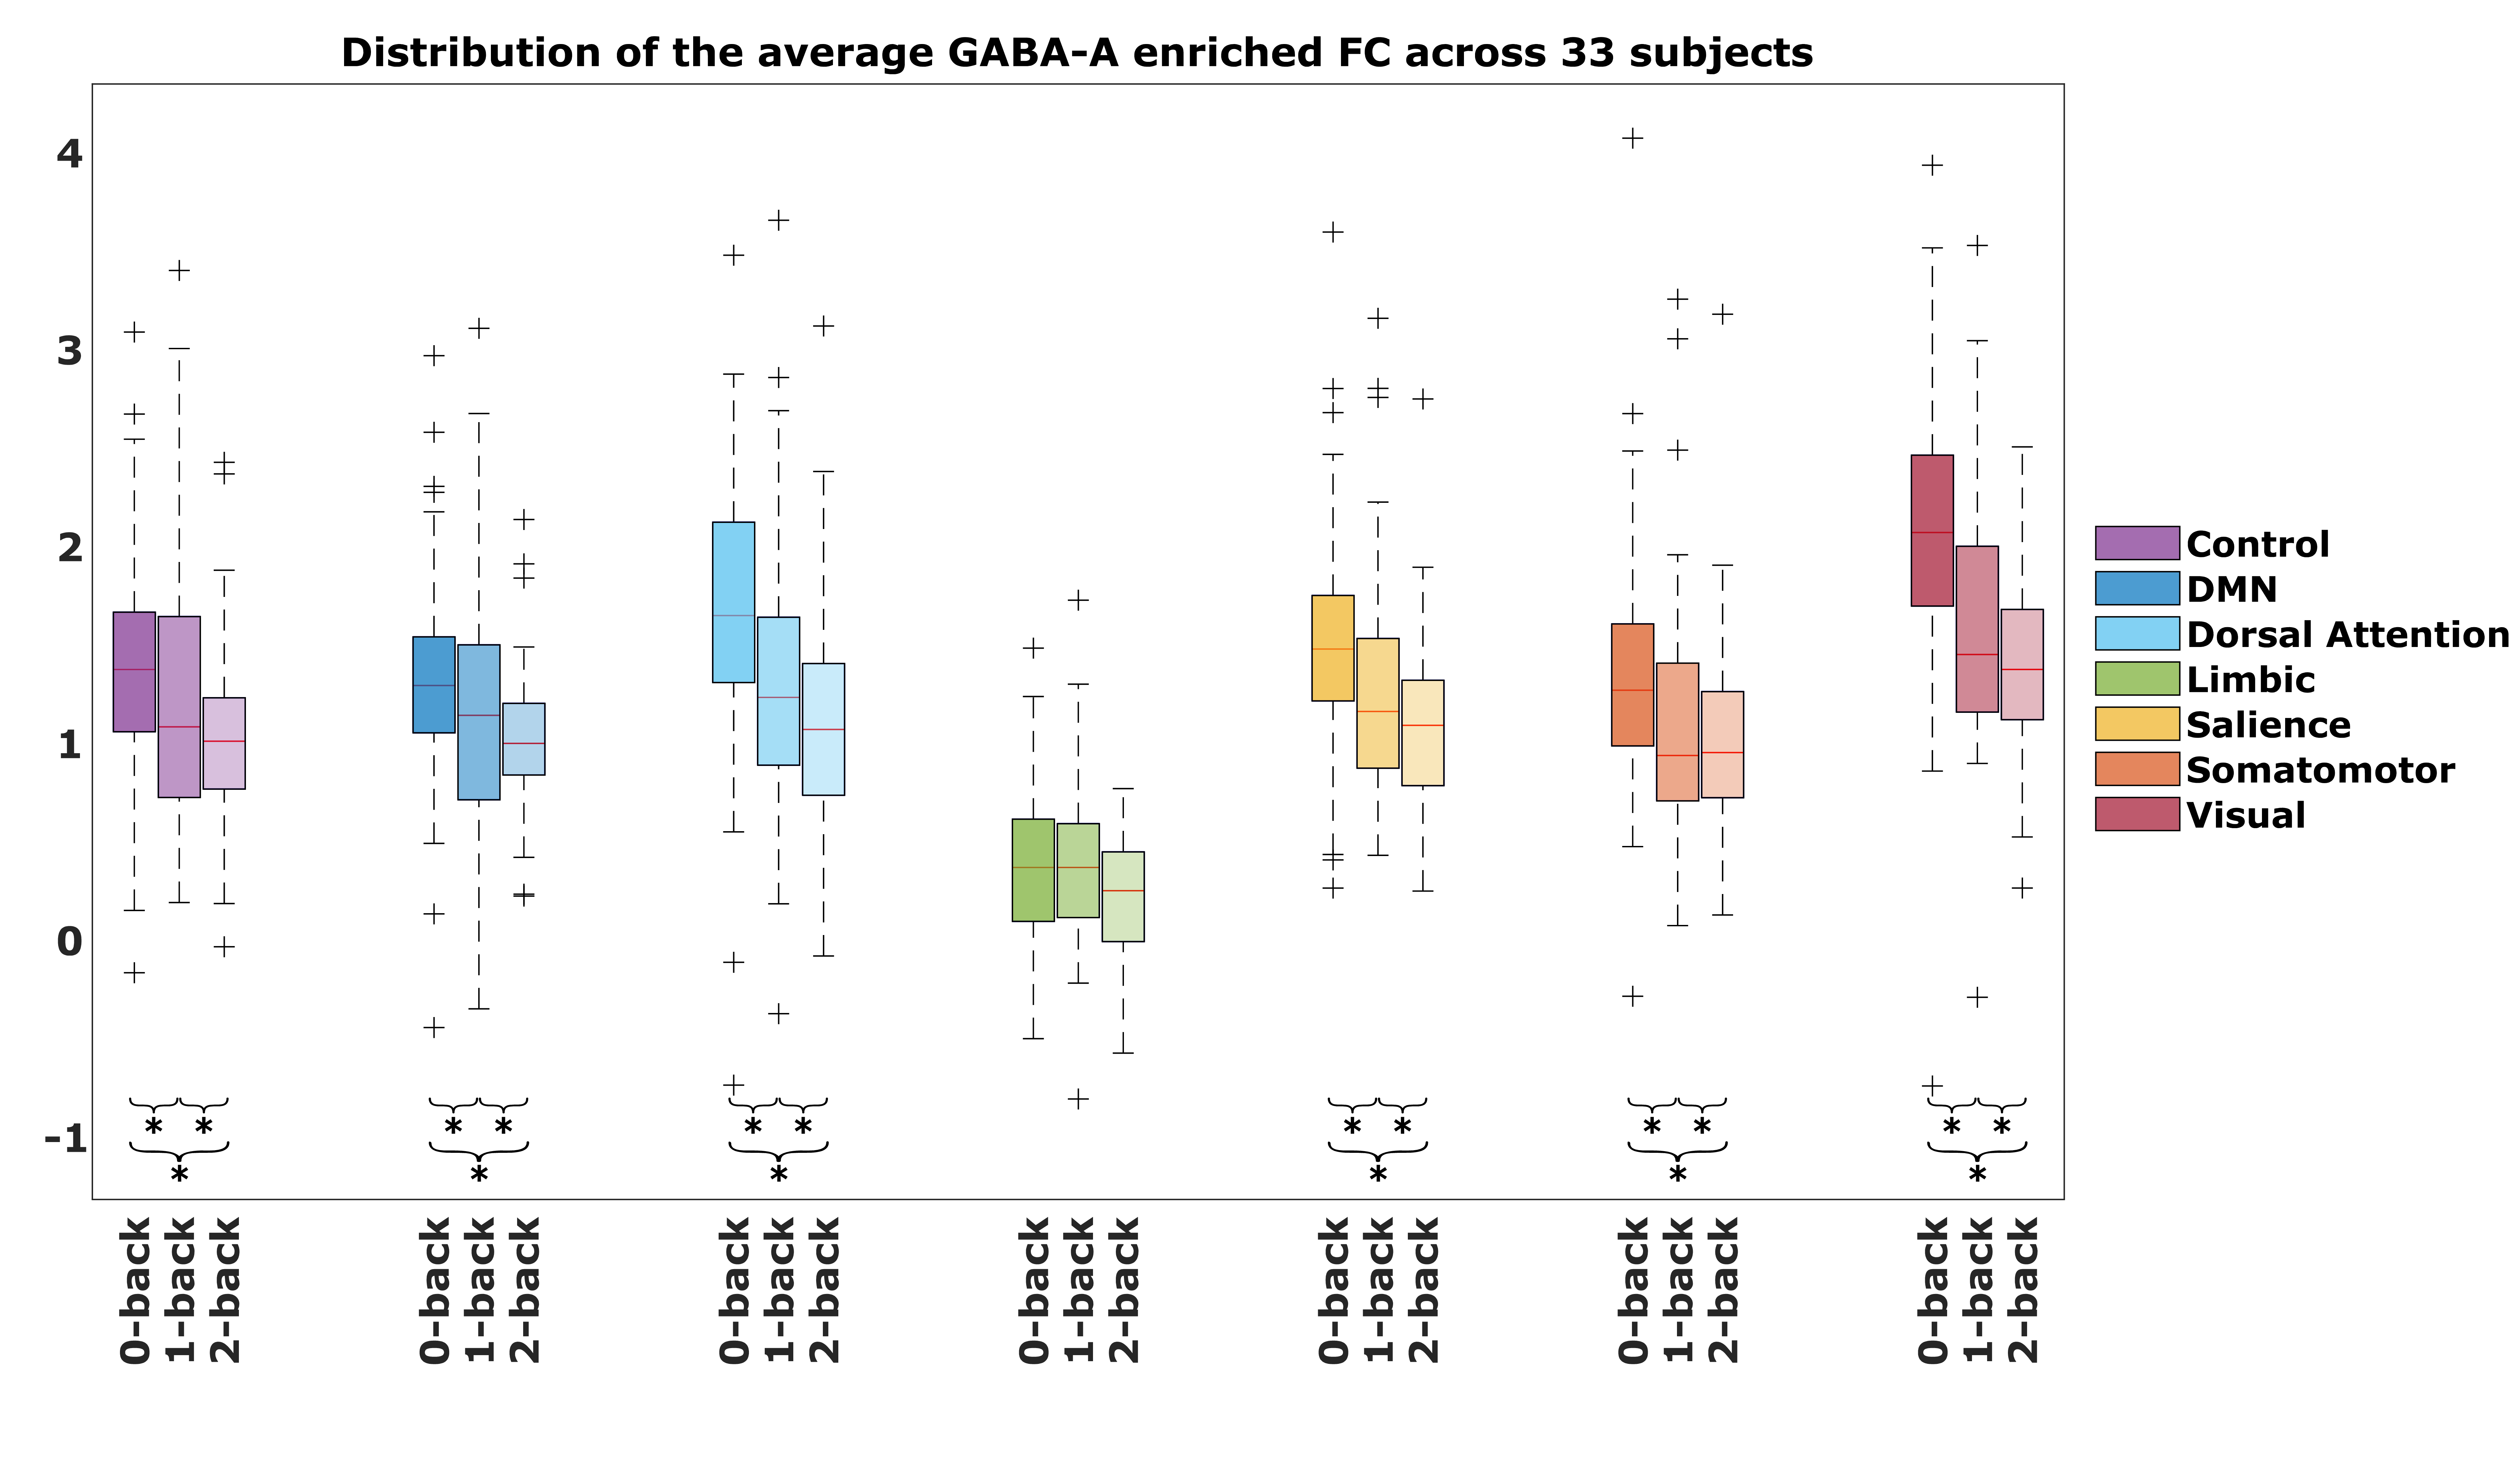
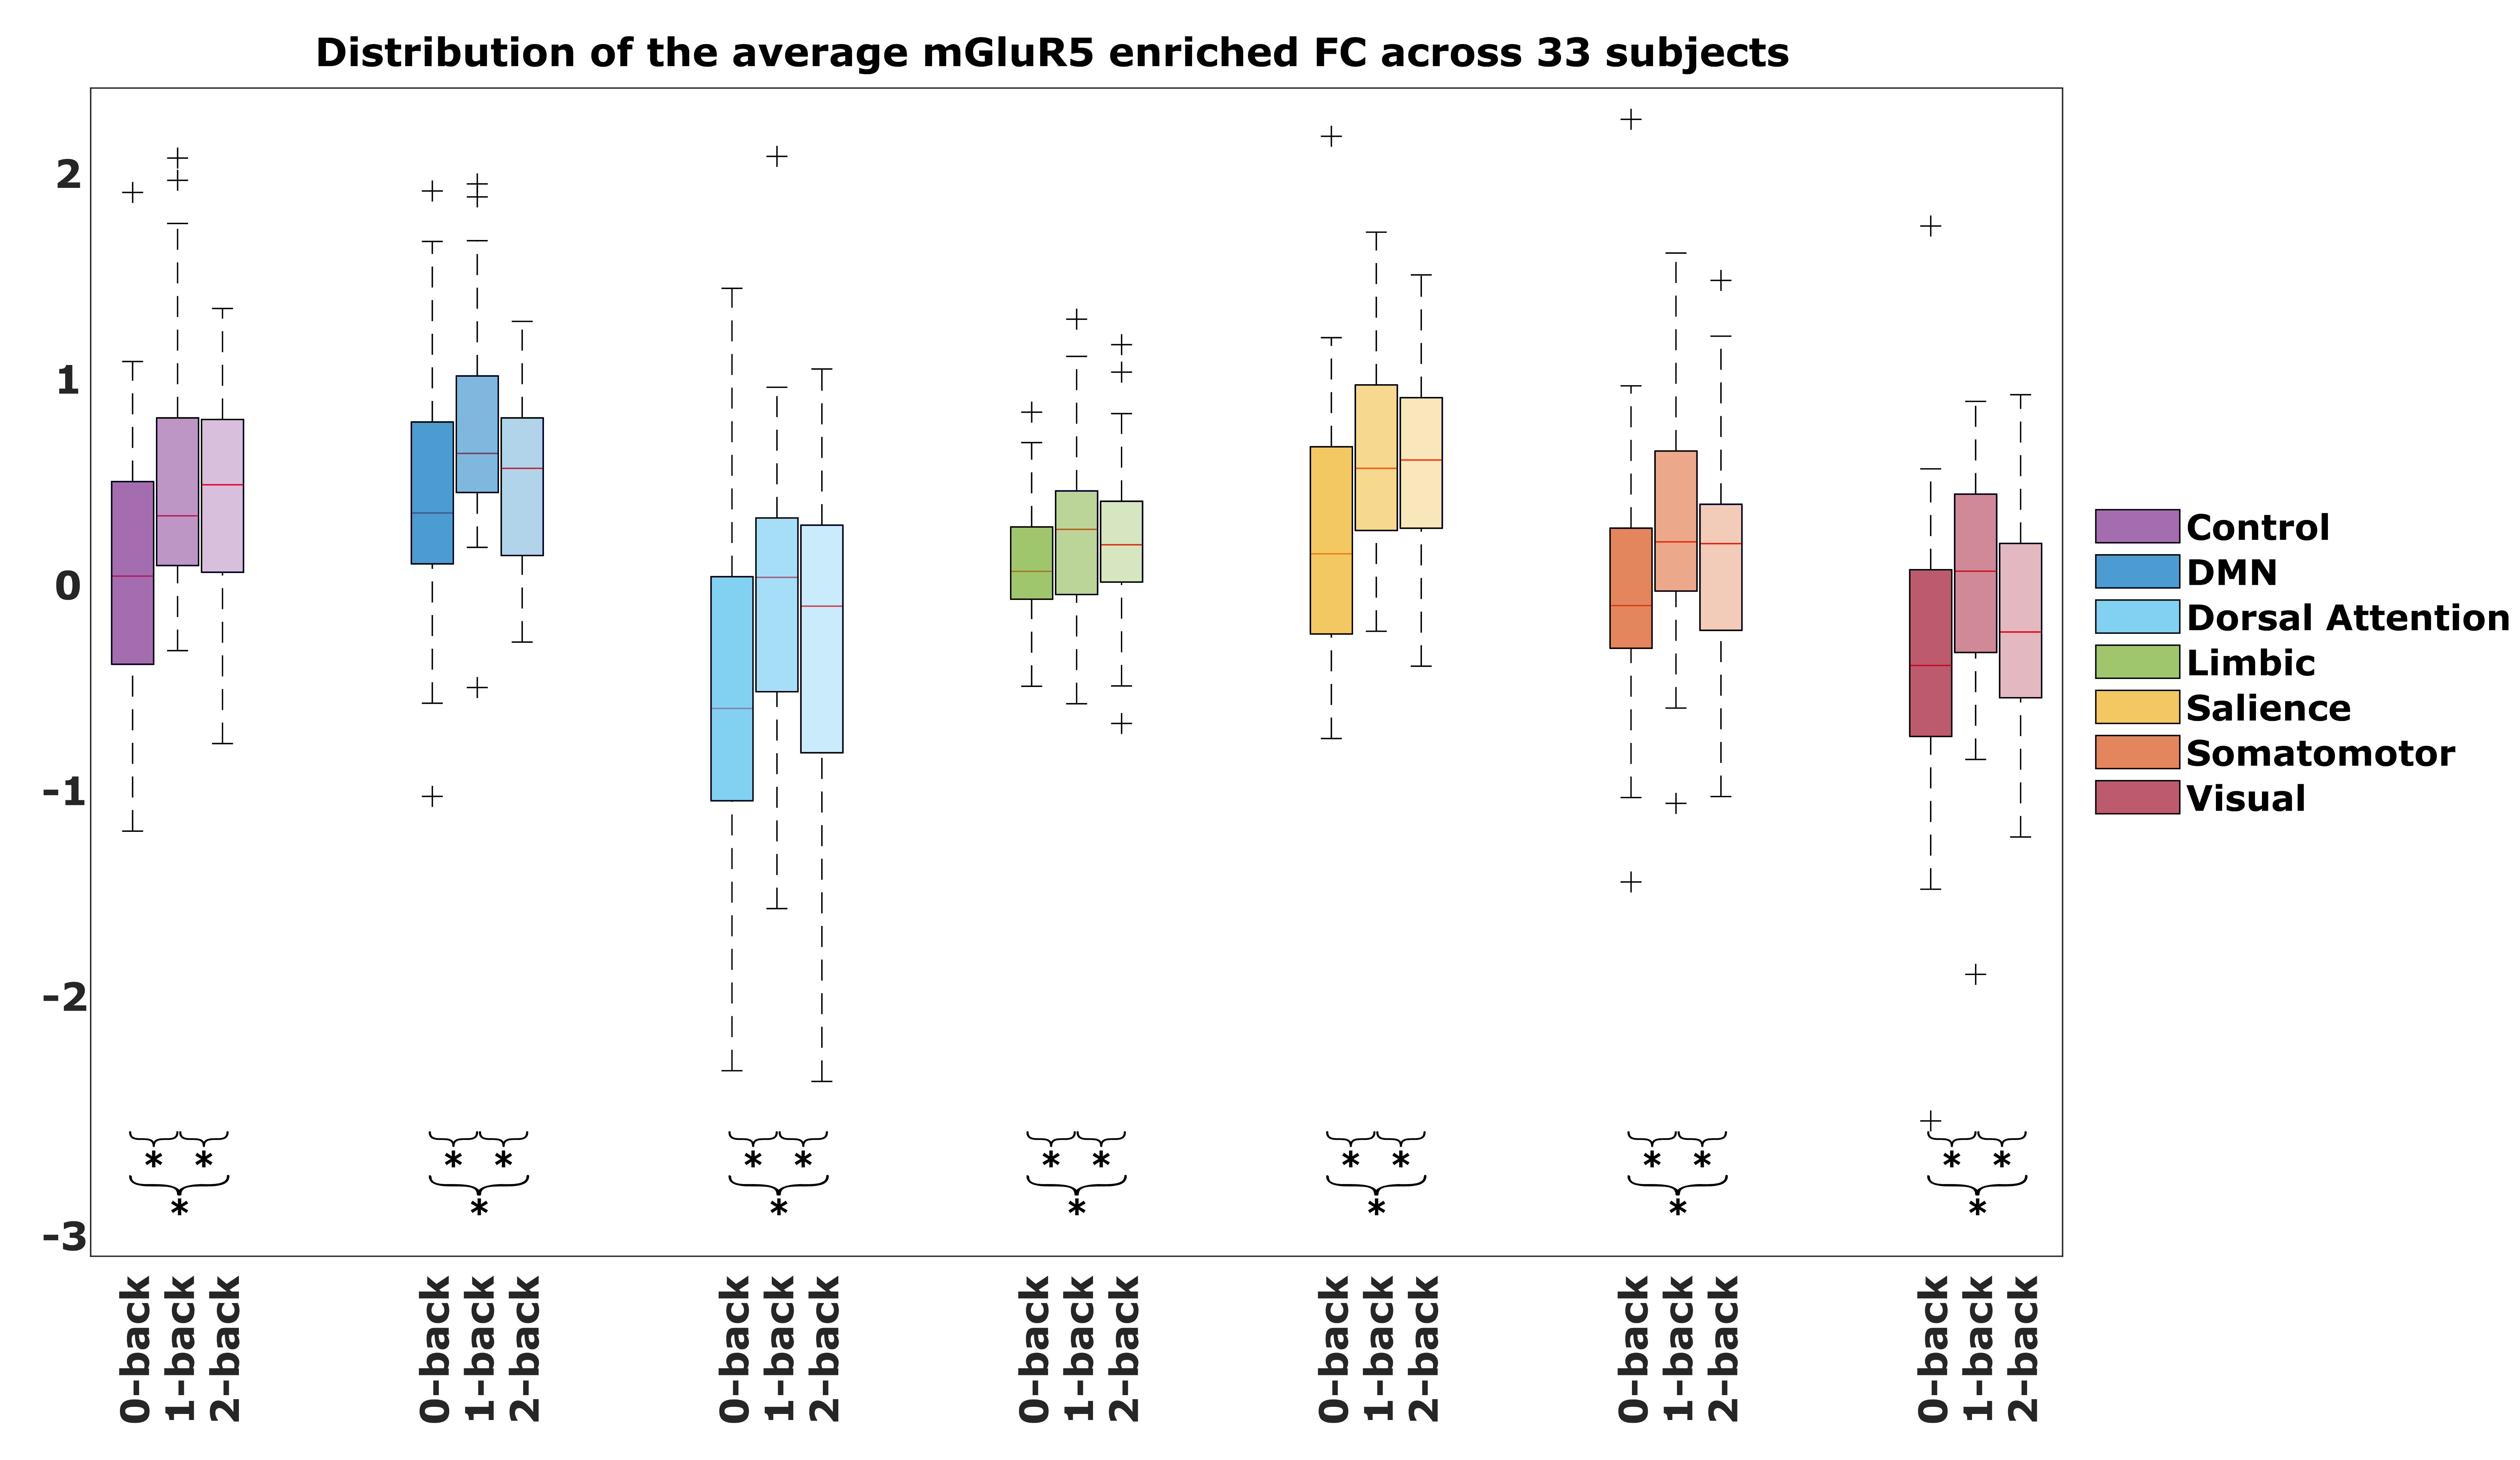
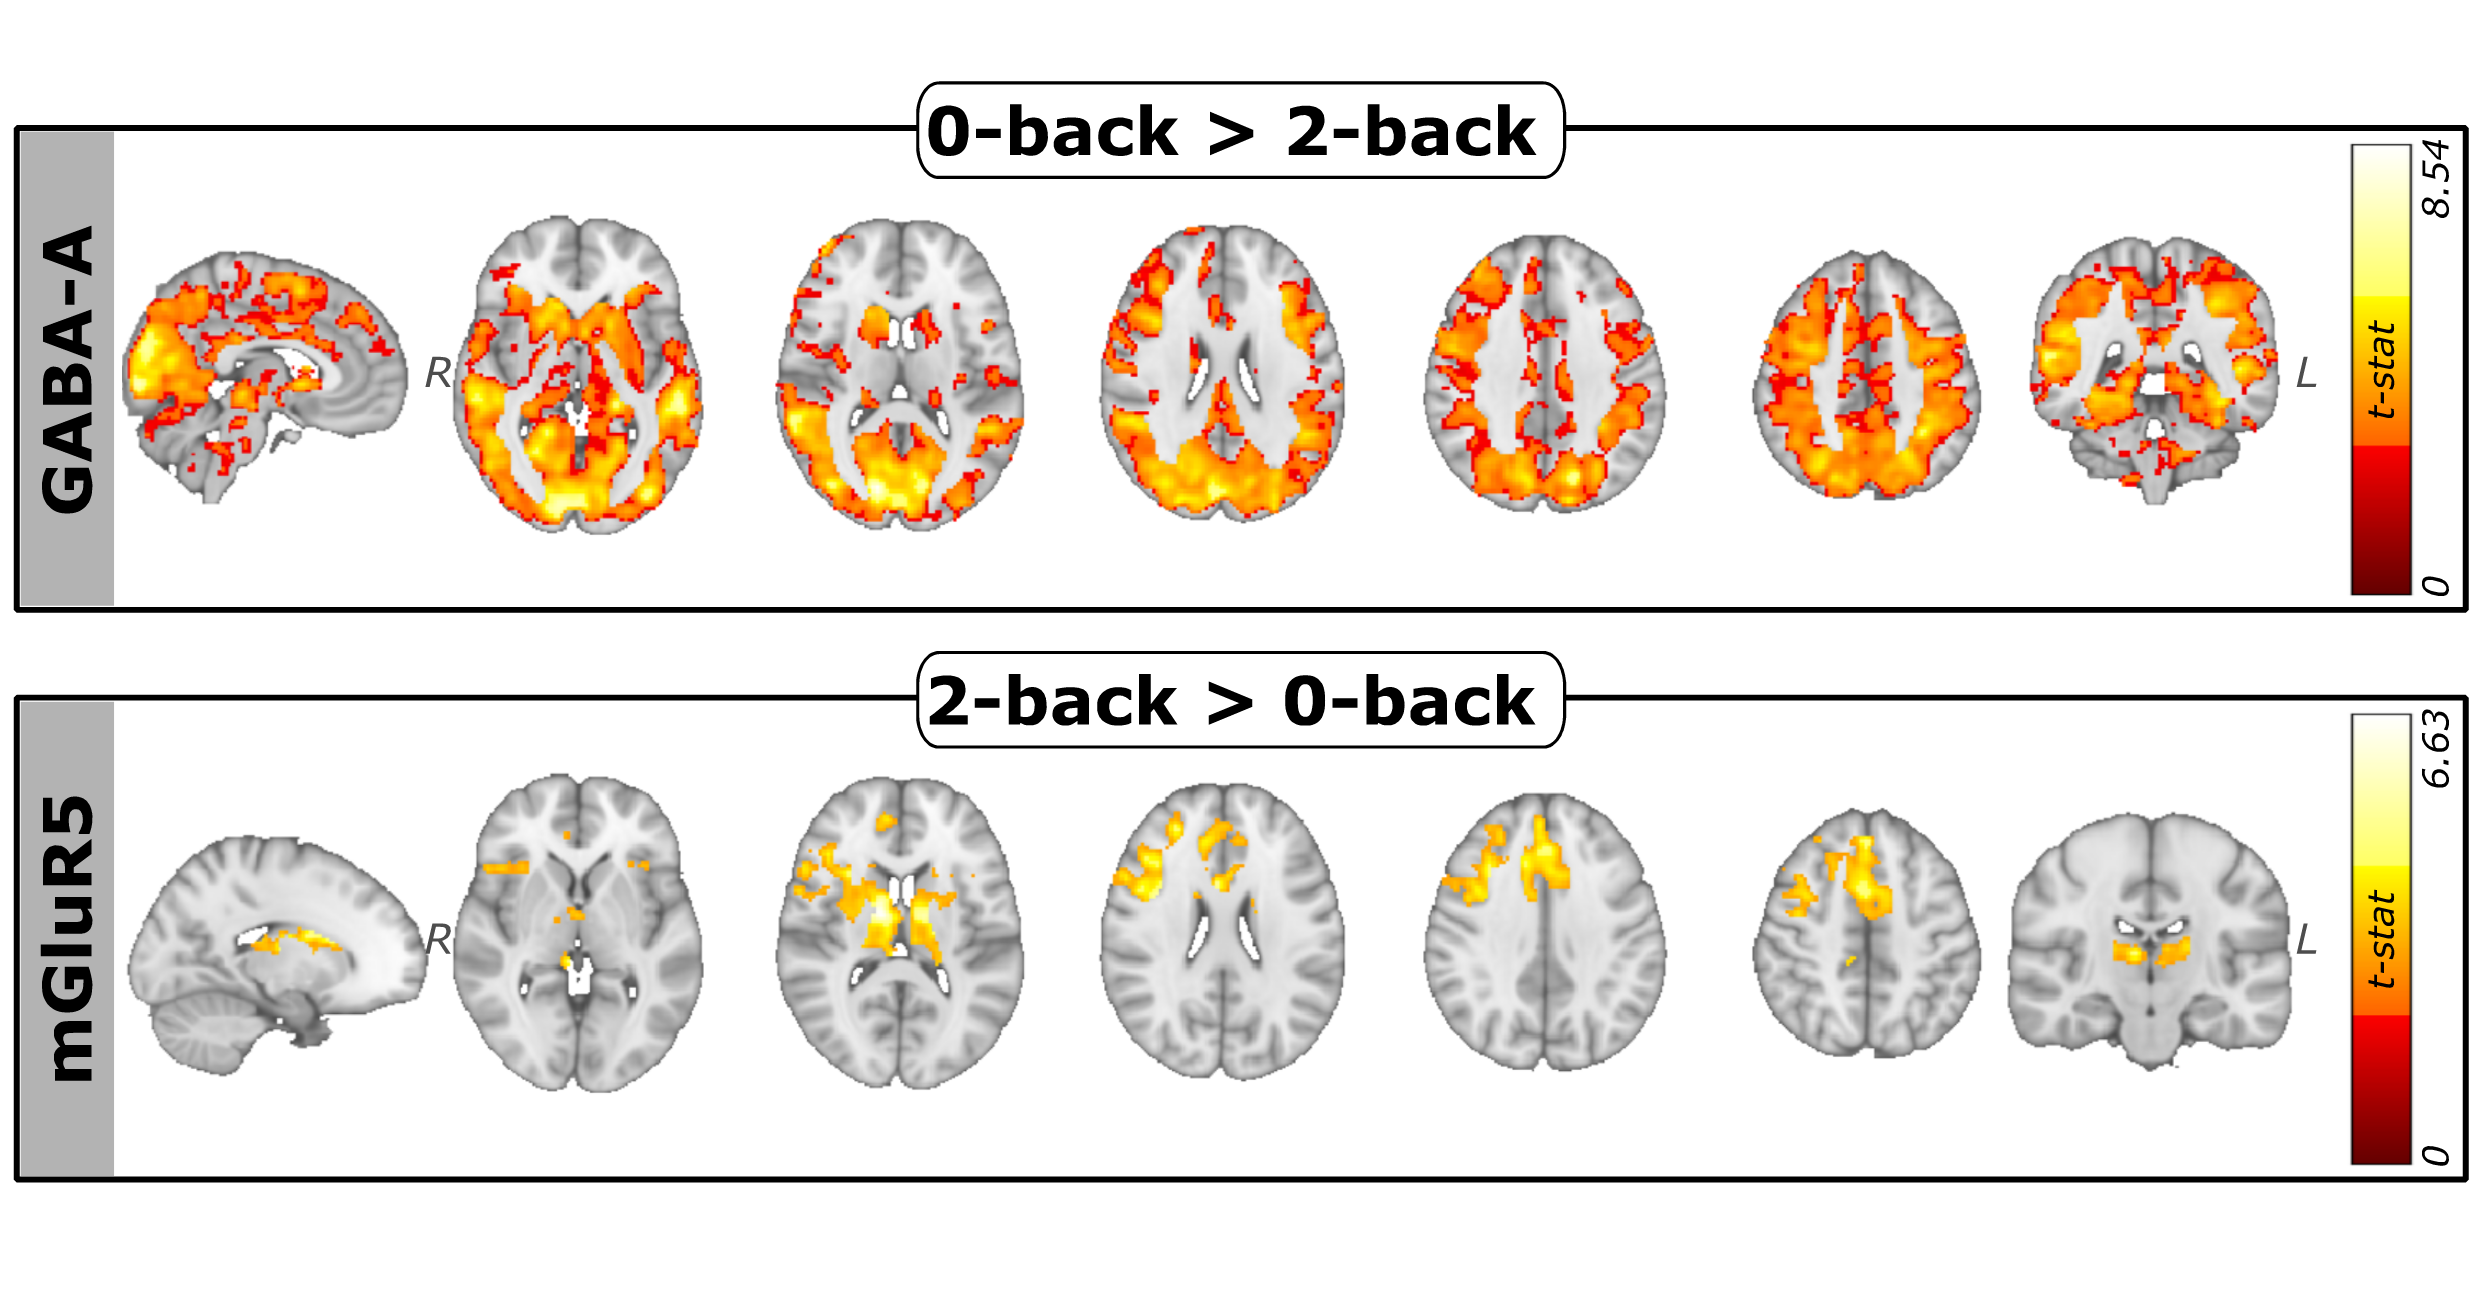
Task accuracy decreased with increasing cognitive load, showing a significant difference between the 0-back and 2-back runs (p-value<.001). Mean RTs significantly increased (p-values<.001) between 0-back and 1-back, 1-back and 2-back, 0-back and 2-back runs (Fig.2). At the network level, GABA-A-enriched FC showed a significant decrease with increasing cognitive load (False Discovery Rate (FDR)-corrected p-values<.01) in all networks except the Limbic network (Fig.3). Instead, for the mGluR5-enriched FC we found significant differences within all the networks (FDR-corrected p-values<.05) (Fig.4). For the GABA-A-enriched FC, significant differences were found in the comparison 0-back>2-back (Fig.5). The significant clusters were located mainly in the Visual (28.6%), Dorsal Attention (18.1%) and DMN (17.5%) networks. For the mGluR5-enriched FC, contrast 2-back>0-back showed significant differences (Fig.5), mostly located in the Control (35.9%) and Salience (27.9%) networks.Discussion
In line with previous N-back task studies12,13, we observed increased RTs and decreased accuracy with increasing WM load. At the network level, GABA-A-enriched FC gradually decreased with higher cognitive load, suggesting that GABA-A neurotransmission is involved in the initial engagement of cognitive resources, but becomes less prominent with increasing task demands, as previously reported in MRS studies4. Conversely, mGluR5-enriched FC showed an upward trend with cognitive load across all networks. Focusing on Control and Salience networks, our findings expand previous studies reporting increased glutamate levels in the dlPFC during WM5, indicating enhanced excitatory neurotransmission during cognitive engagement. Additionally, the comparison between 0-back and 2-back enriched-FC maps pointed out that GABA-A-enriched FC is pronounced mostly in networks associated with information maintenance, as previous fMRI studies show14. In contrast, mGluR5-enriched FC is concentrated in networks implicated in updating processes and, specifically, in the frontopolar cortex, in agreement with the fMRI literature15.Conclusion
We applied, for the first time in the literature, the REACT framework on N-back fMRI data, revealing increased mGluR5-enriched and decreased GABA-A-enriched FC in the Control and Salience networks. Our work highlights the value of integrating multimodal neuroimaging to better comprehend WM processes. Furthermore, it provides a novel approach to explore disorders associated with WM deficits like Attention Deficit Hyperactivity Disorder16, Alzheimer's Disease17 or Schizophrenia18 focusing on the neurotransmitter systems impacted by the condition or implicated in drug treatments.Acknowledgements
This project was supported by the Autonomous Province of Trento, Italy (Project: “NeuSurPlan and integrated approach to neurosurgery planning based on multimodal data") and the Dipartimento di Eccellenza project 2018-2022 (Italian Ministry of Education, University and Research).References
- Aalto, S., Brück, A., Laine, M., Någren, K., & Rinne, J. O. (2005). Frontal and temporal dopamine release during working memory and attention tasks in healthy humans: a positron emission tomography study using the high-affinity dopamine D2 receptor ligand [11C] FLB 457. Journal of Neuroscience, 25(10), 2471-2477.
- Marsman, A., Mandl, R. C., Klomp, D. W., Cahn, W., Kahn, R. S., Luijten, P. R., & Hulshoff Pol, H. E. (2017). Intelligence and brain efficiency: investigating the association between working memory performance, glutamate, and GABA. Frontiers in Psychiatry, 8, 154.
- Dipasquale, O., Selvaggi, T., Veronese, M., Gabay, S. A., Turkheimer, F. and Mehta, A.M. (2019). Receptor-Enriched Analysis of functional connectivity by targets (REACT): A novel, multimodal analytical approach informed by PET to study the pharmacodynamic response of the brain under MDMA. NeuroImage, vol. 195, pp. 252–260, 2019.
- Michels, L., Martin, E., Klaver, P., Edden, R., Zelaya, F., Lythgoe, D. J., ... & O’Gorman, R. L. (2012). Frontal GABA levels change during working memory. PloS one, 7(4), e31933.
- Woodcock, E. A., Anand, C., Khatib, D., Diwadkar, V. A., & Stanley, J. A. (2018). Working memory modulates glutamate levels in the dorsolateral prefrontal cortex during 1H fMRS. Frontiers in psychiatry, 9, 66.
- Zacharopoulos, G., & Cohen, R. K. (2021). Predicting working memory capacity based on glutamatergic concentration and its modulation of functional connectivity. Neuroscience, 457, 12-19.
- Nørgaard, M., Beliveau, V., Ganz, M., Svarer, C., Pinborg, L. H., Keller, S. H., ... & Knudsen, G. M. (2021). A high-resolution in vivo atlas of the human brain's benzodiazepine binding site of GABAA receptors. NeuroImage, 232, 117878.
- DuBois, J. M., Rousset, O. G., Rowley, J., Porras-Betancourt, M., Reader, A. J., Labbe, A., ... & Kobayashi, E. (2016). Characterization of age/sex and the regional distribution of mGluR5 availability in the healthy human brain measured by high-resolution [11C] ABP688 PET. European journal of nuclear medicine and molecular imaging, 43(1), 152-162.
- Schaefer, A., Kong, R., Gordon, E. M., Laumann, T. O., Zuo, X. N., Holmes, A. J., ... & Yeo, B. T. (2018). Local-global parcellation of the human cerebral cortex from intrinsic functional connectivity MRI. Cerebral cortex, 28(9), 3095-3114.
- Winkler, A. M., Ridgway, G. R., Webster, M. A., Smith, S. M., & Nichols, T. E. (2014). Permutation inference for the general linear model. Neuroimage, 92, 381-397.
- Anderson, M. J., & Robinson, J. (2001). Permutation tests for linear models. Australian & New Zealand Journal of Statistics, 43(1), 75-88.
- Lamichhane, B., Westbrook, A., Cole, M. W., & Braver, T. S. (2020). Exploring brain-behavior relationships in the N-back task. NeuroImage, 212, 116683.
- Piccoli, T., Valente, G., Linden, D. E., Re, M., Esposito, F., Sack, A. T., ... & Bergsland, N. (2015). The default mode network and the working memory network are not anti-correlated during all phases of a working memory task. PloS One, 10(3), e0123354.
- Lee, S. H., & Baker, C. I. (2016). Multi-voxel decoding and the topography of maintained information during visual working memory. Frontiers in systems neuroscience, 10, 2.
- Collette, F., & Van der Linden, M. (2002). Brain imaging of the central executive component of working memory. Neuroscience & Biobehavioral Reviews, 26(2), 105-125.
- Martinussen, R., Hayden, J., Hogg-Johnson, S., & Tannock, R. (2005). A meta-analysis of working memory impairments in children with attention-deficit/hyperactivity disorder. Journal of the American Academy of Child & Adolescent Psychiatry, 44(4), 377-384.
- Belleville, S., Chertkow, H., & Gauthier, S. (2007). Working memory and control of attention in persons with Alzheimer's disease and mild cognitive impairment. Neuropsychology, 21(4), 458-469.
- Barch, D. M., & Ceaser, A. (2012). Cognition in schizophrenia: Core psychological and neural mechanisms. Trends in Cognitive Sciences, 16(1), 27-34.
Figures