0325
Model-free detection of task-evoked neural activity in the whole brain with structurally constrained synchronization of fMRI signals1Department of Radiology and Huaxi MR Research Center (HMRRC), Functional and Molecular Imaging Key Laboratory of Sichuan Province, West China Hospital, Sichuan University, Chengdu, Sichuan, China, 2Research Unit of Psychoradiology, Chinese Academy of Medical Sciences, Chengdu, Sichuan, China, 3College of Electronic Engineering, Chengdu University of Information Technology, Chengdu, Sichuan, China, 4MR Research Collaborations, Siemens Healthineers Ltd., Chengdu, China
Synopsis
Keywords: Task/Intervention Based fMRI, Data Analysis, activation mapping
Motivation: The nonlinear nature of neurovascular coupling and background brain activities that are unrelated to extrinsic stimuli in tasks could result in an inadequate mapping of the task-evoked brain activations with the conventional-GLM in fMRI.
Goal(s): The aim of this study is to propose a new approach to map task-evoked brain activation without the linear assumption.
Approach: we proposed a model-free approach to map task-evoked activation in the whole brain by measuring increases in BOLD signal synchronization within anatomical structures.
Results: Compared to the GLM approach, the model-free approach could detect regions of brain activations beyond the conventional-GLM's characterization, especially in the white matter.
Impact: The model-free approach detects task-evoked brain activations by measuring changes in BOLD signal synchronization within local anatomical structures, which is expected to serve as a standardized tool to measure neural activities with nonlinear hemodynamic responses.
Introdction
Functional MRI (fMRI) has been widely used for detecting task-evoked neural activations in the human brain with a general linear model1, in which fMRI signals are usually modeled by linear superposition of hemodynamic responses of the neural activities. However, an increasing body of evidence2,3,4 demonstrates that the nonlinear nature of neurovascular coupling and background brain activities that are unrelated to extrinsic stimuli in tasks could result in an inadequate mapping of the task-evoked activations in the brain. Hence, we proposed a model-free approach to map task-evoked activation in the whole brain using structurally constrained synchronization of fMRI signals.Method
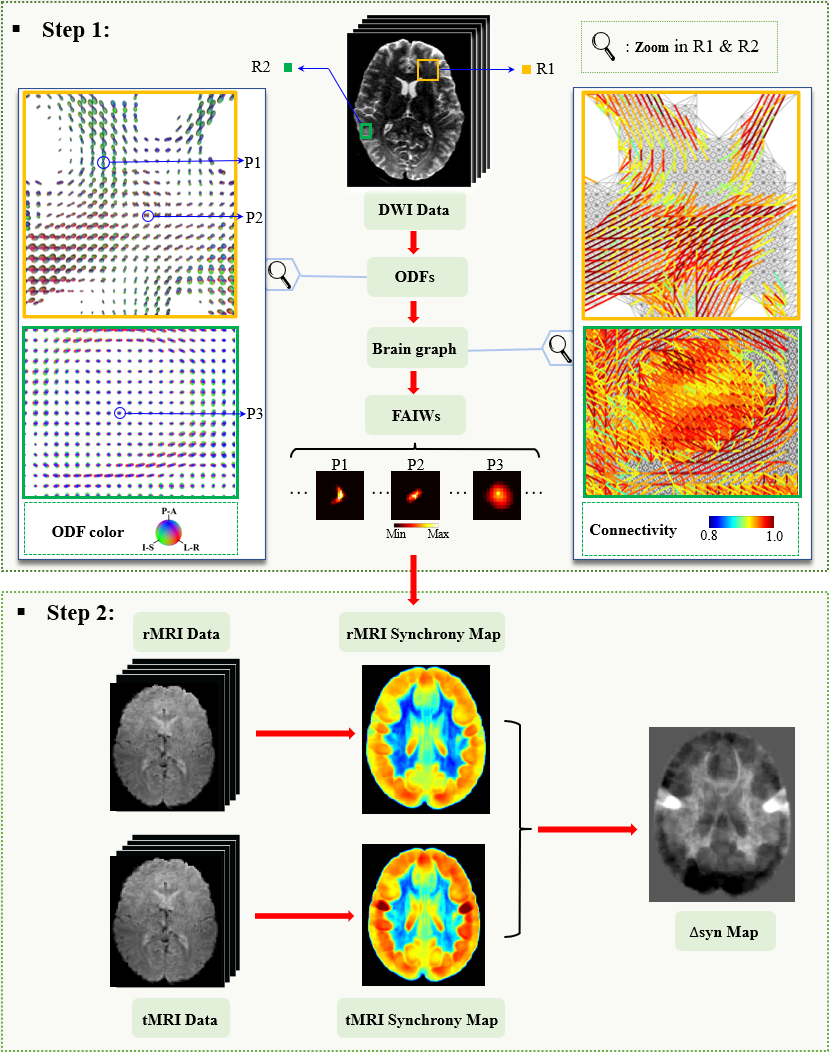
Algorithm of WM activation mappingThe algorithm of the proposed approach included two major steps, which were implemented on a voxel-by-voxel basis (Figure 1). In the first step, the fiber-architecture-informed spatial window5 was created for each voxel using orientation distribution functions (ODFs) constructed from HARDI data. Specifically, a subject-specific voxel-wise graph was first constructed using ODFs, where the weight of the connection between two neighboring voxels was determined by the coherence of diffusion orientations. Then, a weighted spatial window was generated for each voxel by simulating heat diffusion on the fiber-architecture-informed graph with a point heat source located at the vertex. In the second step, a modified principal component analysis6 (PCA) was used to analyze fMRI time courses within the spatial window obtained from the first step, where the largest eigenvalue of PCA measured the synchrony of time courses. The differences in synchrony maps between the resting state and task-loading state were analyzed with a one-sample t-test to show the activations at a group level, which were further compared with the activation maps obtained by the GLM method.
Validation of WM activation mapping on in vivo data
A subset of 80 subjects sourced from the WU-Minn Human Connectome Project (HCP) database was used to validate the proposed method. The datasets were downloaded from the minimally preprocessed7 data in the HCP repository, which included7 imaging sessions: resting-state, motor-task, language-task, emotion-task, and working memory-task fMRI, T1-weighted MRI and diffusion-weighted MRI (i.e. HARDI).
Results
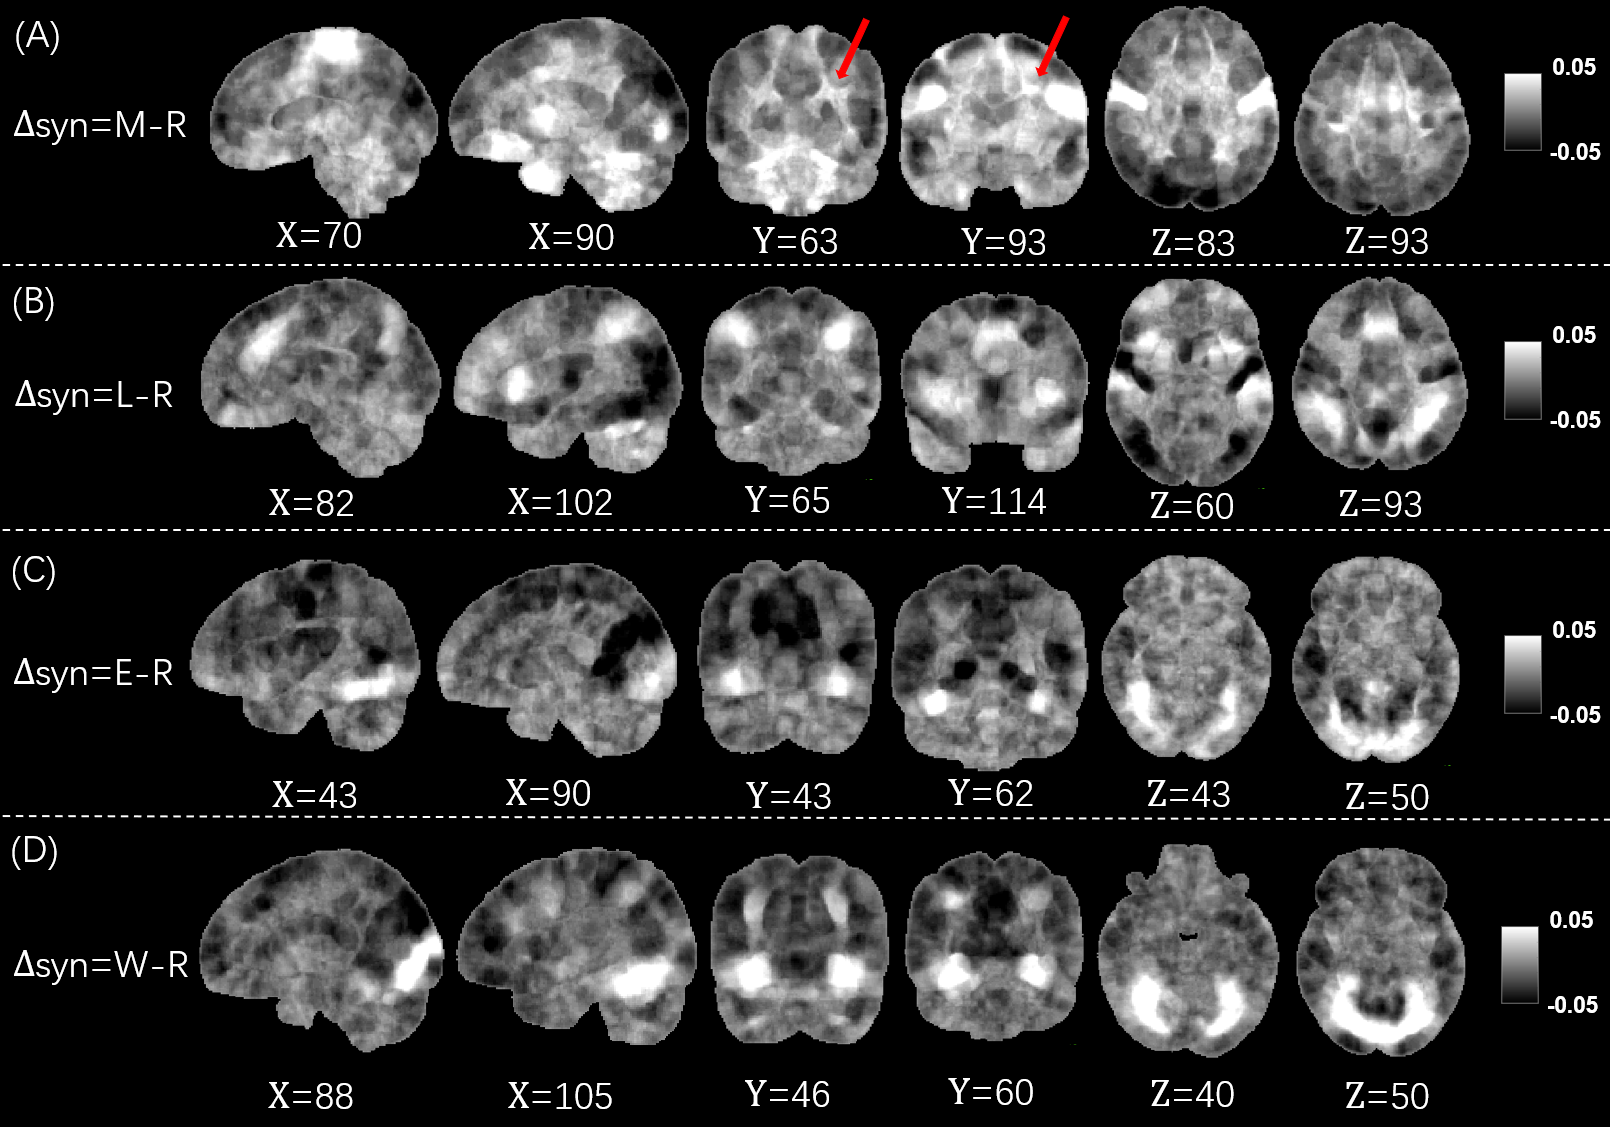
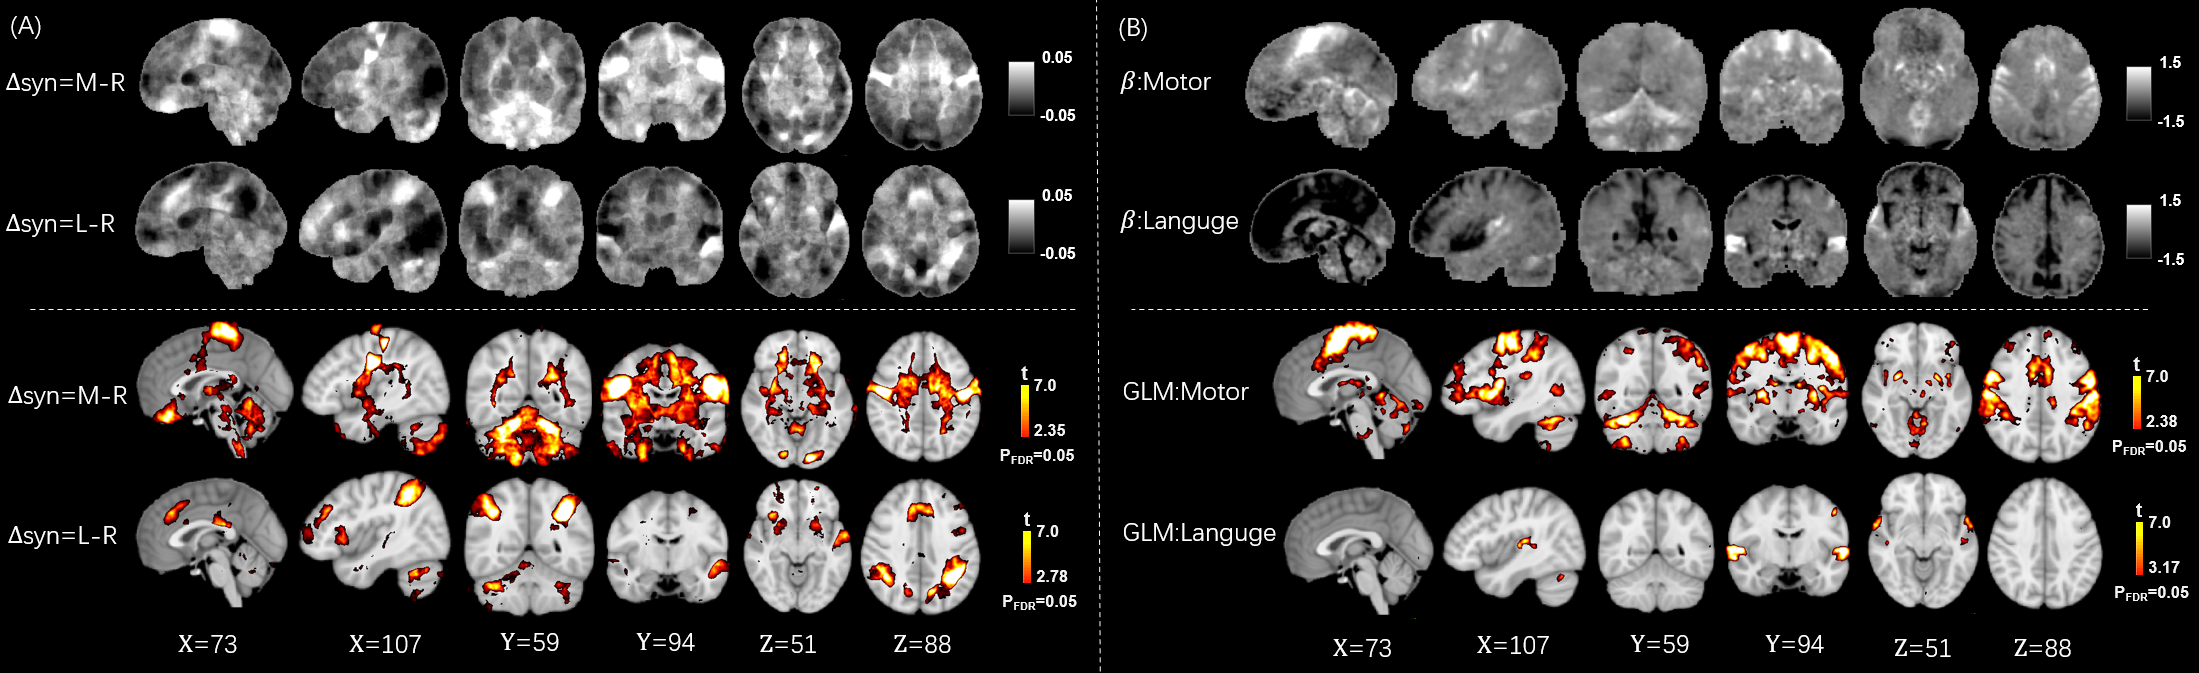
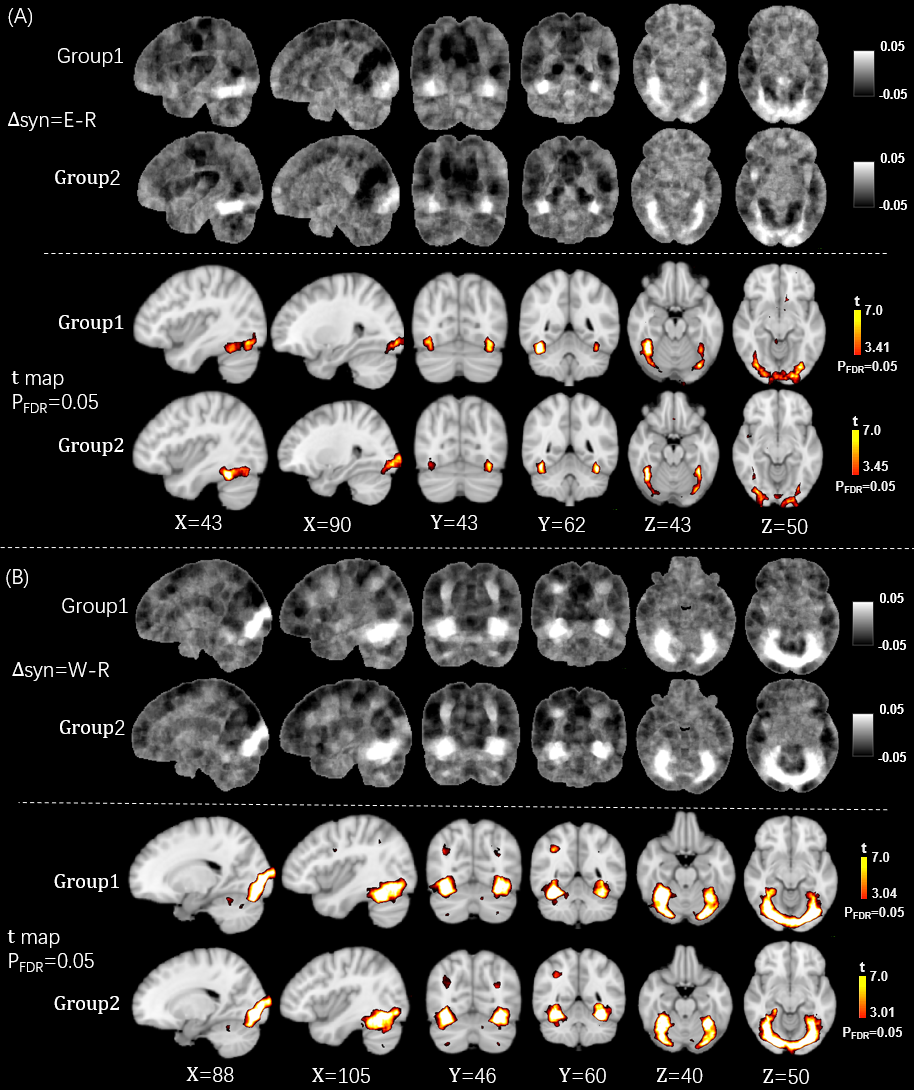
The synchronization differences between the four task-state fMRIs and resting-state fMRI detected by our purposed model-free approach are illustrated in Figure 2. Our observations revealed that the cortical activation regions involved in motor tasks engaging the feet, hands, and tongue display spatial profiles consistent with previous studies8, as demonstrated in Figure 2A. Regarding the language-task, our proposed method captured the activation in the ventrolateral prefrontal cortex as well as in the superior and inferior temporal cortex (including bilateral anterior temporal poles) (Fig. 2B). Additionally, strong bilateral activations were observed in the amygdala, extending into the hippocampus, and in the medial orbito-lateral nucleus lateralis frontalis cortex during the emotional task (Fig. 2C). Visual areas, notably including the pallidal face area, display extensive activation, consistent with the use of fearful facial stimuli. Lastly, in the working memory task, our proposed method effectively depicted the activation associated with the cognitive control network, including the bilateral dorsal nucleus ventral prefrontal cortex and visual areas (Fig. 2D).The outcomes obtained through the proposed model-free method were compared with those generated by the GLM method. In motor and language tasks, our model-free approach not only identified activation regions revealed by the GLM method, but also surpassed the GLM method by revealing additional regions that the GLM failed to detect. Additionally, it effectively identified white matter fiber bundles associated with task-engaged cortical areas (Fig. 3). Figure 4 exhibits the difference maps for the emotion and working memory tasks, along with the corresponding t-value maps, effectively demonstrating the reproducibility and robustness of our method.
Discussion
In this study, signal changes associated with white matter neural activity were detected by measuring the enhancement of white matter BOLD signal synchronization under a functional task. By comparing group-averaged synchronization maps derived from resting-state and task fMRI data, we demonstrate that task load can enhance the synchronization of BOLD signals in both white and gray matter (Figs. 2-4). Compared to GLM, our method detects regions that cannot be detected by GLM, suggesting that the brain's response to neural activities involves complex nonlinear hemodynamics beyond the conventional GLM's characterization.Conclusion
We propose a model-free approach to detect changes in brain task-evoked signals by measuring variations in BOLD signal synchronization within local fiber structures. This approach is expected to provide a powerful tool to detect nonlinear hemodynamic responses to neural activities.Acknowledgements
No acknowledgement found.References
1. Poline, J. B., & Brett, M. (2012). The general linear model and fMRI: does love last forever?. Neuroimage, 62(2), 871-880.
2. Li, M., Newton, A. T., Anderson, A. W., Ding, Z., & Gore, J. C. (2019). Characterization of the hemodynamic response function in white matter tracts for event-related fMRI. Nature communications, 10(1), 1140.
3. Courtemanche, M. J., Sparrey, C. J., Song, X., MacKay, A., & D'Arcy, R. C. (2018). Detecting white matter activity using conventional 3 Tesla fMRI: An evaluation of standard field strength and hemodynamic response function. Neuroimage, 169, 145-150.
4. Polimeni, J. R., & Lewis, L. D. (2021). Imaging faster neural dynamics with fast fMRI: a need for updated models of the hemodynamic response. Progress in neurobiology, 207, 102174.
5. Abramian, D., Larsson, M., Eklund, A., Aganj, I., Westin, C. F., & Behjat, H. (2021). Diffusion-informed spatial smoothing of fMRI data in white matter using spectral graph filters. Neuroimage, 237, 118095.
6. Zhao, Y., Gao, Y., Zu, Z., Li, M., Schilling, K. G., Anderson, A. W., ... & Gore, J. C. (2022). Detection of functional activity in brain white matter using fiber architecture informed synchrony mapping. Neuroimage, 258, 119399.
7. Glasser, M. F., Sotiropoulos, S. N., Wilson, J. A., Coalson, T. S., Fischl, B., Andersson, J. L., ... & Wu-Minn HCP Consortium. (2013). The minimal preprocessing pipelines for the Human Connectome Project. Neuroimage, 80, 105-124.
8. Barch, D. M., Burgess, G. C., Harms, M. P., Petersen, S. E., Schlaggar, B. L., Corbetta, M., ... & Van Essen, D. C. (2013). Function in the human connectome: task-fMRI and individual differences in behavior. Neuroimage, 80, 169-189.
Figures