0324
Understanding signal specificity in fMRI: bSSFP vs. GRE-EPI signal dependence on cortical orientation to B0 at 9.4 Tesla1High-Field Magnetic Resonance, Max Planck Institute for Biological Cybernetics, Tübingen, Germany, 2Department of Biomedical Magnetic Resonance, University of Tübingen, Tübingen, Germany, 3German Center for Neurodegenerative Diseases (DZNE), Bonn, Germany
Synopsis
Keywords: fMRI Analysis, fMRI (resting state), High-Field MRI
Motivation: GRE-EPI, the most widely used sequence for BOLD fMRI, is highly biased towards large draining veins that follow the cortical curvature and influence the surrounding magnetic field in an orientation-dependent manner increasing with field strength.
Goal(s): This work aims to investigate large vein biases resulting in cortical orientation-dependent signal variations in GRE-EPI and bSSFP resting-state fMRI signals.
Approach: We compared 2D and 3D GRE-EPI with 3D bSSFP rs-fMRI signal fluctuations in their dependence on the cortical orientation to B0 in five subjects at 9.4 Tesla.
Results: Unlike GRE-EPI, intra- and inter-subject comparisons revealed no dependence of bSSFP on the cortical orientation to B0.
Impact: Fluctuations in the GRE-EPI signal are highly dependent on the cortical orientation and depth. This was not observed with bSSFP, demonstrating the potentially higher specificity of bSSFP for smaller veins, closer to brain activation at field strengths ≥ 7 Tesla.
Introduction
Veins filled with paramagnetic deoxygenated blood introduce perturbations to the magnetic field of the surrounding tissue, which are highest when perpendicular to the main axis of B01 and increase with increasing field strengths. Large vessels are assumed to follow the cortical curvature, while smaller vessels are oriented randomly. Therefore, the cortical orientation to B0 is considered a valid estimate for the large vessel orientation to B02,3.Gradient echo (GRE) echo-planar imaging (EPI) is known to be sensitive to large draining veins, which is considered a drawback due to the distance from the capillary bed and thus the low specificity of the signal4,5. Previous work has shown the strong cortical orientation dependence of 2D simultaneous multi-slice (SMS) GRE-EPI3, and preliminary results have shown the dependence of 3D GRE-EPI and balanced steady-state free precession (bSSFP) on the cortical orientation in two subjects6. Aiming to understand the signal specificity of bSSFP, we compare all three sequences in their signal dependence on cortical orientation to B0 in five additional subjects.
Materials & Methods
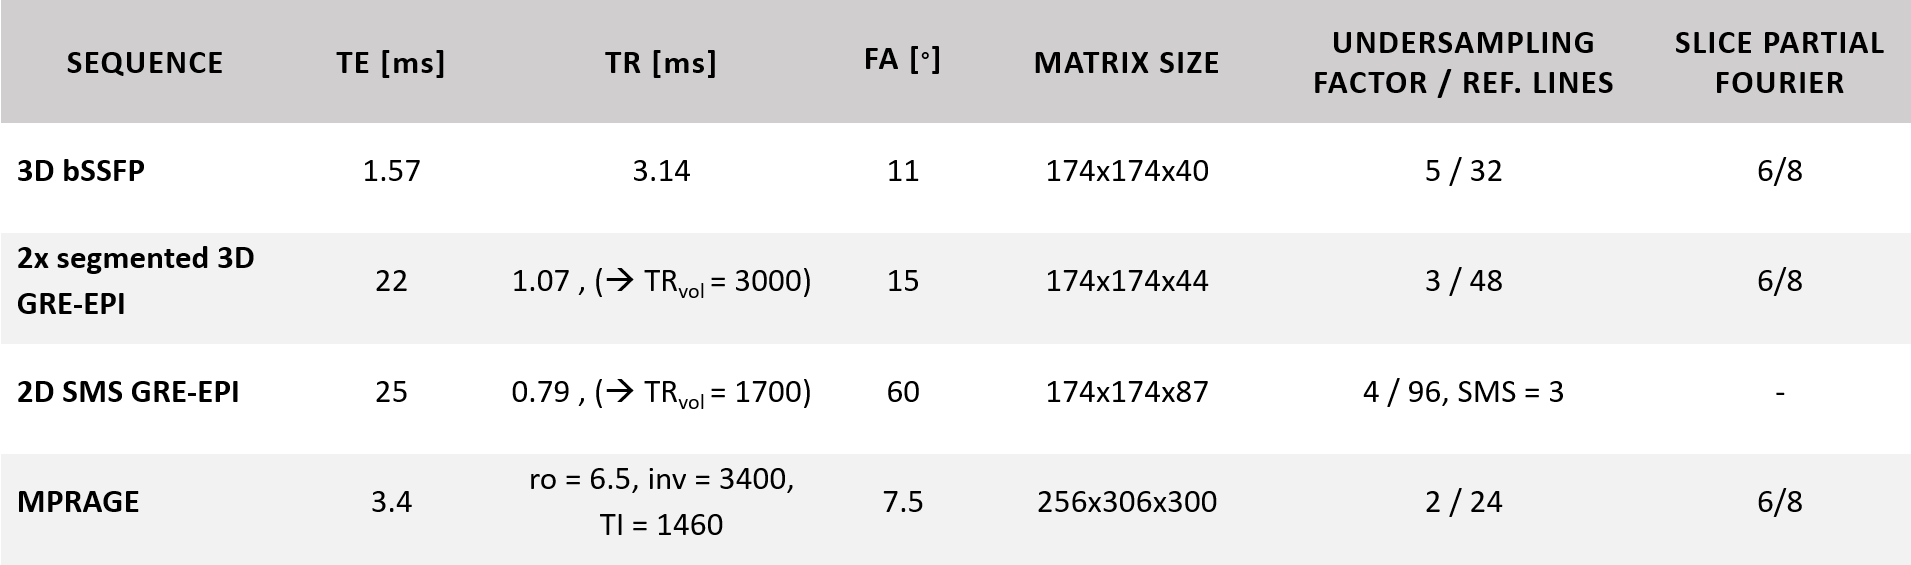
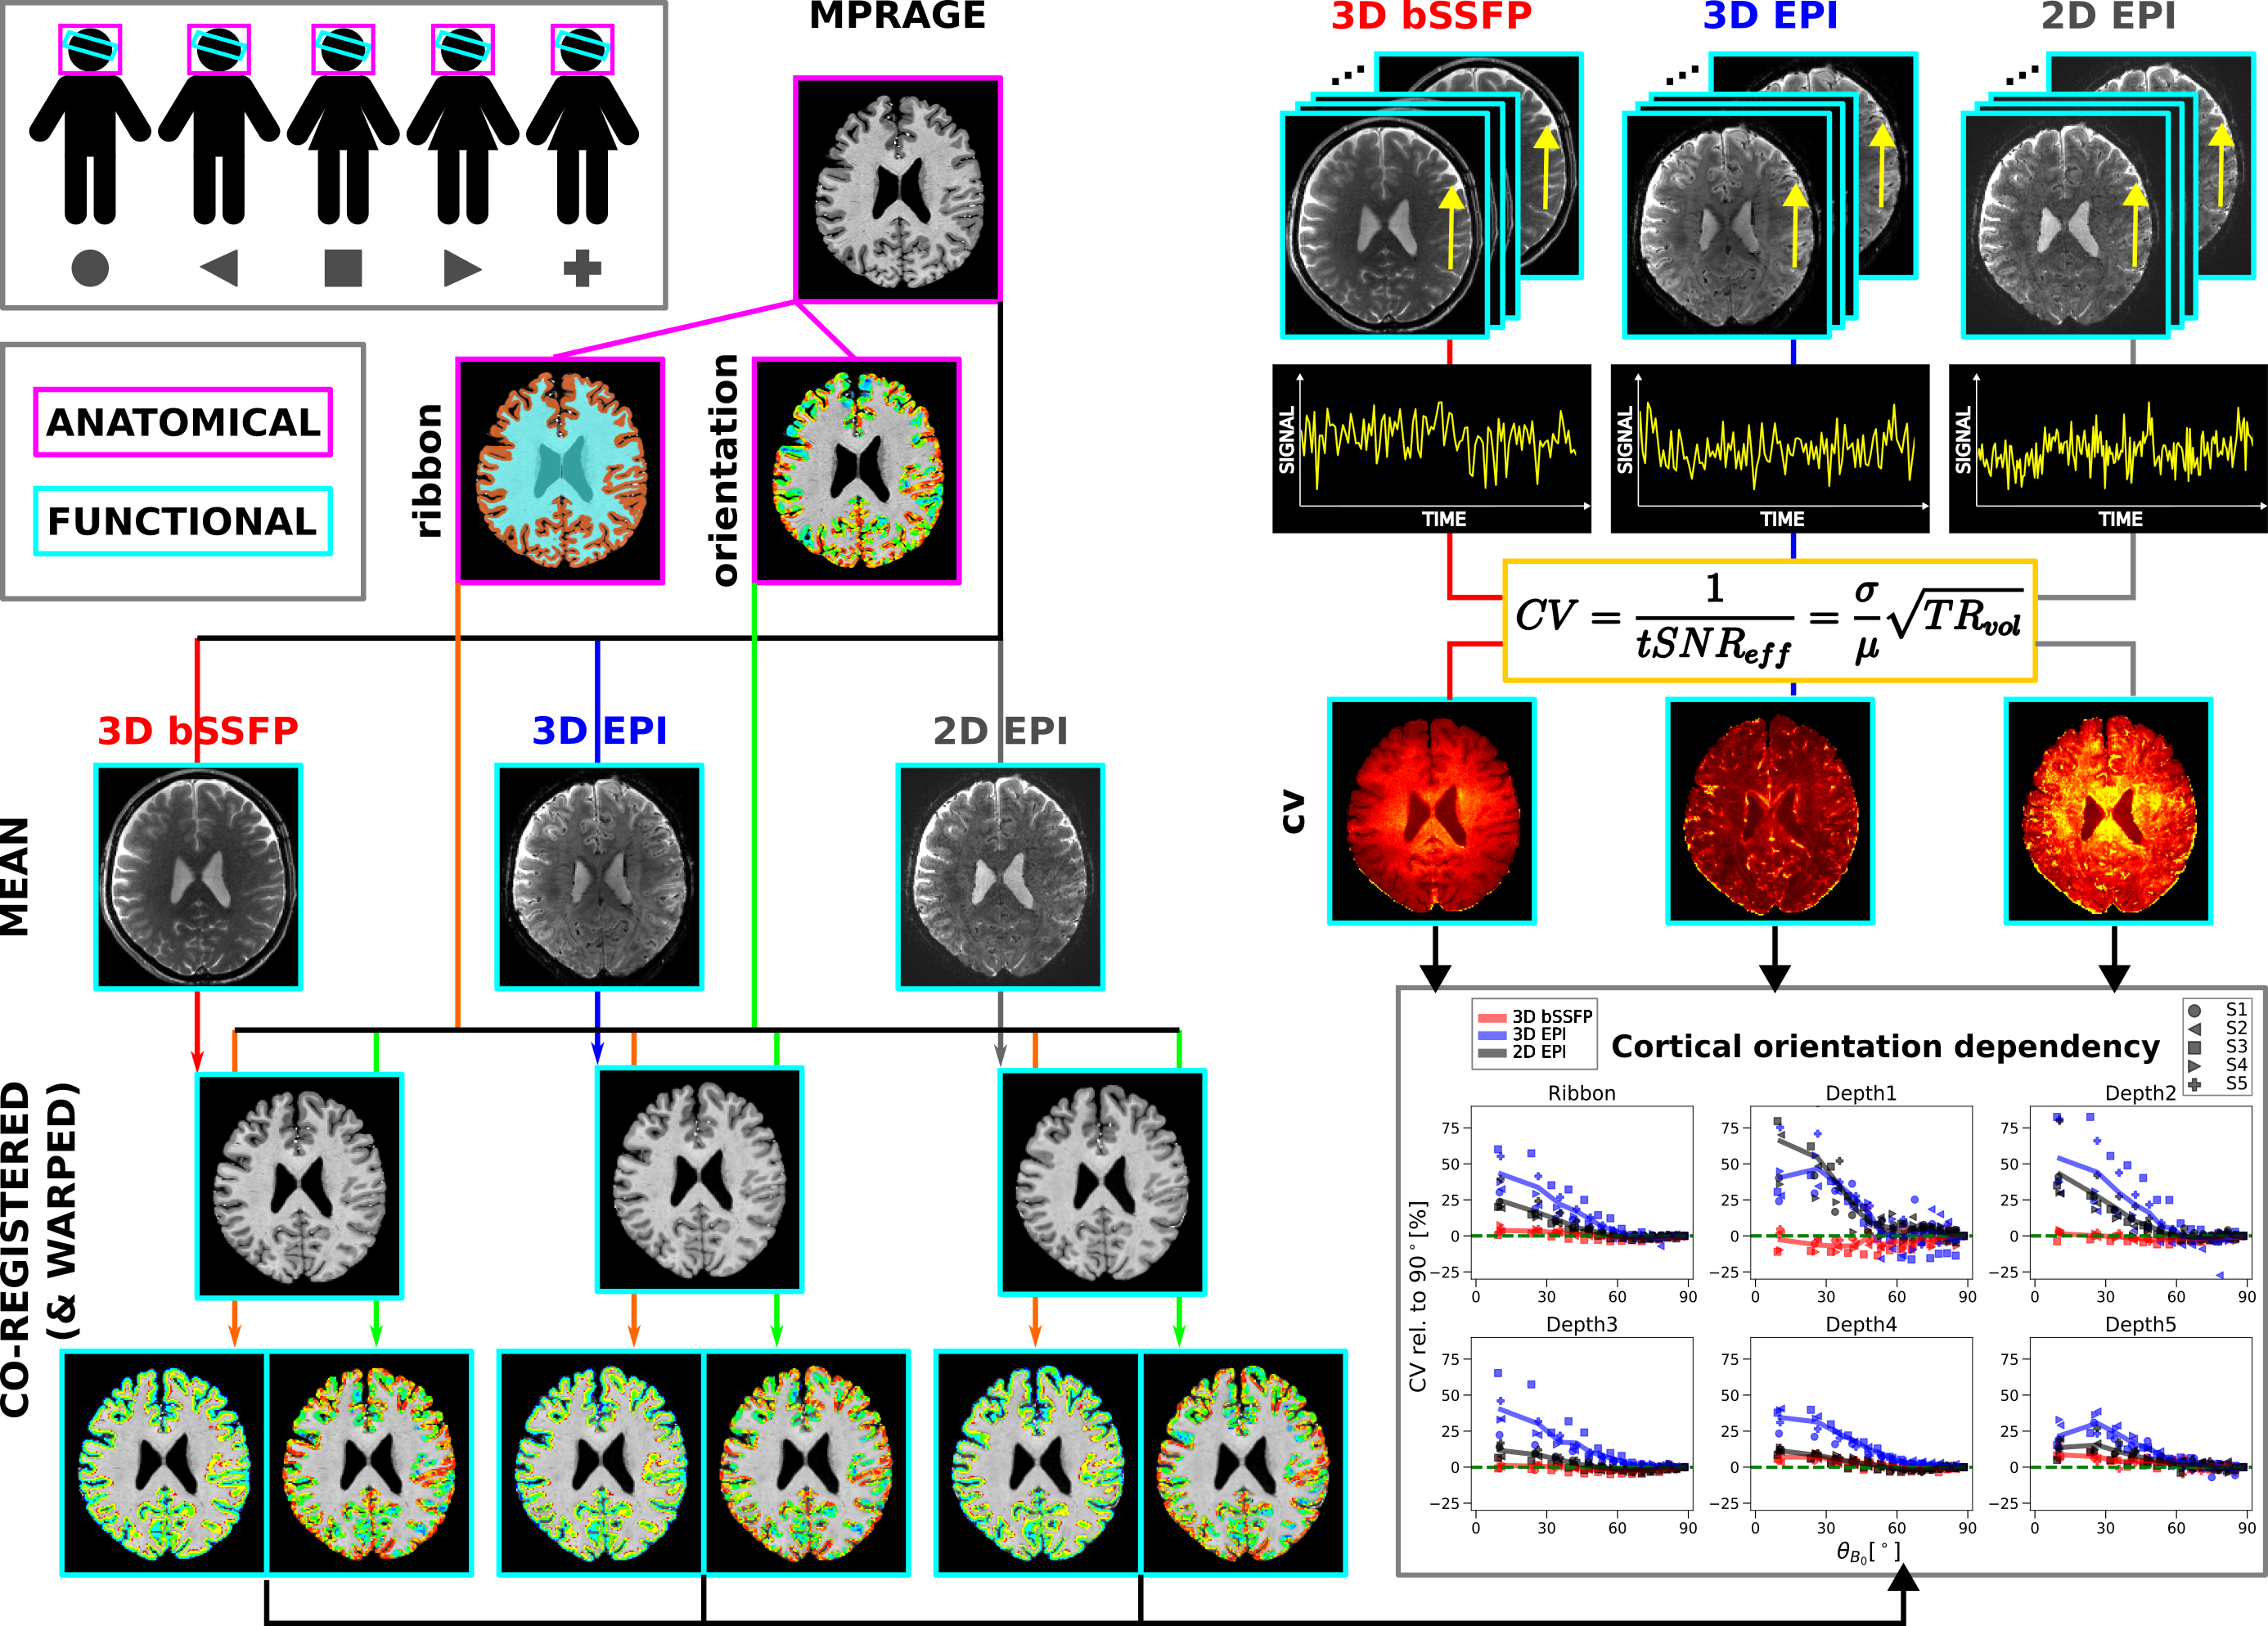
Data acquisitionA graphical overview of the methods is shown in Figure 1. Resting-state fMRI data were collected from five subjects at a whole-body 9.4T MRI scanner with a 16Tx/31Rx coil7 after informed consent. Four runs of 112 frames of 3D bSSFP8 and segmented 3D GRE-EPI9 and one run of 197 frames of 2D SMS GRE-EPI were acquired with 1.1mm isotropic resolution. The volume TR (TRvol) was kept at 3000ms/1700ms for the 3D/2D sequences, respectively. A T1-weighted MPRAGE was acquired with 0.7mm isotropic resolution using a universal pulse for excitation10. Acquisition parameters are shown in Table 1.
Analysis
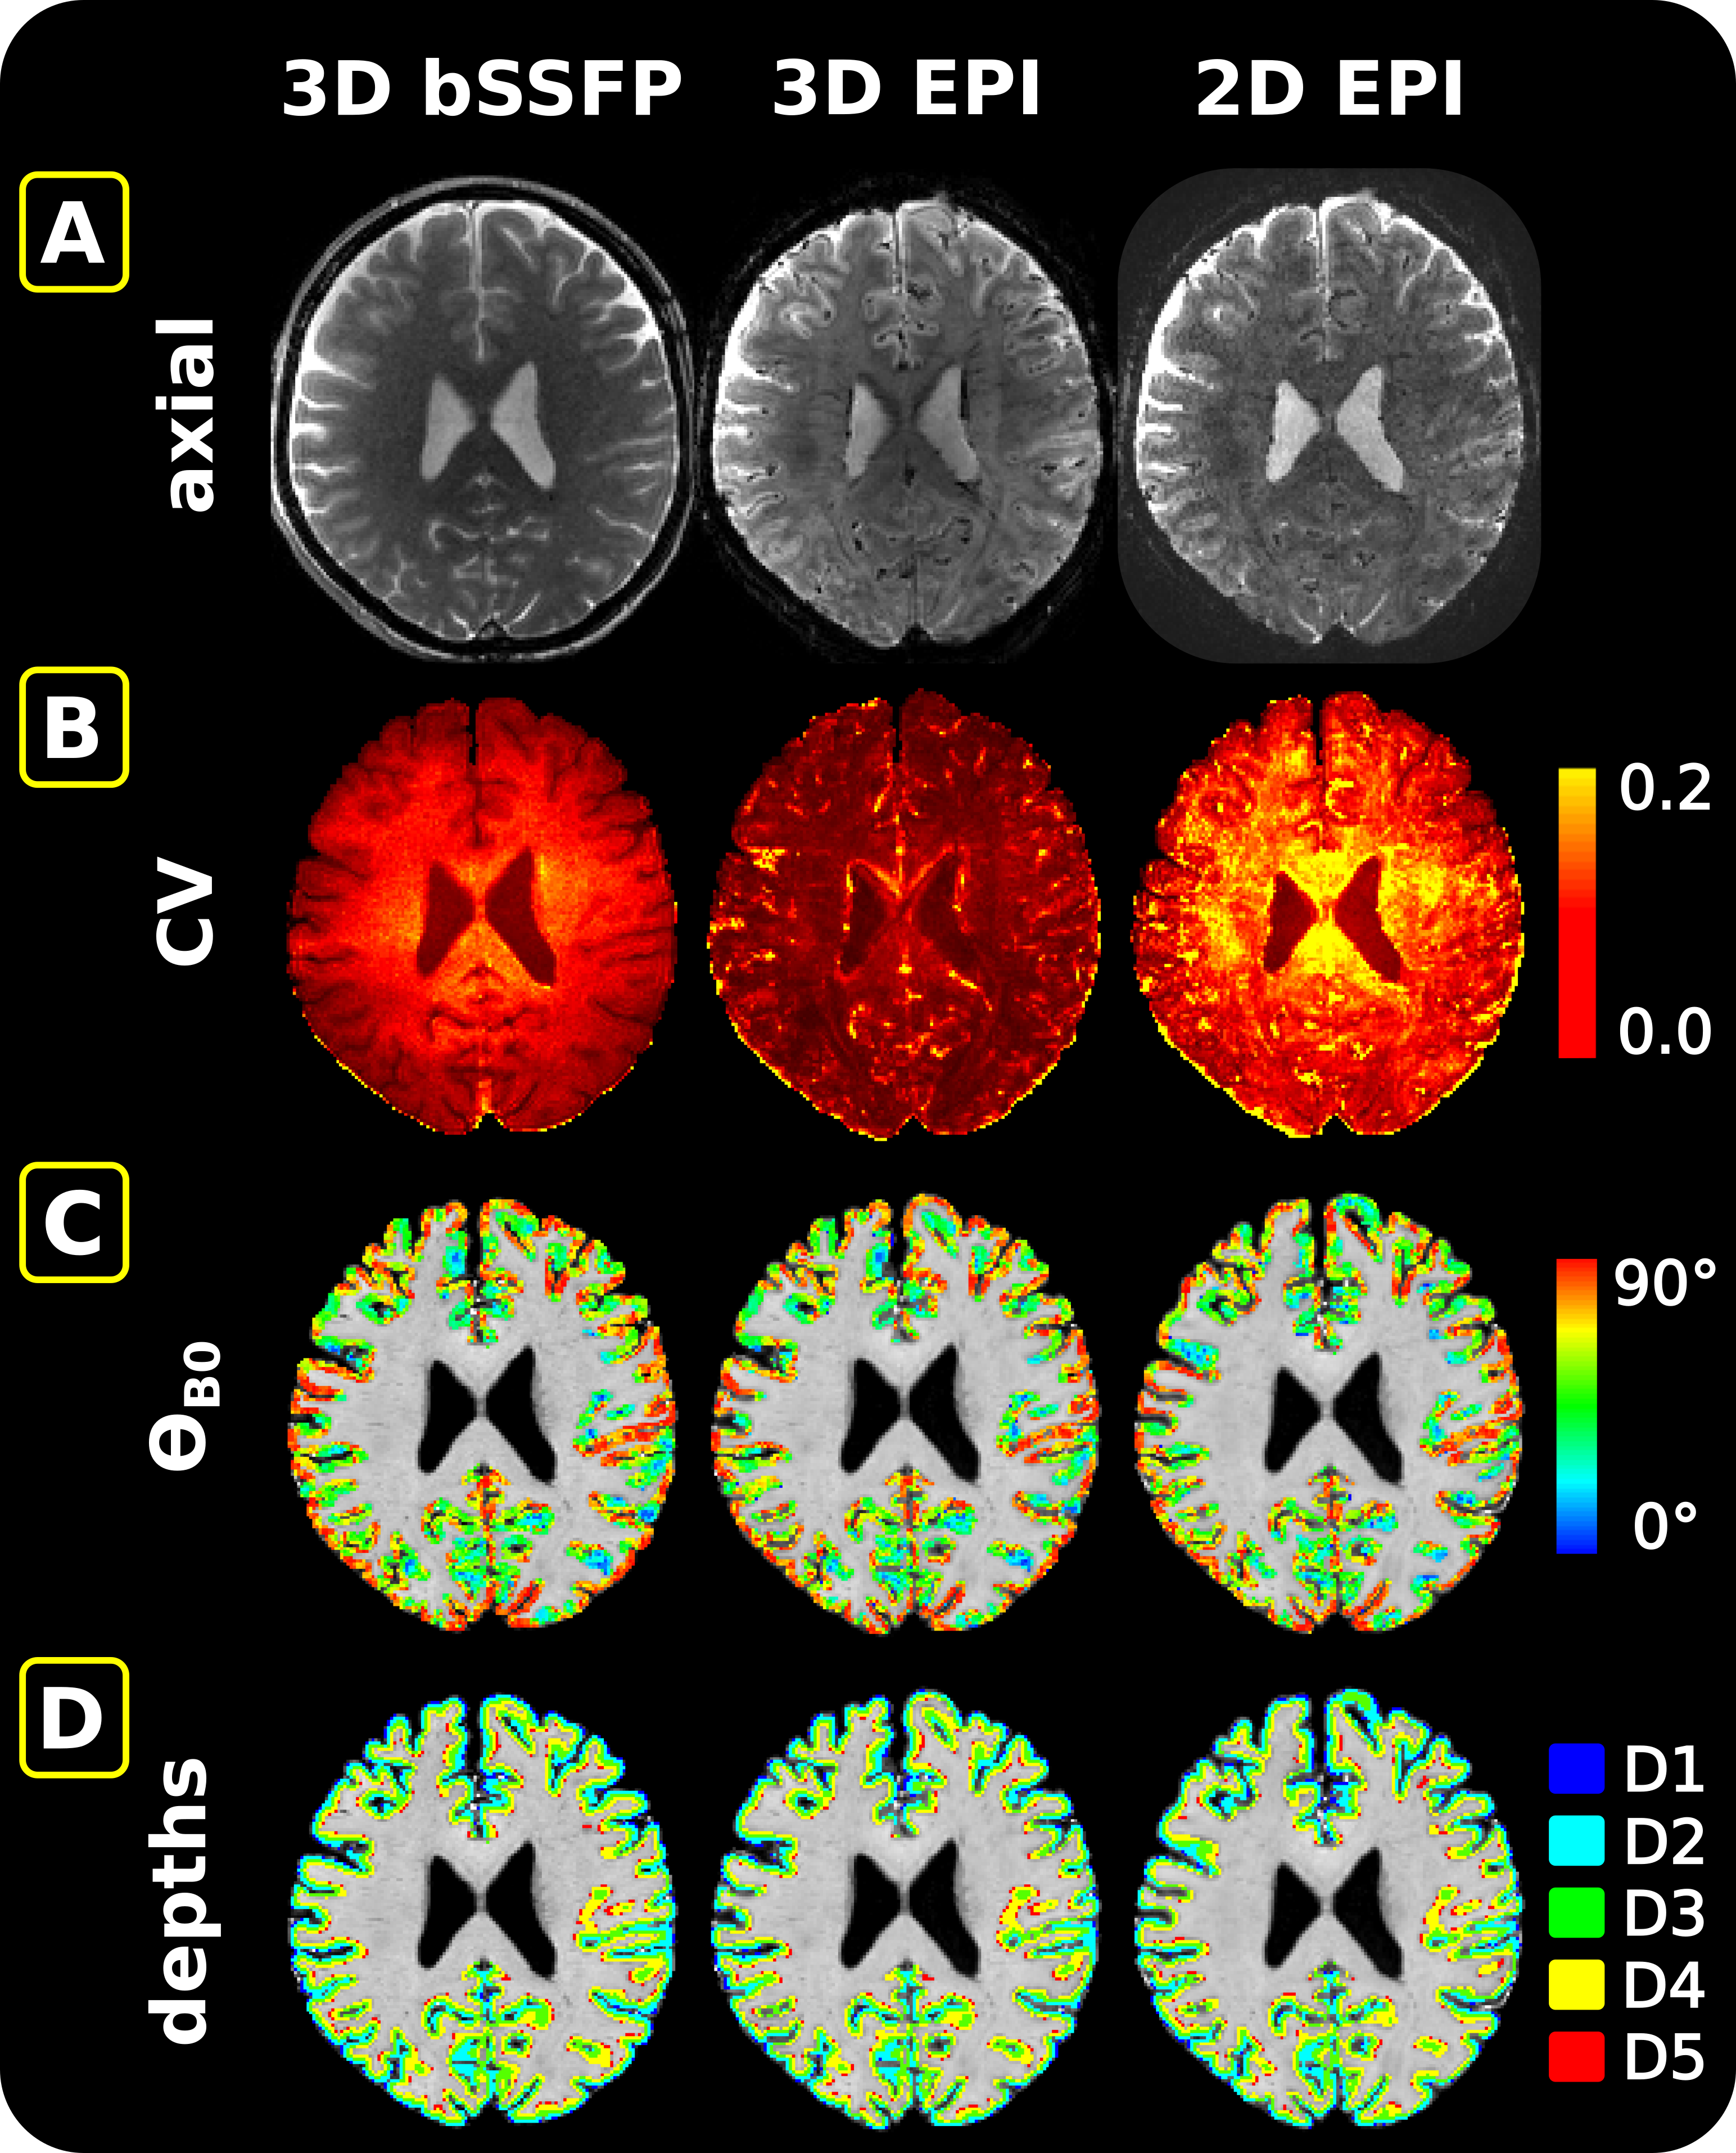
After removing the first two/three volumes from the images acquired with the 3D/2D sequences, respectively, motion correction was performed in SPM12. The coefficient of variation ($$$CV=\frac{1}{tSNR_{eff}}=\frac{\sigma}{\mu}\sqrt{TR_{vol}}$$$) was calculated as a measure for signal fluctuation (Figure 2B). The MPRAGE image, along with the calculated cortical orientation and cortical ribbon, were transformed to the functional space. This included an additional warping step in FSL11,12 (6.0.5.2) performed only on the anatomical data co-registered to the EPI data. In the other case, the anatomical data were directly co-registered to the mean bSSFP image. The cortical orientation, defined as the angle between the surface normal and $$$\overrightarrow{B_0}$$$ ($$$\theta_{B_0}$$$), was calculated and converted into voxel space in FreeSurfer3 (v7.4.0) (Figure 2C). To see the effect in different cortical depths, LayNii13 (v.2.1.0) was used to partition the cortical ribbon into five equi-distant depths (Figure 2D).
Results
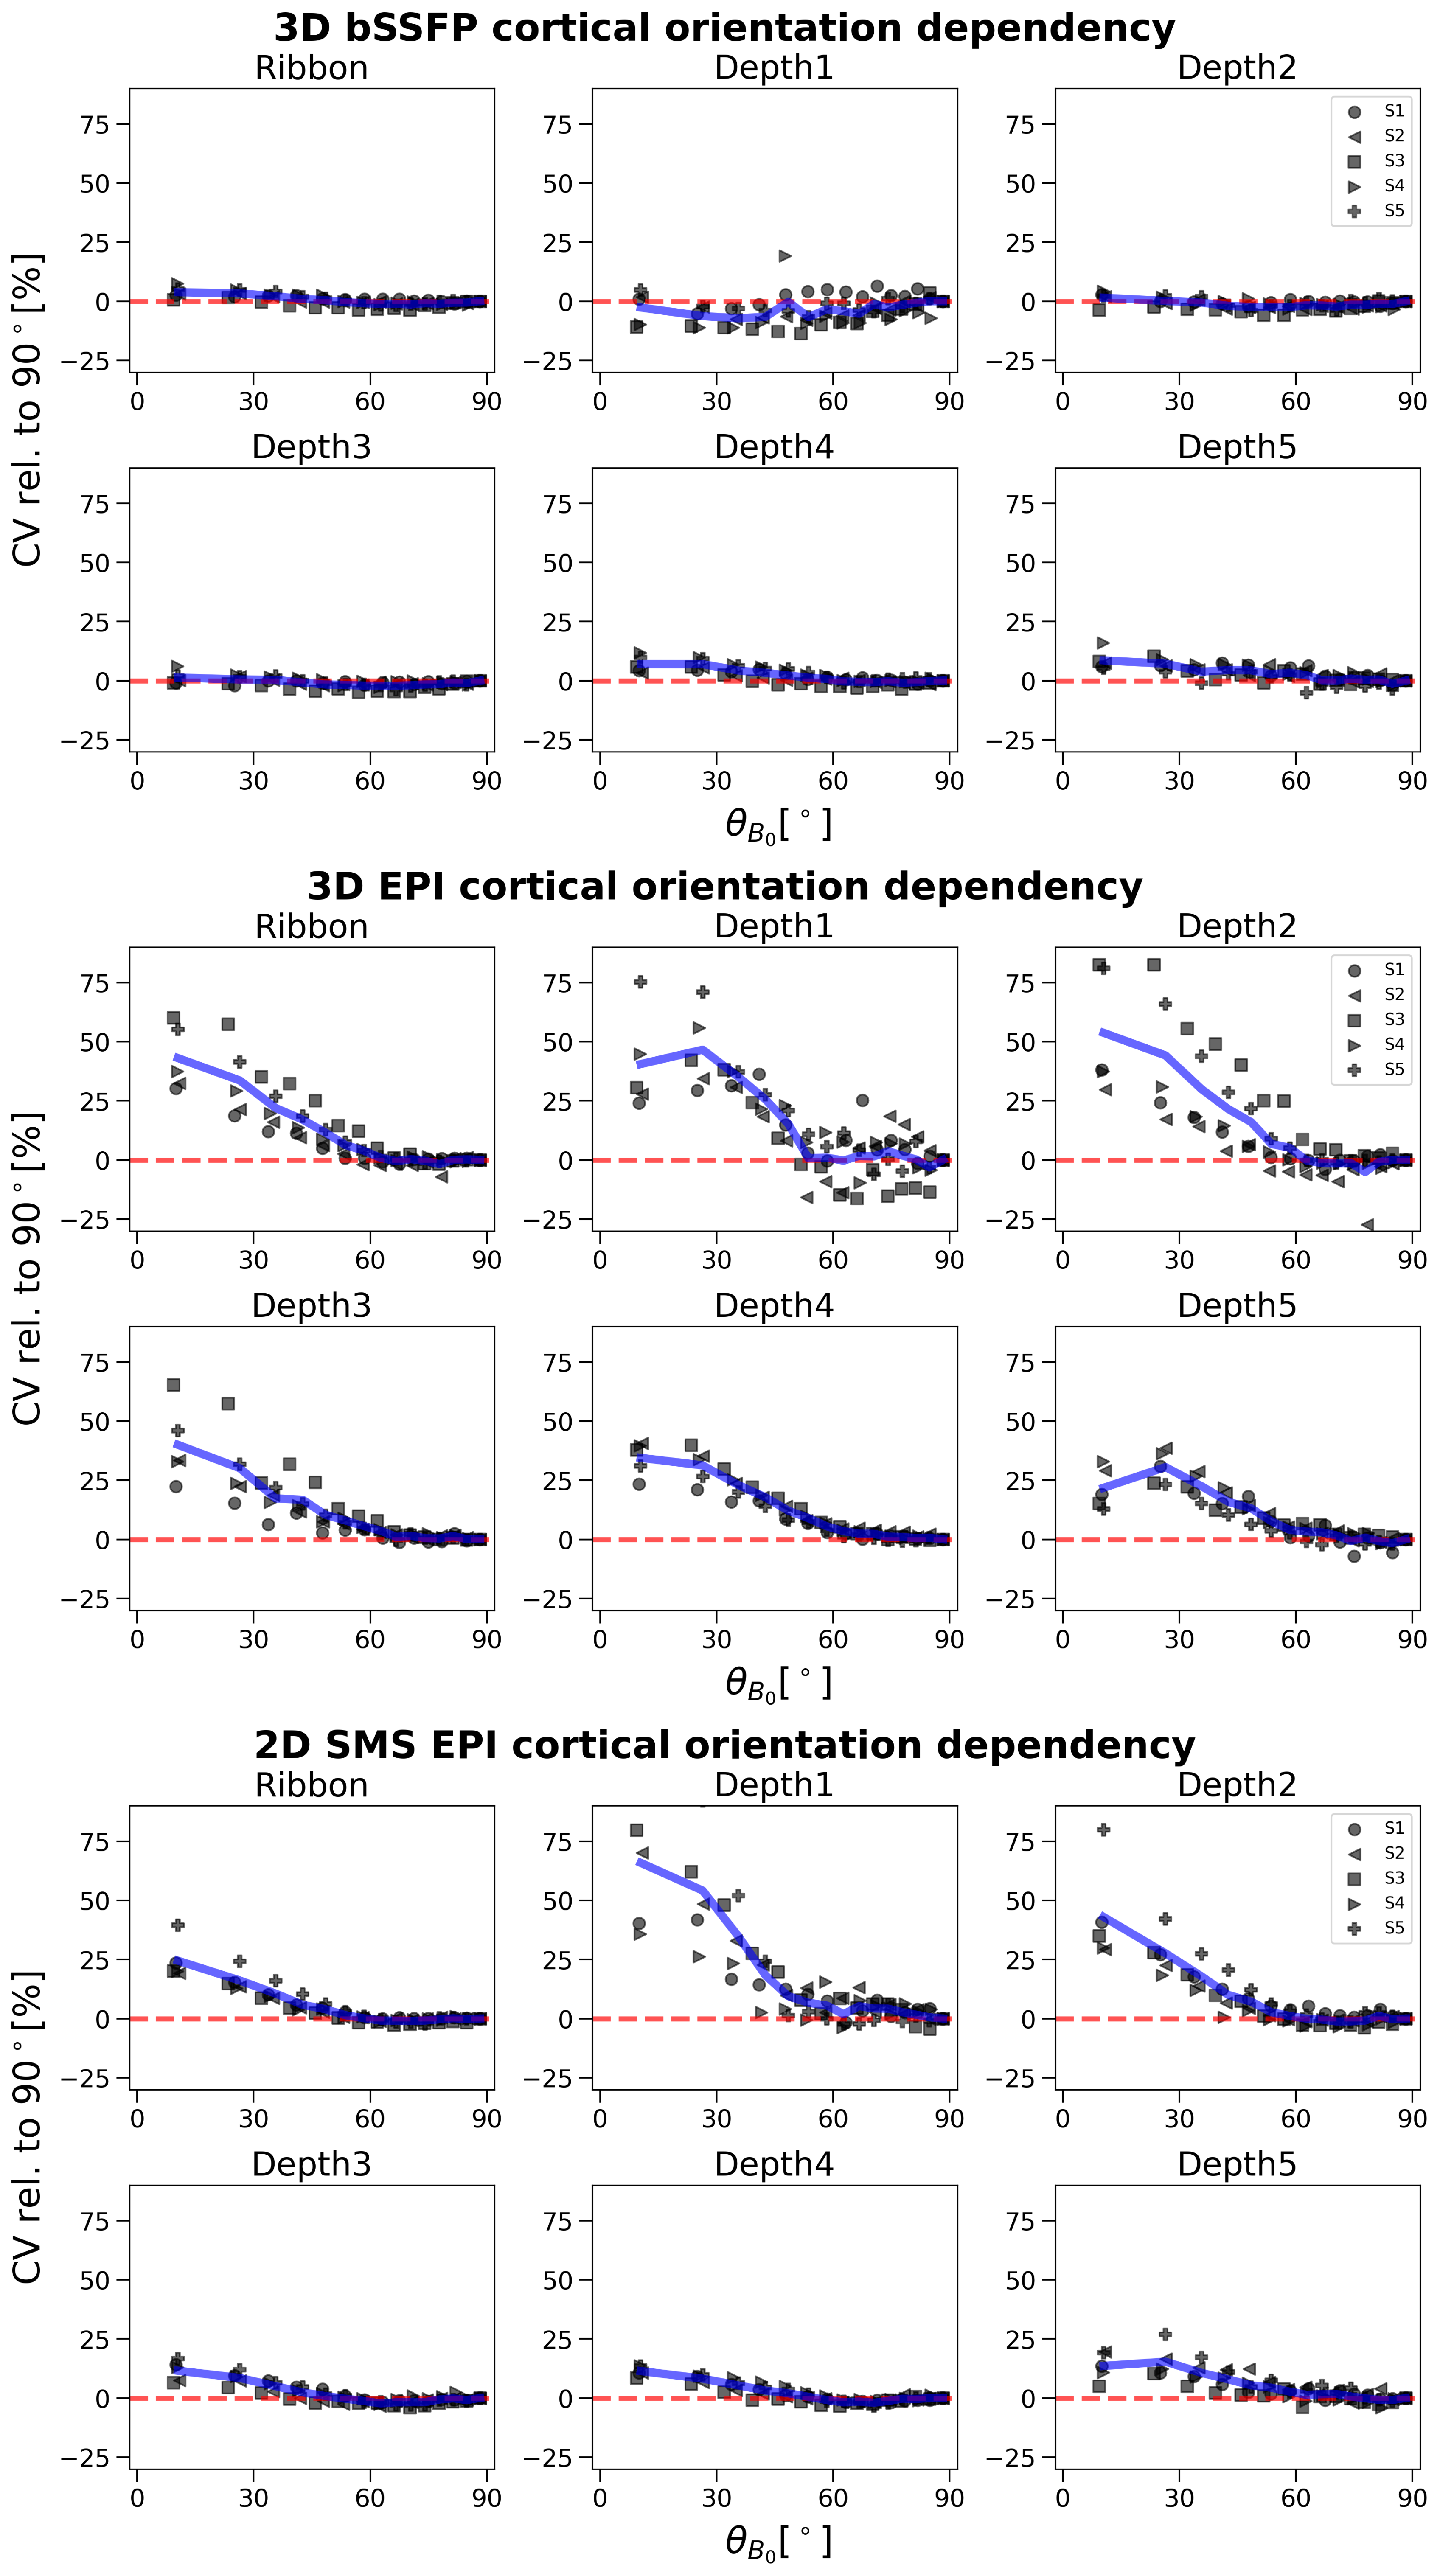
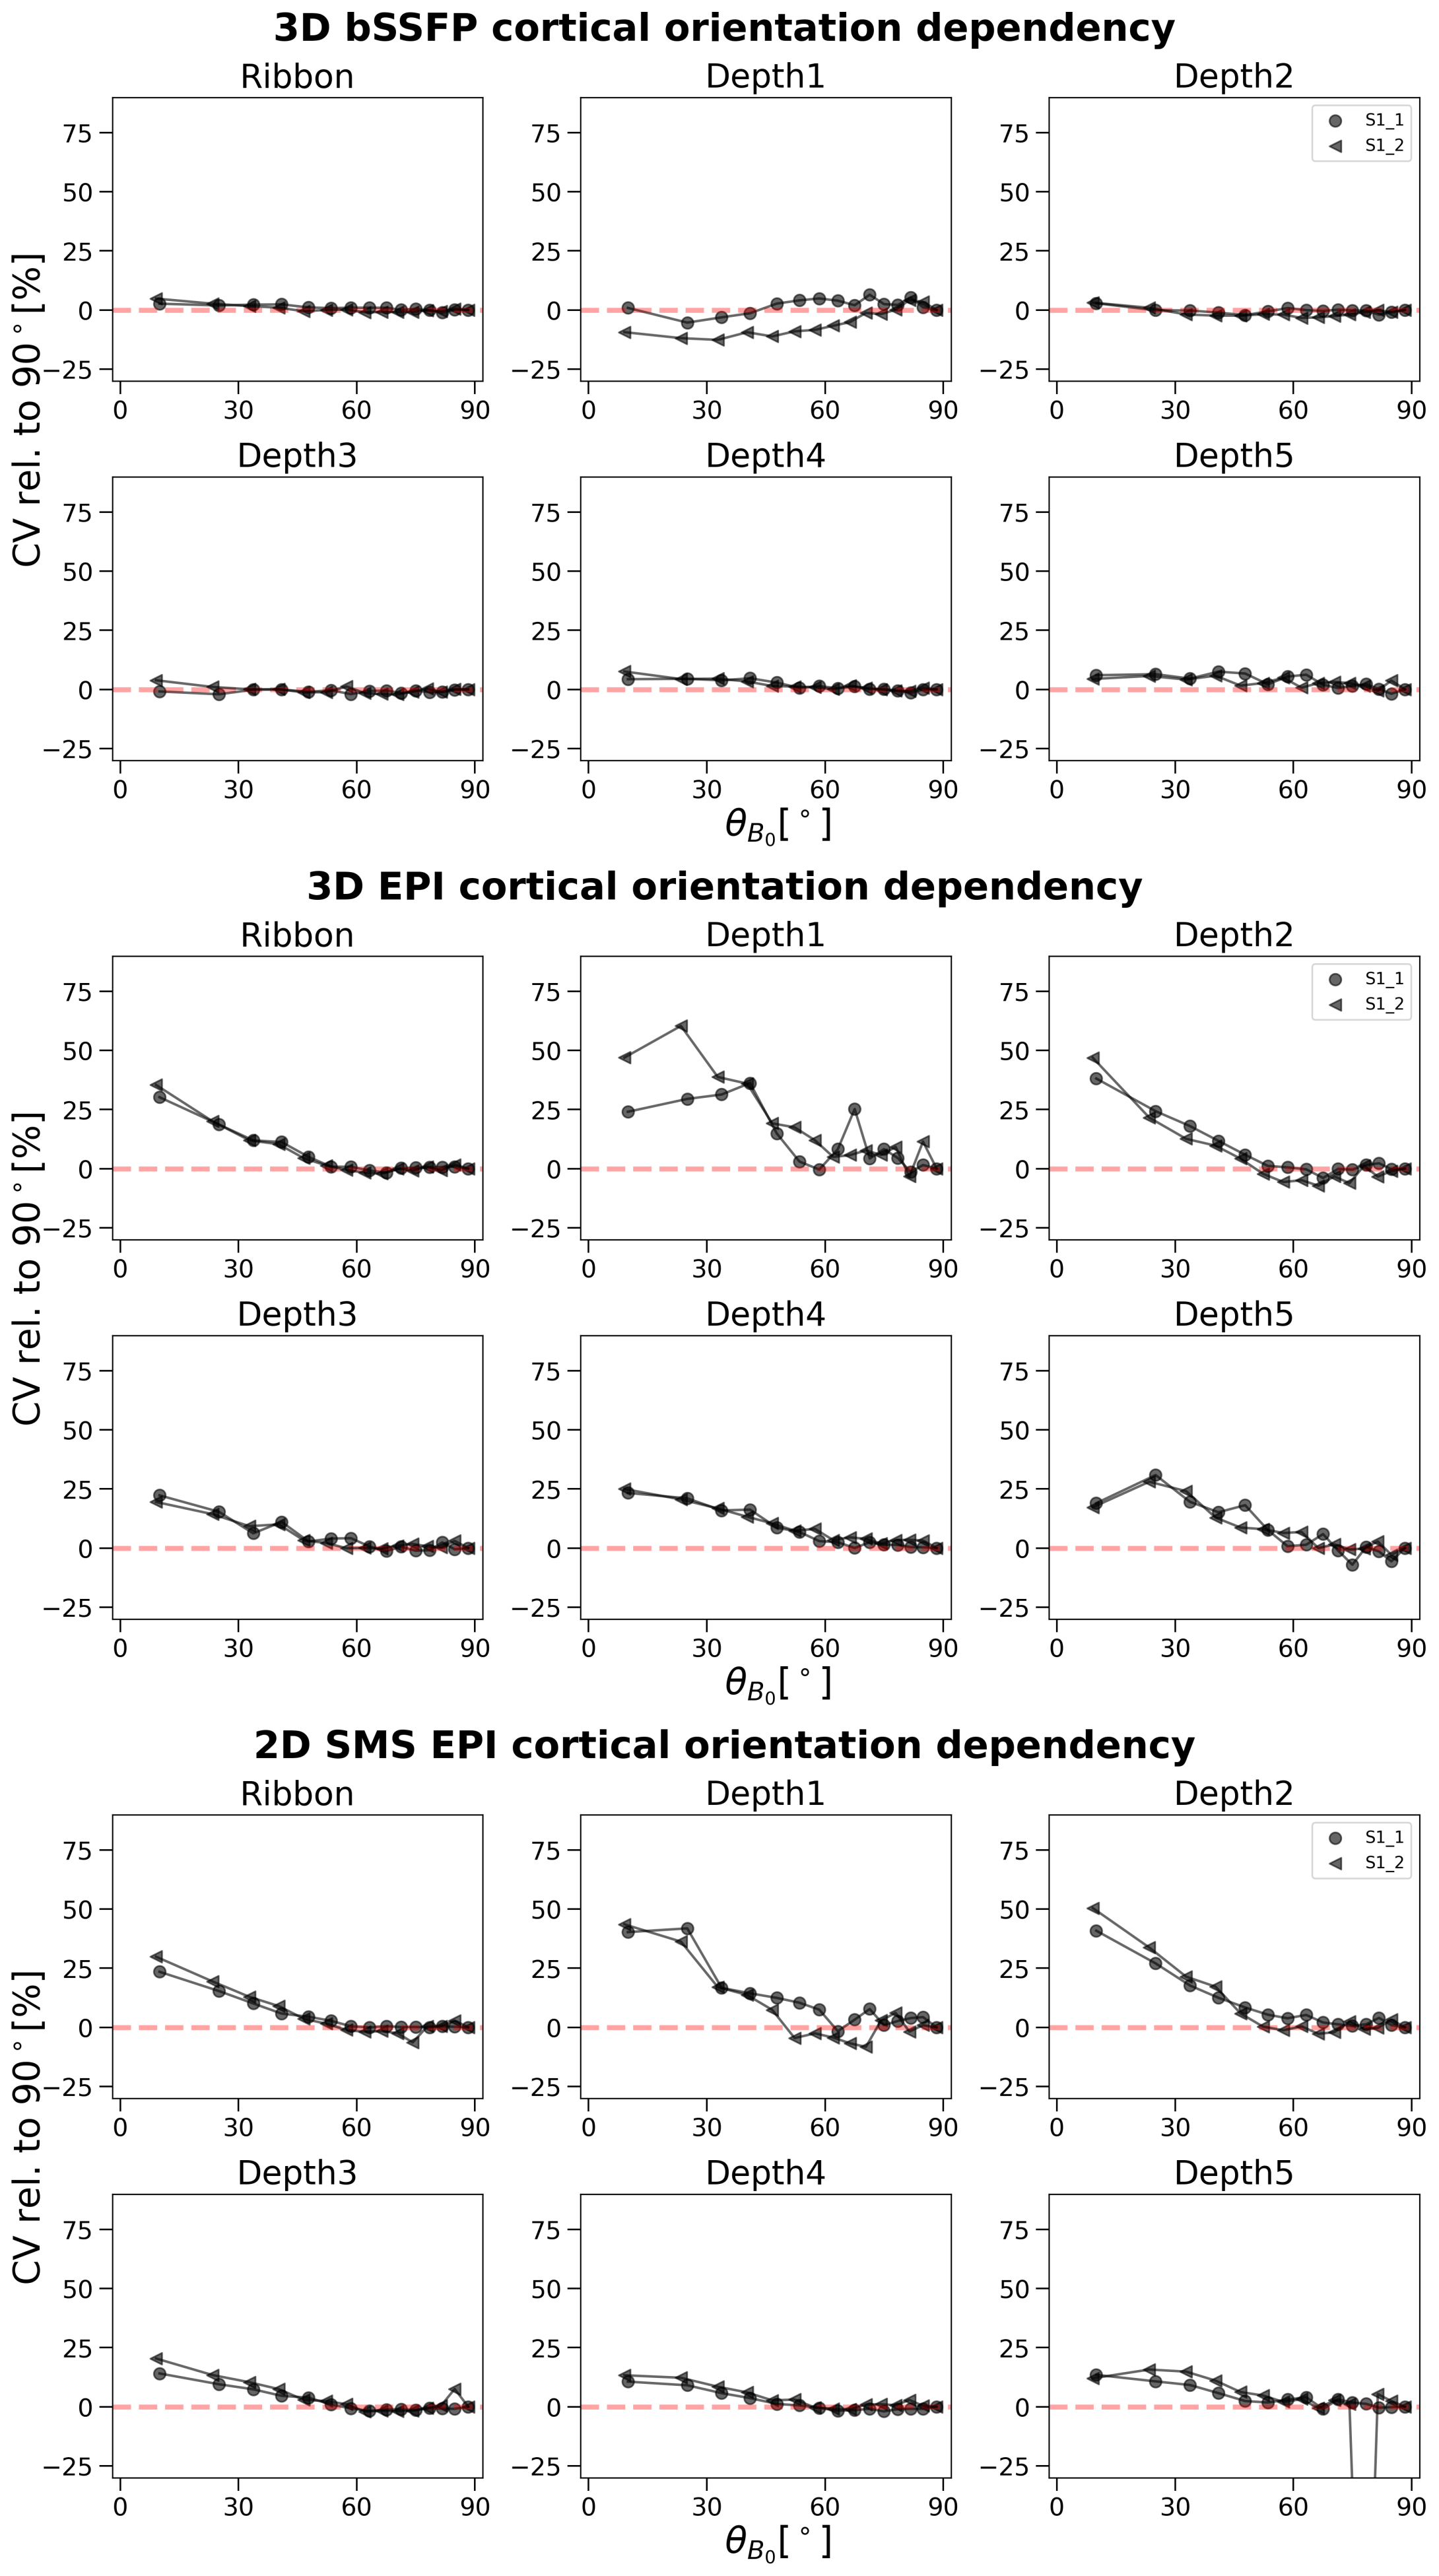
The results are summarized in Figure 3 for 3D bSSFP (top), 3D GRE-EPI (middle) and 2D GRE-EPI (bottom). The CV is plotted on $$$\theta_{B_0}$$$ in the entire cortical ribbon and in the 5 equi-distant depths (1 closest to cerebrospinal fluid [CSF] and 5 closest to white matter [WM]). In the GRE-EPI plots a clear decrease of signal fluctuation with increasing $$$\theta_{B_0}$$$ (parallelism to B0) is observed. Furthermore, with increasing proximity to WM, this effect is diminished, especially in 2D GRE-EPI. None of these effects are visible in the bSSFP plots.Discussion
The expected strong dependence of the GRE-EPI signal on the cortical orientation relative to B0 was demonstrated. This dependence thus implies a substantial signal contribution from large veins. Supporting this hypothesis, this effect is reduced, but is not eliminated at deeper cortical depths (depth5). The resting-state signal acquired with bSSFP does not show any of these effects. This suggests a higher specificity of bSSFP to smaller veins, which was expected based on simulations of a previous work14. Our results are comparable to those of Viessmann et al.3, who investigated the cortical orientation dependence of 2D SMS EPI with similar settings at 7 Tesla. Thus, direct translation of our results to this field strength appears to be reasonable.To further substantiate this hypothesis, we aim to explore the impact of masking out voxels closer to pial veins on the cortical orientation effect. A decreasing signal dependence on the cortical orientation would indicate a high dependence on large veins. Here, only one session for each subject is shown and one run is acquired with the 2D sequence as opposed to four with the 3D sequences. Test-retest reliability has not been demonstrated and is in progress (example for S1 shown in Figure 4). Thermal and physiological noise regression effects were investigated, but did not impact the overall outcome (results not shown).
Conclusion
The bSSFP sequence shows no dependence on the cortical orientation relative to $$$\overrightarrow{B_0}$$$, while the opposite is true for 2D SMS and 3D GRE-EPI. This suggests a higher signal specificity of bSSFP and must be further investigated with task fMRI.Acknowledgements
D.R. and S.M. are financially supported by the grant FKZ 01GQ2101 of the Federal Ministry of Education and Research, Germany.References
- Chu, S. C.-K., Xu, Y., Balschi, J. A. & Springer, C. S. Bulk magnetic susceptibility shifts in nmr studies of compartmentalized samples: use of paramagnetic reagents. Magn. Reson. Med. 13, 239–262 (1990).
- Gagnon, L. et al. Quantifying the microvascular origin of BOLD-fMRI from first principles with two-photon microscopy and an oxygen-sensitive nanoprobe. J. Neurosci. 35, 3663–3675 (2015).
- Viessmann, O., Scheffler, K., Bianciardi, M., Wald, L. L. & Polimeni, J. R. Dependence of resting-state fMRI fluctuation amplitudes on cerebral cortical orientation relative to the direction of B0 and anatomical axes. NeuroImage 196, 337–350 (2019).
- Lai, S. et al. Identification of vascular structures as a major source of signal contrast in high resolution 2D and 3D functional activation imaging of the motor cortex at l.5T preliminary results. Magn. Reson. Med. 30, 387–392 (1993).
- Bause, J. et al. Impact of prospective motion correction, distortion correction methods and large vein bias on the spatial accuracy of cortical laminar fMRI at 9.4 Tesla. NeuroImage 208, (2020).
- Ramadan, D., Bause, J., Stirnberg, R., Ehses, P. & Scheffler, K. Dependence of the EPI and bSSFP resting-state fMRI signals on the cortical orientation relative to B0: Initial observations at 9.4 Tesla. in ISMRM 3665 (2023).
- Shajan, G. et al. A 16-channel dual-row transmit array in combination with a 31-element receive array for human brain imaging at 9.4 T. Magn. Reson. Med. 71, 870–879 (2014).
- Ehses, P. & Scheffler, K. Multiline balanced SSFP for rapid functional imaging at ultrahigh field. Magn. Reson. Med. 79, 994–1000 (2018).
- Stirnberg, R. & Stöcker, T. Segmented K‐space blipped‐controlled aliasing in parallel imaging for high spatiotemporal resolution EPI. Magn. Reson. Med. 85, 1540–1551 (2021).
- Geldschläger, O., Bosch, D., Glaser, S. & Henning, A. Local excitation universal parallel transmit pulses at 9.4T. Magn. Reson. Med. 86, 2589–2603 (2021).
- Andersson, J. L. R., Skare, S. & Ashburner, J. How to correct susceptibility distortions in spin-echo echo-planar images: application to diffusion tensor imaging. NeuroImage 20, 870–888 (2003).
- Smith, S. M. et al. Advances in functional and structural MR image analysis and implementation as FSL. NeuroImage 23, S208–S219 (2004).
- Huber, L. (Renzo) et al. LayNii: A software suite for layer-fMRI. NeuroImage 237, 118091 (2021).
- Báez-Yánez, M. G. et al. The impact of vessel size, orientation and intravascular contribution on the neurovascular fingerprint of BOLD bSSFP fMRI. NeuroImage 163, 13–23 (2017)
Figures