0323
A novel biophysical simulation framework for intravascular MRI signals using 3D Vascular Anatomical Networks applied to VASO-fMRI1A.A. Martinos Center For Biomedical Imaging, MGH, Charlestown, MA, United States, 2Department of Radiology, Harvard Medical School, Boston, MA, United States, 3Department of Electrical Engineering and Computer Science, Massachusetts Institute of Technology, Cambridge, MA, United States, 4Physics, Carleton University, Ottowa, ON, Canada, 5Royal Ottowa Mental Health Centre, Ottowa, ON, Canada, 6Massachusetts Institute of Technology, Cambridge, MA, United States
Synopsis
Keywords: fMRI Acquisition, Blood vessels, brain, contrast mechanisms, flow, fMRI (task based), gray matter, high-field MRI, in silico, modelling, signal modeling
Motivation: The emerging fMRI method VASO provides improved neuronal specificity compared to BOLD, however the precise interpretation of its origins and principled means to optimize this sequence is not straightforward.
Goal(s): To use biophysical models to investigate the origins of the VASO signal and compare it with direct estimates of CBV.
Approach: We extend our 3D biophysical Vascular Anatomical Network framework to incorporate intravascular signals undergoing inversion recovery to model the VASO sequence.
Results: The VASO signal appears sensitive to slab thickness, and activation biases occur if the slab is too thin. Simulated profiles of VASO differ from measurements, possibly due to model simplifications.
Impact: Our new methodology enables biophysical simulations of fMRI based on inverting blood. Our findings may provide a deeper understanding of the hemodynamic origins of VASO and provide guidance for optimizing SS-SI VASO protocols to yield veridical representation of neural activity.
Introduction
Functional MRI tracks hemodynamic changes associated with neuronal activity. These hemodynamics are shaped by microvascular anatomy, thus fully interpreting fMRI signals requires linking observable fMRI measurements to underlying microvasculature. The most popular contrast is blood-oxygenation-level-dependent (BOLD), which reflects an interplay between blood flow, volume, and oxygenation changes. Other functional contrasts specific to flow or volume may relate more to microvascular dynamics, and appear to provide enhanced neuronal specificity1. The VAscular Space Occupancy (VASO) approach2 measures cerebral blood volume (CBV), and empirically provides sufficient specificity to detect functional differences between cortical layers3. However, the leading VASO approach, slice-selective slab-inversion (SS-SI) VASO4,5 utilizes inversion pulses to exploit the non steady-state magnetization of fresh inflowing blood. It also requires several assumptions4 for interpretation and optimization such as all blood in the voxel being inverted exactly once.Here we extend a biophysical fMRI model that uses realistic microvascular anatomy and dynamics based on Vascular Anatomical Networks (VANs)6–8. This framework represents every blood vessel inside a voxel, relating microvascular changes directly to measured fMRI data. While this framework has been applied to interpreting BOLD6,7,9,10 and VASO11, here we incorporate longitudinal magnetization (the basis of the VASO signal) and blood arrival time (AT, the time for blood to reach the voxel) and transit times (TT, the amount of time between entering the voxel and reaching the individual microvessel segment). This allows us to test the assumptions behind SS-SI VASO and compare its cortical depth response profiles against physiological CBV responses to neuronal activity.
Methods
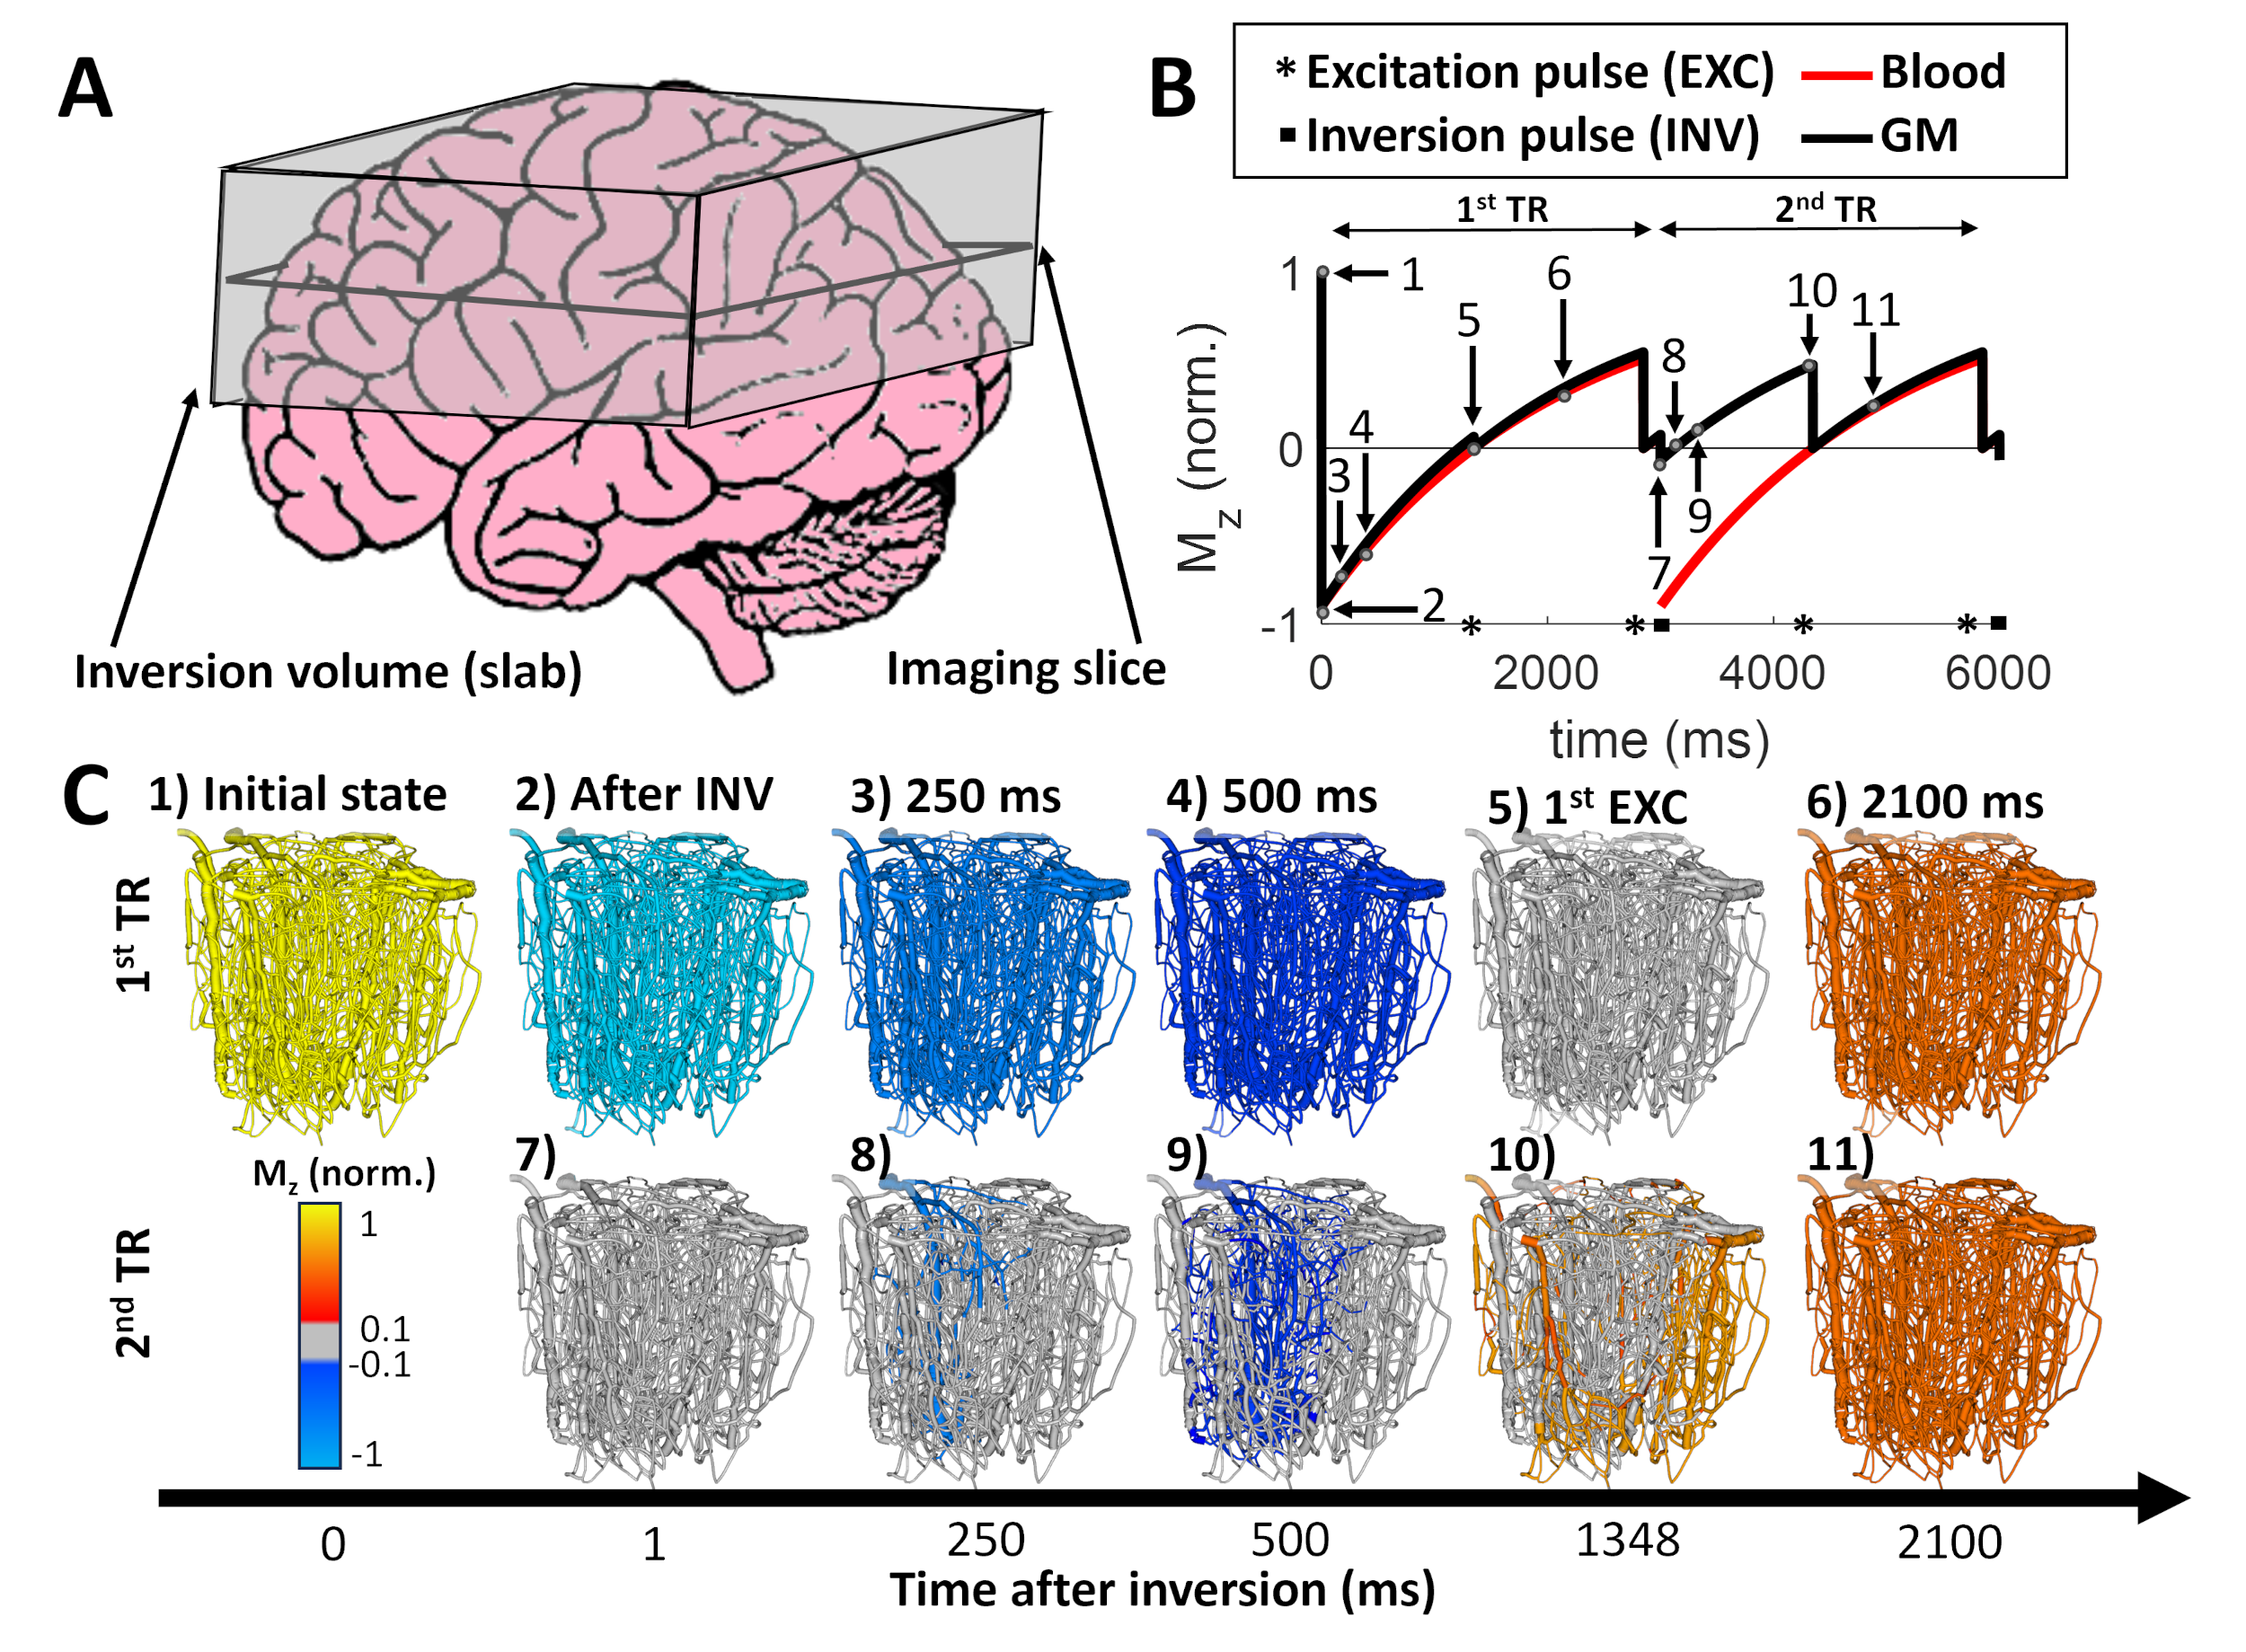
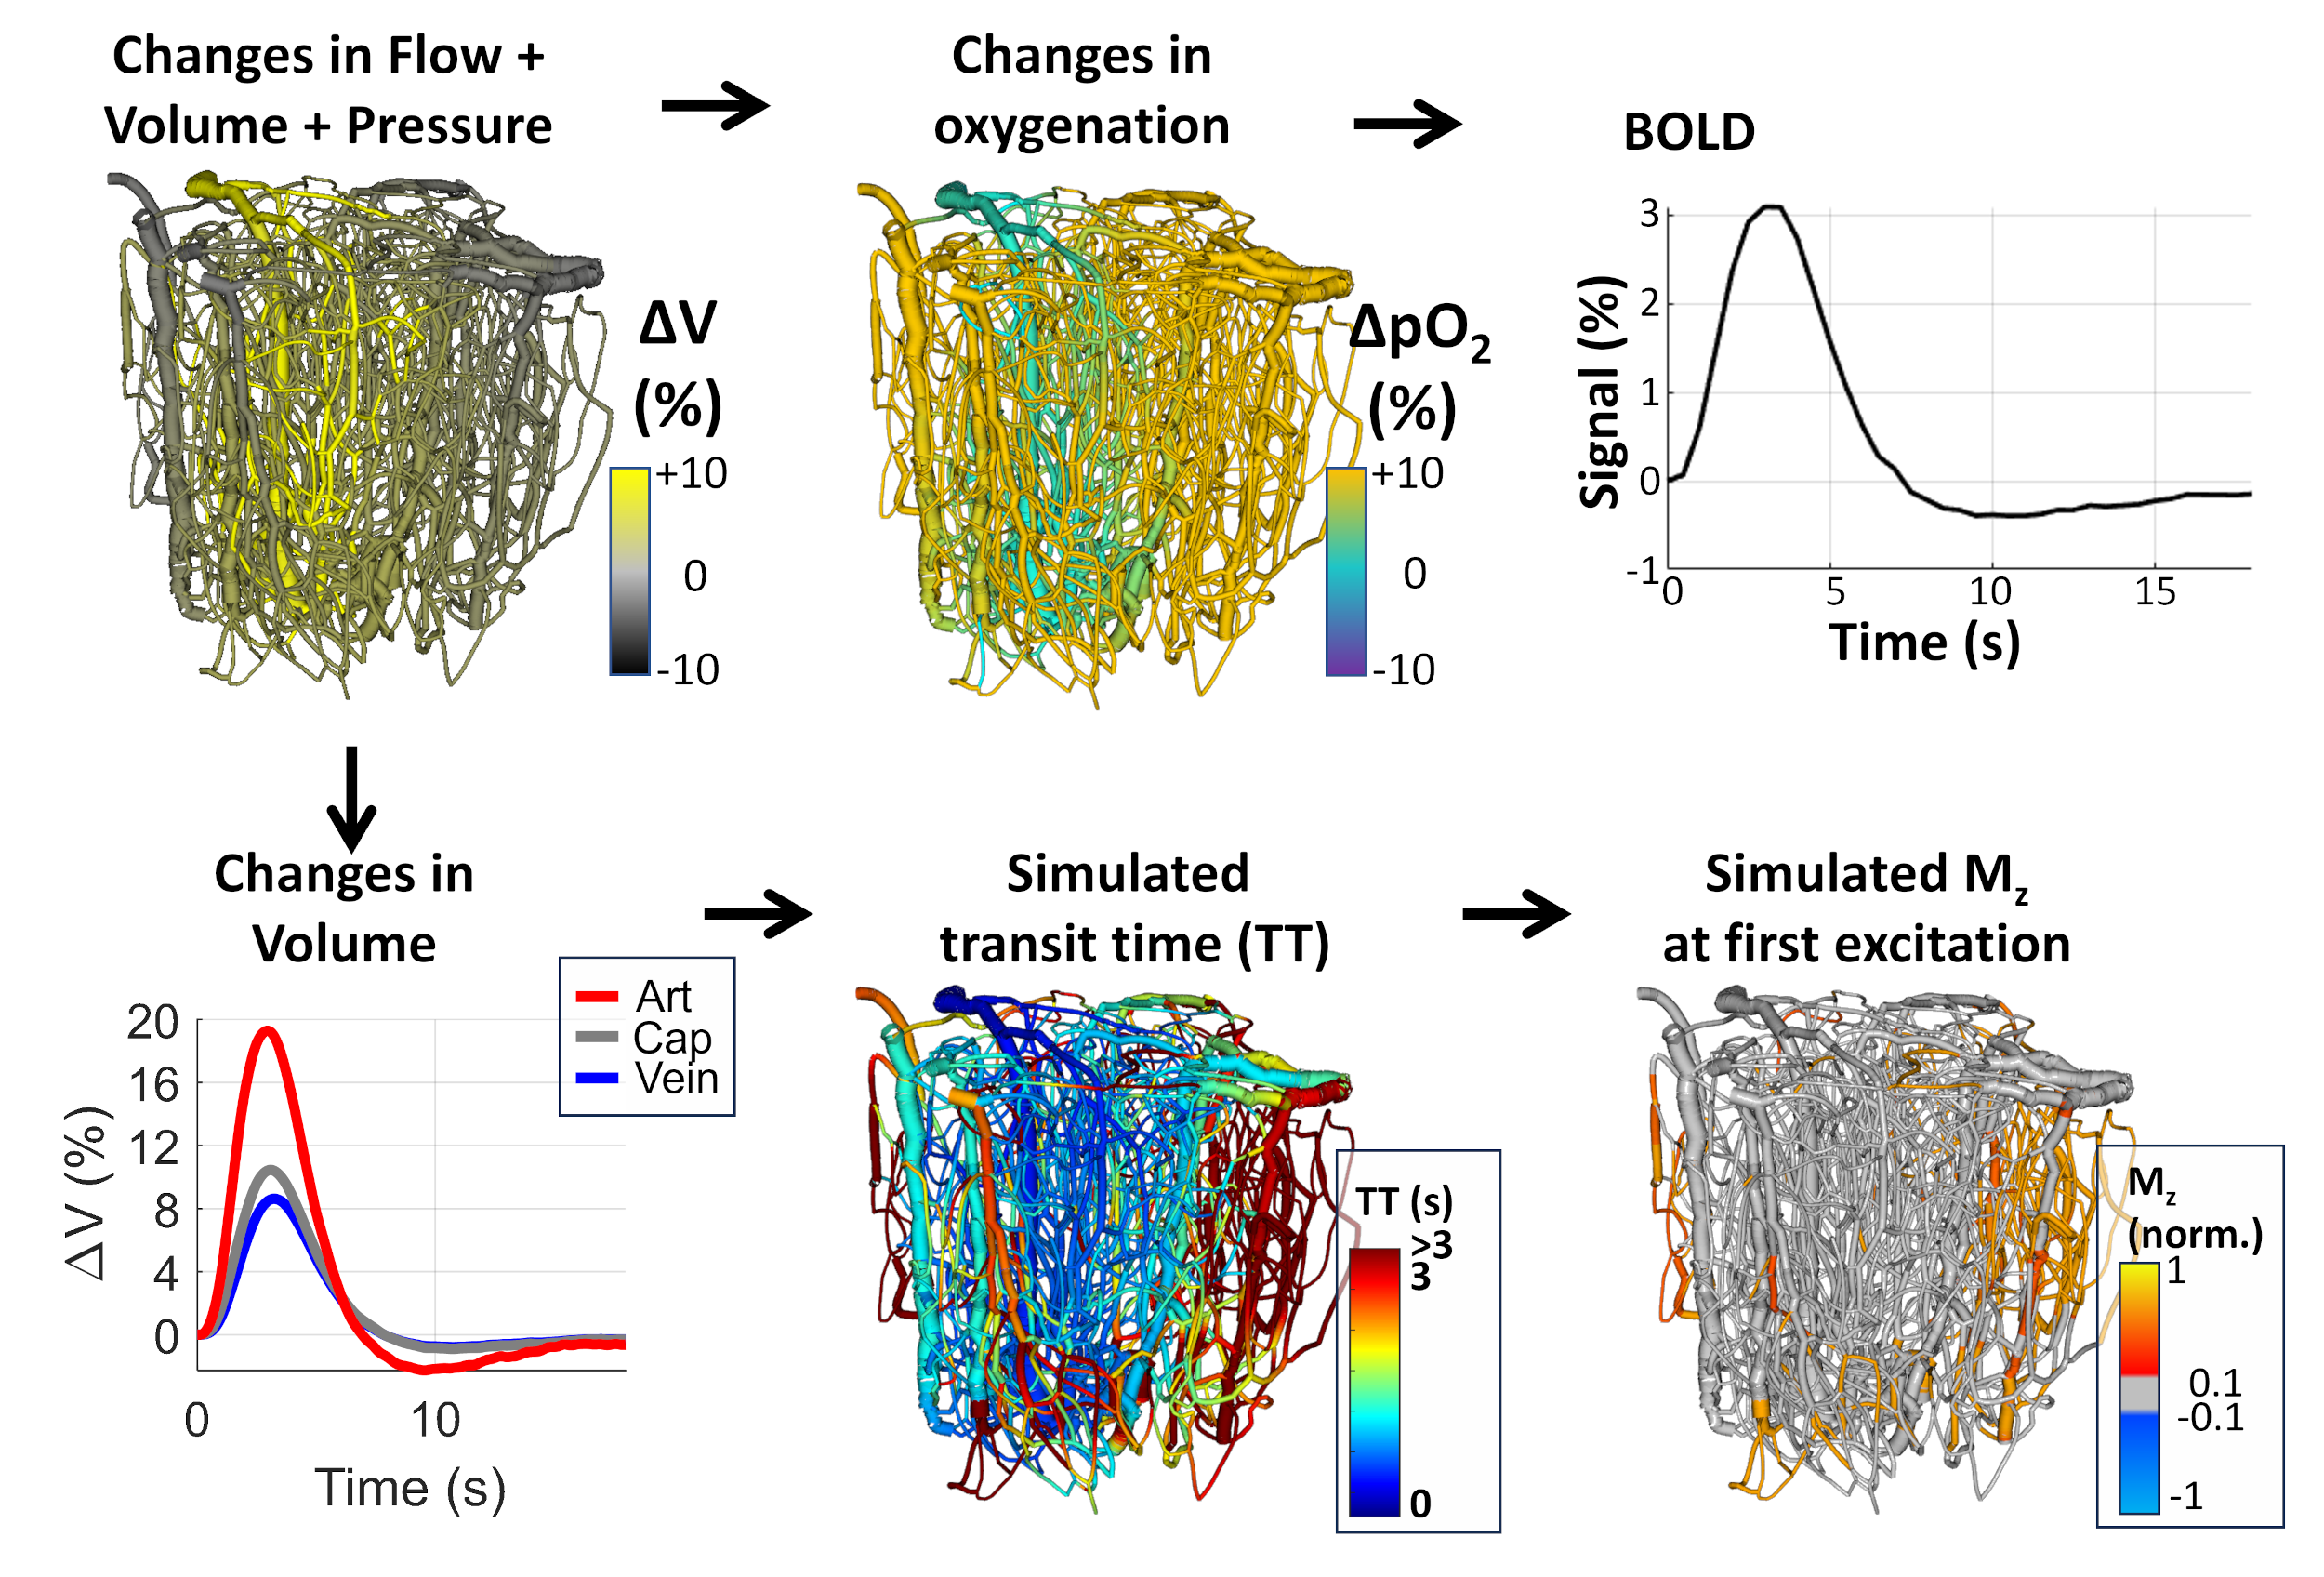
We extended the VAN framework6,7 to model longitudinal magnetization, Mz, inversion recovery, and blood AT and TT. The VAN models are reconstructed from a mouse somatosensory cortical voxel6,12. We impose arterial dilations from in-vivo single-vessel microscopy after 2-s forepaw stimulation representing the vascular response to neuronal activity13,14. We use the Balloon Model15 to passively dilate capillaries and veins6,7.The SS-SI VASO sequence4 uses an inversion pulse (assuming 95% efficiency4) followed by two excitation pulses at TI=1348 ms for “blood null” and 1848 ms for “BOLD correction” images and 3000 ms between inversions (TR) (Figure 1).
Simulated blood perfusion is 100 ml/100g/min during baseline (t=0 s post-stimulus) and 176 ml/100g/min during activation (t=3.5 s). We calculated the percentage of incoming flow and corresponding TT of each vessel to account for the mixing of blood with different transit times.
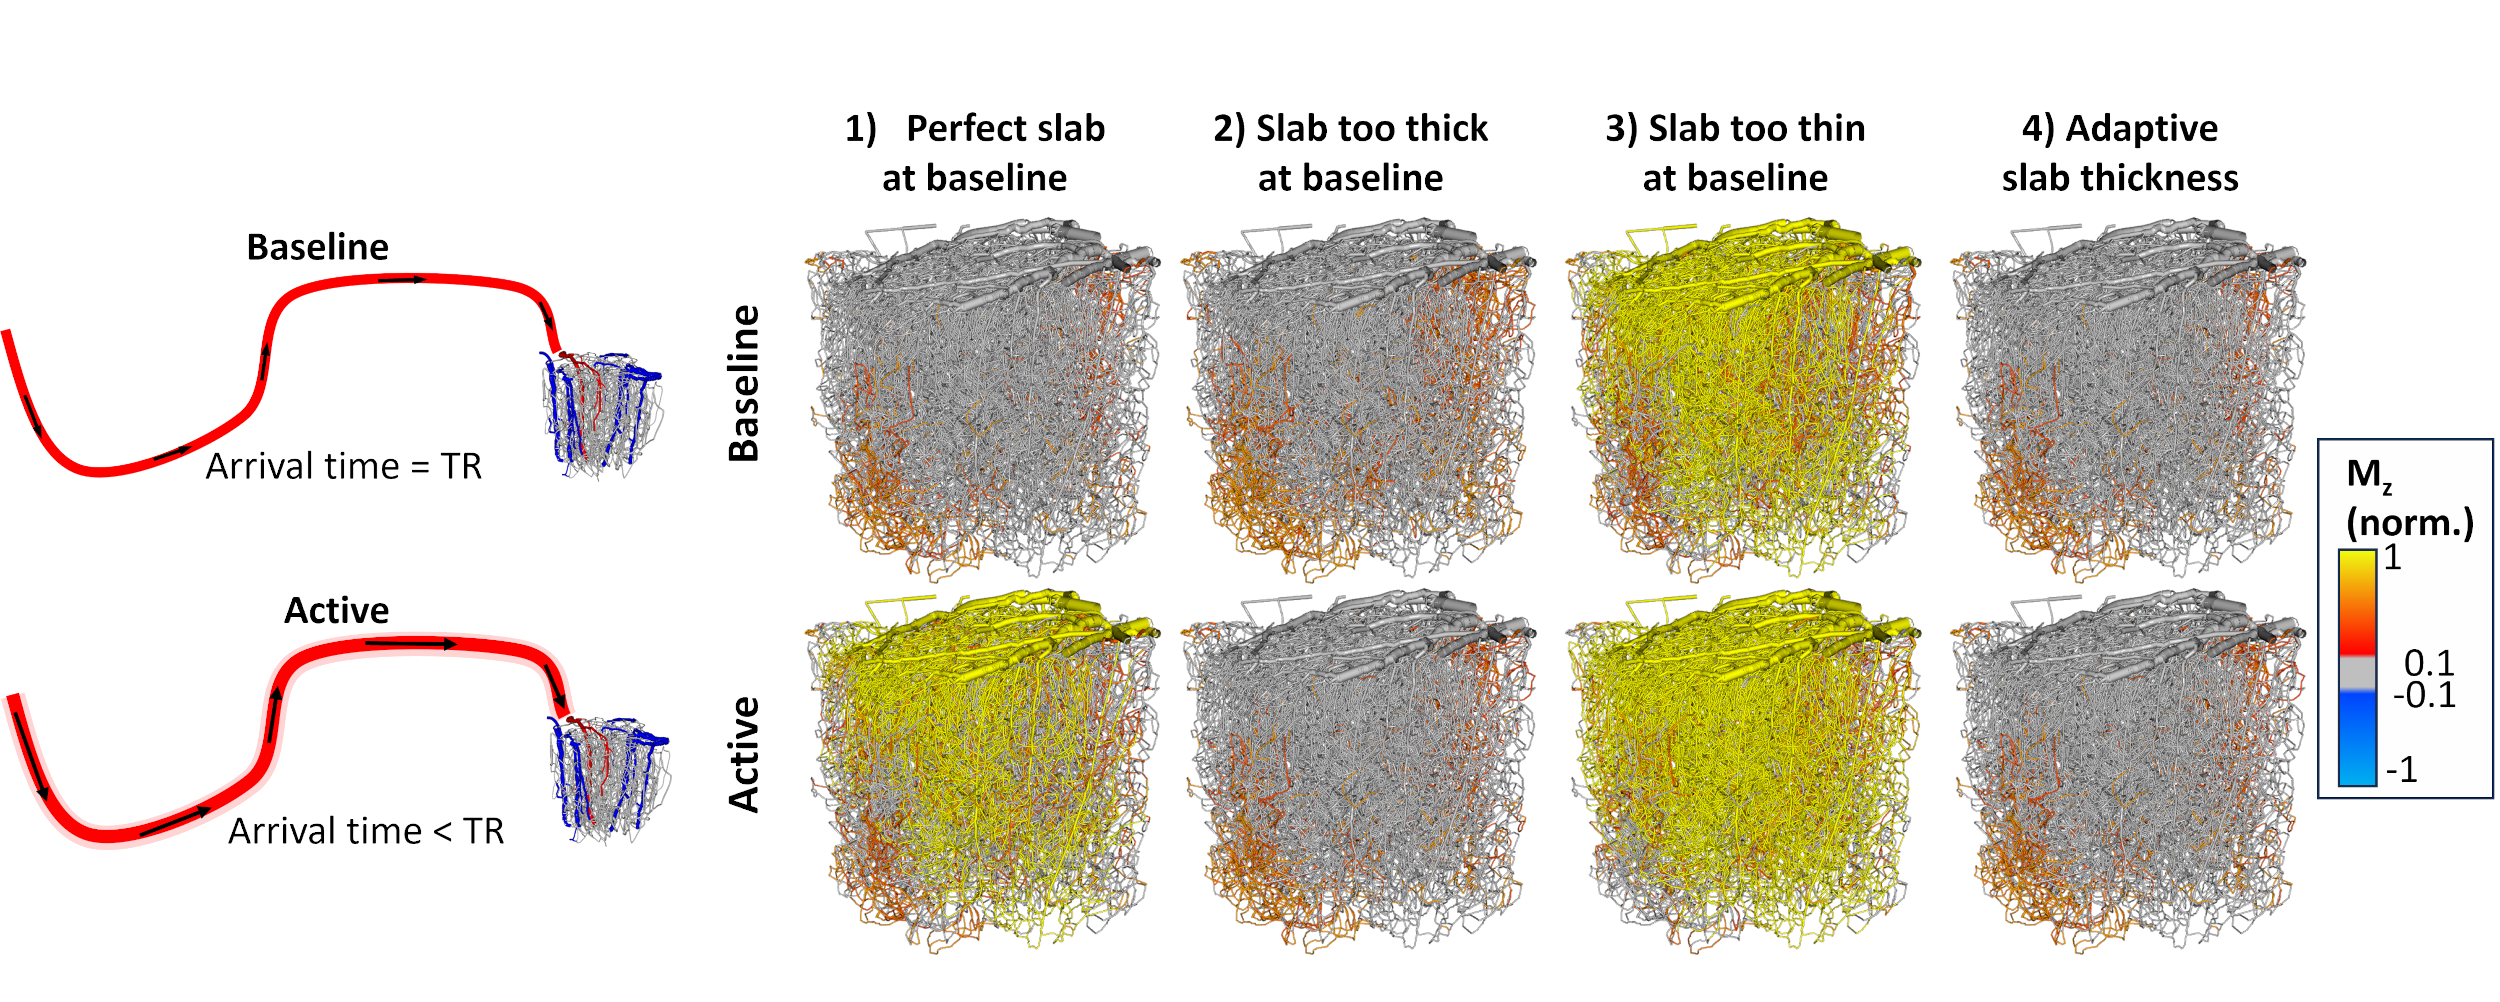
Delivery time (DT) is the sum of the AT and TT. If DT is short (DT<TR), the segment has once-inverted blood. If the DT is long (DT≥TR), the blood is at least twice inverted. The “perfect” slab thickness corresponds to an equal AT and TR (all incoming blood is once-inverted). We also model a “too thin” slab with the final 30% of inlet blood being un-inverted and a “too thick” slab with the first 30% of blood being twice-inverted. We discard the first inversion-recovery period.
Results
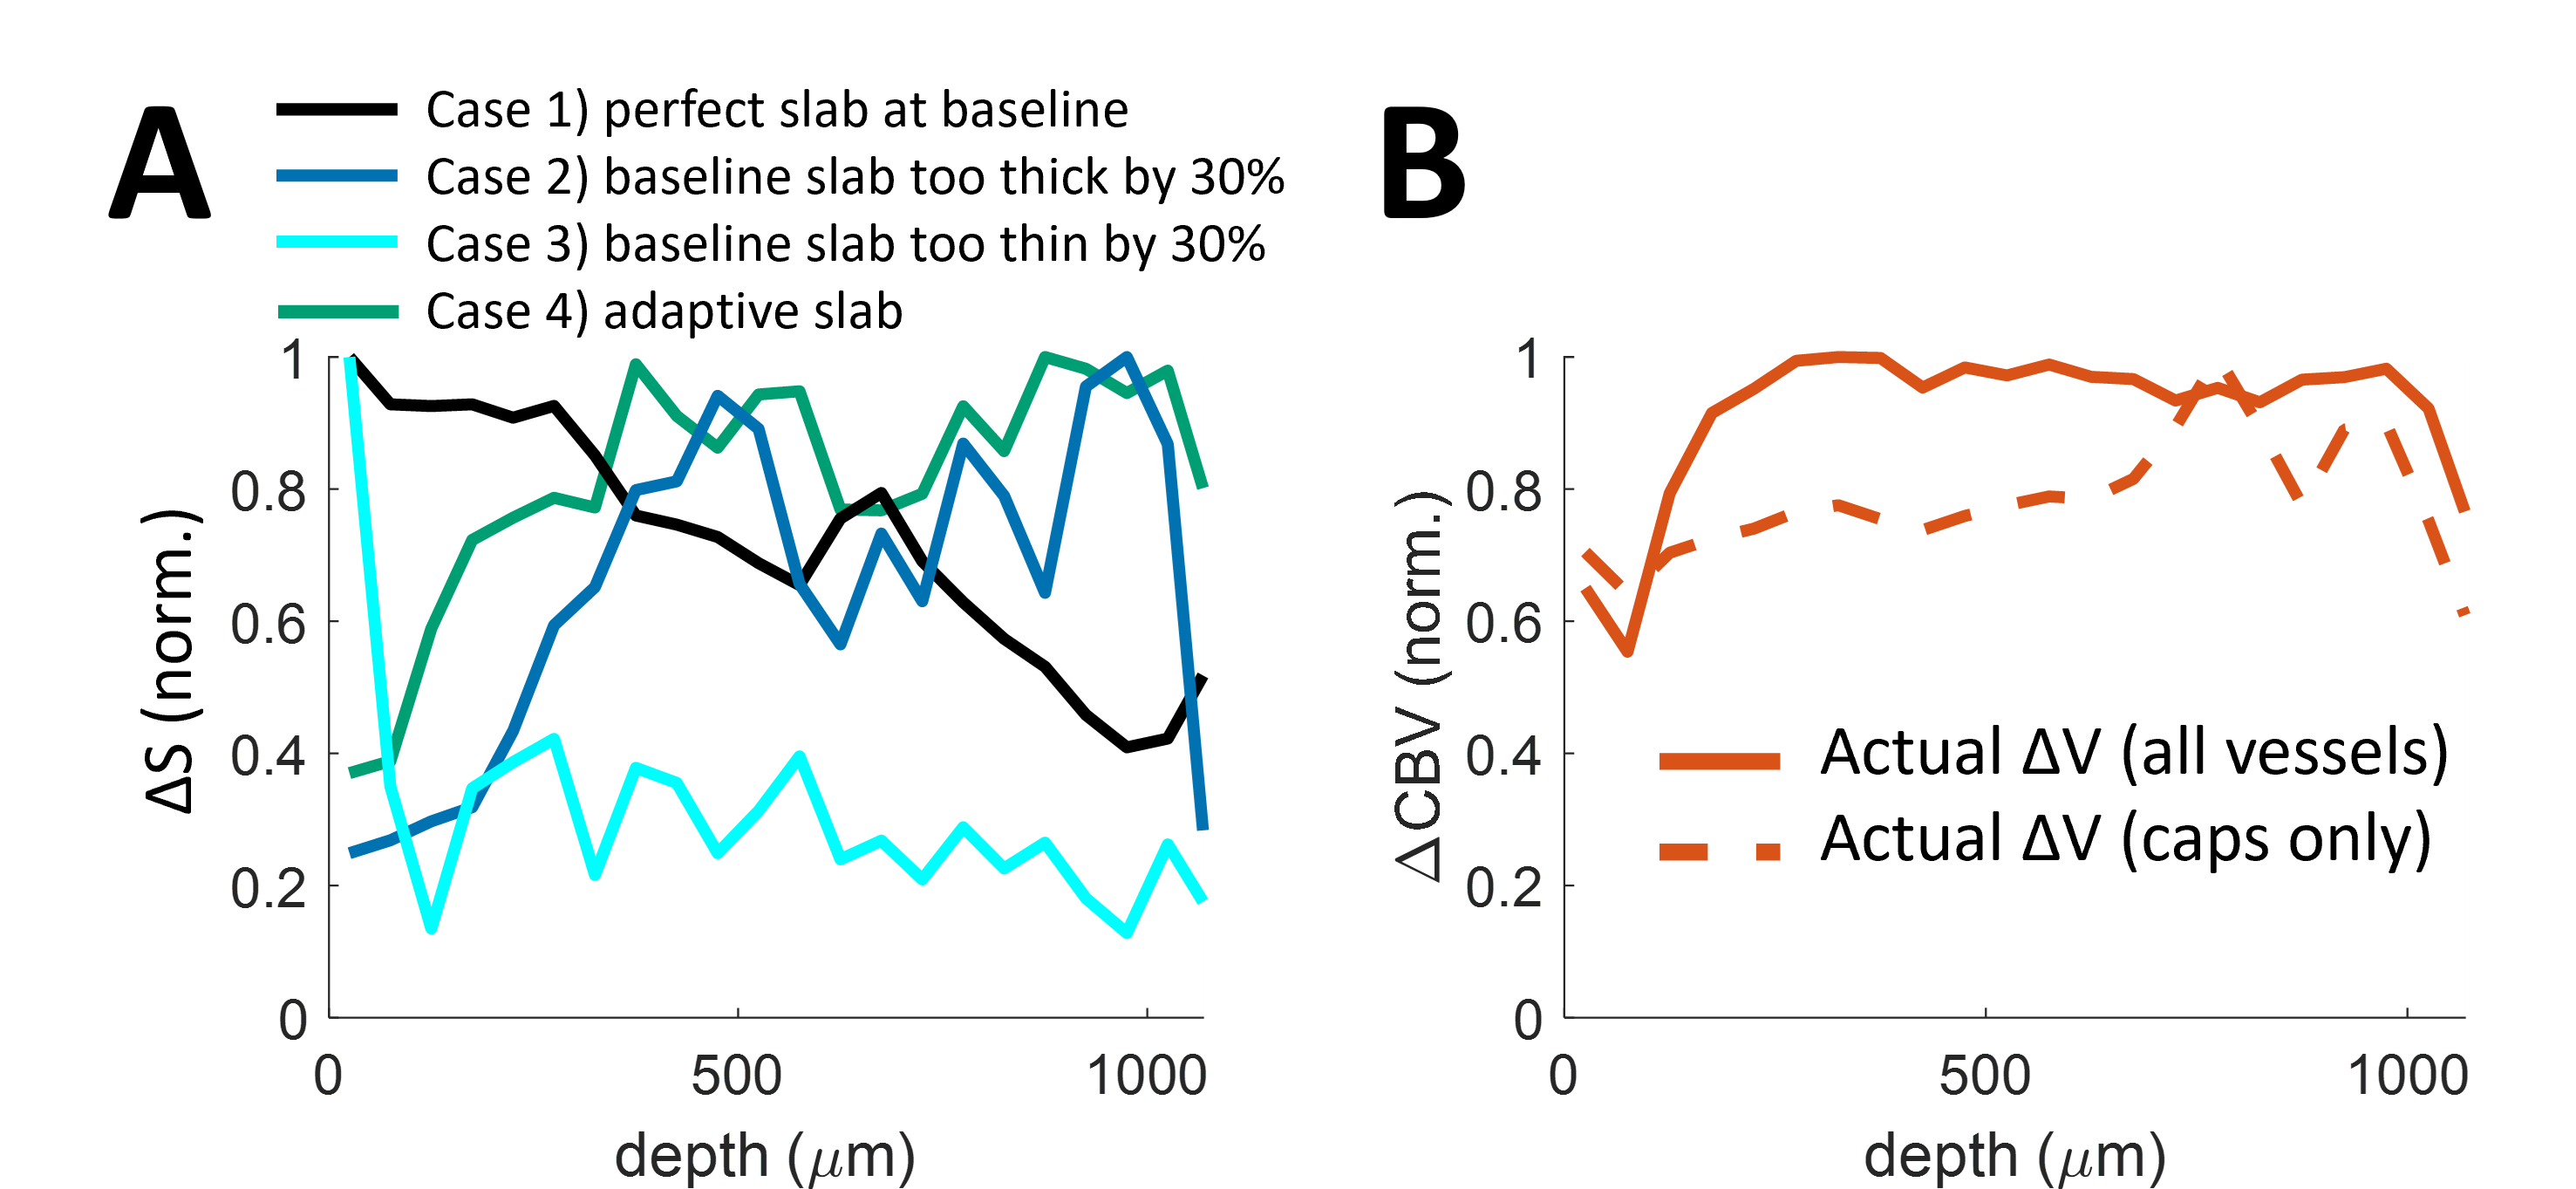
Baseline analysis. The perfect slab thickness (Figure 3) with matching AT and TR results in some vessels having a long TT causing a long DT and thus blood with multiple inversions. Segments with multiple inversions are more common with a too-thick slab. A too-thin slab results in a large portion of un-inverted blood.Activation analysis. During activation, blood velocities increase. This translates to faster AT (a decrease of ~27% in AT, Figure 3). A slab with perfect thickness at baseline results in significant un-inverted blood volume during activation. Increasing baseline slab-thickness by 30% reduces this effect. Conversely, decreasing slab thickness exacerbates this effect. We also show results from an idealized scenario with a dynamic slab (consistently perfect thickness), representing the “best-case” scenario. This case shows little bias between baseline and active states. The cortical depth profiles of each case were compared to CBV (Figure 4). The VASO ΔS profile best matches the ΔCBV profile in Cases 2 and 4, suggesting a thicker VASO slab best reflects CBV changes. None of the VASO profiles match the ΔCBV profile of capillaries only.
Discussion
Our results suggest that the perfect slab thickness results in some blood with nonzero Mz during the blood nulling time. This bias can be reduced by adopting larger thicknesses.Conclusion
We proposed a model incorporating blood Mz dynamics with a VAN for interpreting the SS-SI-VASO sequence. This model can guide optimizing VASO protocols, and may aid interpretation of other, related techniques such as ASL. Our simulated VASO profiles do not perfectly match those from experimental data, which may suggest model improvements with more accurate physics (e.g., water exchange with tissue4,16) and/or physiology (e.g., active capillary dilation4,16).Acknowledgements
We thank Profs. David Boas and David Kleinfeld for providing their Vascular Anatomical Network models. This work was supported in part by the NIH NIBIB (grants P41-EB030006, R01-EB019437, and R01-EB03274, R01-EB033206), NINDS (grant R01-NS128843) the BRAIN Initiative (NIH NIMH grants R01-MH111419 and F32-MH125599 and NINDS grant U19-NS123717), and the MGH/HST Athinoula A. Martinos Center for Biomedical Imaging.References
1. Huber, L. et al. Ultra-high resolution blood volume fMRI and BOLD fMRI in humans at 9.4 T: Capabilities and challenges. NeuroImage 178, 769–779 (2018).
2. Lu, H., Golay, X., Pekar, J. J. & Zijl, P. C. M. van. Functional magnetic resonance imaging based on changes in vascular space occupancy. Magn. Reson. Med. 50, 263–274 (2003).
3. Prsa, M., Galiñanes, G. L. & Huber, D. Rapid integration of artificial sensory feedback during operant conditioning of motor cortex neurons. Neuron 93, 929–939 (2017).
4. Huber, L. et al. Slab-selective, BOLD-corrected VASO at 7 Tesla provides measures of cerebral blood volume reactivity with high signal-to-noise ratio. Magn. Reson. Med. 72, 137–148 (2014).
5. Kim, T. & Kim, S.-G. Temporal Dynamics and Spatial Specificity of Arterial and Venous Blood Volume Changes during Visual Stimulation: Implication for Bold Quantification. J. Cereb. Blood Flow Metab. 31, 1211–1222 (2011).
6. Gagnon, L. et al. Quantifying the Microvascular Origin of BOLD-fMRI from First Principles with Two-Photon Microscopy and an Oxygen-Sensitive Nanoprobe. J. Neurosci. 35, 3663–3675 (2015).
7. Hartung, G., Pfannmoeller, J. P., Berman, A. J. & Polimeni, J. R. Simulated fMRI responses using human Vascular Anatomical Network models with varying architecture and dynamics. in (2022).
8. Hartung, G. et al. Voxelized simulation of cerebral oxygen perfusion elucidates hypoxia in aged mouse cortex. PLoS Comput. Biol. 17, e1008584 (2021).
9. Pfannmoeller, J. et al. Simulations of the BOLD non-linearity based on a viscoelastic model for capillary and vein compliance. ISMRM Annu. Conf. (2021).
10. Báez-Yáñez, M. G., Siero, J. C. & Petridou, N. A statistical 3D model of the human cortical vasculature to compute the hemodynamic fingerprint of the BOLD fMRI signal. bioRxiv (2020).
11. Genois, É., Gagnon, L. & Desjardins, M. Modeling of vascular space occupancy and BOLD functional MRI from first principles using real microvascular angiograms. Magn. Reson. Med. 85, 456–468 (2021).
12. Blinder, P. et al. The cortical angiome: an interconnected vascular network with noncolumnar patterns of blood flow. Nat. Neurosci. 16, 889–897 (2013).
13. Tian, P. et al. Cortical depth-specific microvascular dilation underlies laminar differences in blood oxygenation level-dependent functional MRI signal. Proc. Natl. Acad. Sci. 107, 15246–15251 (2010).
14. Uhlirova, H. et al. Cell type specificity of neurovascular coupling in cerebral cortex. Elife 5, e14315 (2016).
15. Boas, D. A., Jones, S. R., Devor, A., Huppert, T. J. & Dale, A. M. A vascular anatomical network model of the spatio-temporal response to brain activation. NeuroImage 40, 1116–1129 (2008).
16. Krieger, S. N., Streicher, M. N., Trampel, R. & Turner, R. Cerebral blood volume changes during brain activation. J. Cereb. Blood Flow Metab. 32, 1618–1631 (2012).
Figures