0321
Exploring the cerebellar cortical stripes in humans with 7T, motion-corrected, RF-shimmed MRI1Spinoza Center for Neuroimaging, Amsterdam, Netherlands, 2Biomedical Engineering and Physics, Amsterdam University Medical Centers, Amsterdam, Netherlands, 3Computational and Cognitive Neuroscience and Neuroimaging, Netherlands Institute for Neuroscience, Amsterdam, Netherlands, 4Department of Biomedical Engineering and Physics, Amsterdam University Medical Centers, Amsterdam, Netherlands, 5Cognitive and Systems Neuroscience Group, Swammerdam Institute for Life Sciences, Amsterdam, Netherlands, 6Research Priority Area Amsterdam Brain and Cognition, University of Amsterdam, Amsterdam, Netherlands, 7Full Brain Picture Analytics, Leiden, Netherlands, 8Integrative Model-Based Cognitive Neuroscience Unit, University of Amsterdam, Amsterdam, Netherlands
Synopsis
Keywords: fMRI Analysis, Brain, cerebellum, high-field, motion correction
Motivation: The cerebellar cortex is organized in stripe-like clusters, similar to the neocortical layers/columns. The cerebellar anatomical complexity and lack of non-invasive methods makes their detection in humans challenging.
Goal(s): To determine if the human cerebellum shows stripe-like patterns as observed in animals.
Approach: We employed high-resolution, motion-corrected, RF-shimmed, 7T MRI to construct detailed cerebellocortical surfaces. We examined the presence of stripes across fMRI paradigms, their relationship to macrovasculature and variability. We additionally used immunohistochemistry for validation.
Results: We observed consistent stripe-like patterns in the human cerebellum. These patterns were not associated with macrovasculature and conformed with immunohistochemistry, indicating a neuronal origin.
Impact: Cerebellar stripes are a widely-known functional-organization feature but unreported in humans. Here, we combine motion-corrected, 7T-(f)MRI and immunohistochemistry to demonstrate stripe-like patterns in humans. This may provide a new paradigm for cerebellar function, akin to the discoveries in neocortical layers.
Introduction
Neurons with shared functional properties often cluster together, e.g. in the cortical layers and columns found across the mammalian phylogeny, which can now be probed non-invasively in humans using fMRI1. A similarly-prevalent functional organization is the clusters of cerebellar Purkinje neurons that have distinct input/output, electrophysiological properties and protein expression, most notably zebrin-II2. These clusters are consistently arranged in stripe-like patterns that traverse the cerebellar cortex. While these stripes have been reported across the vertebrate phylogeny, they have rarely been reported in humans3, due to the intense cerebellar foliation that necessitates 3D techniques and the lack of appropriate non-invasive methods4. Here we utilize high-resolution, 7T, motion-corrected, RF-shimmed MRI, resolution-preserving analysis techniques, a somatomotor fMRI paradigm and immunohistochemistry to investigate the presence of cerebellar stripes in humans.Methods
4 participants (2women; age-range=22-42years) were scanned in an Achieva 7T (Philips, Best, Netherlands) using an 8Tx/32Rx whole-head coil (NovaMedical, Wilmington, USA) with an MP2RAGE (FOV=210x120x60mm3, TE/TR=3.1/7ms, TI1/TI2/TRshot=1000/2900/5000ms, flip-angle=7/5o, nominal-voxel-size=0.4mm isotropic, SENSEy/z=1.5/1, TAMP2RAGE=14min). MP2RAGE shots were interleaved with fat navigators: 3D-EPIs with a fat-selective binomial excitation pulse; FOV=240x240x160mm3, voxel-size=2mm isotropic, TE/TR/TAvolume=1.88/5.65/550ms, flip-angle=1o, SENSEy/z=4/2). A prospective-motion-correction algorithm realigned the fat navigators and updated the FOV online (Fig.1A)5.A 3D-EPI cerebellar slab was recorded (FOV=182x60x186mm3, TE/TR=21/68ms, flip-angle=20°, voxel-size=1mm isotropic, SENSEy/z= 2.6/3.27, TA3DEPI=3.3s) while a somatomotor task was performed (index finger-flexing, extending, passive stroking, 12s ON/6s OFF, duration=15min). A similar finger-flexing task (30s ON/30s OFF, duration=5min) was acquired on a different day using the same 3D-EPI, as well as a shorter-TE 3D-EPI (FOV=182x60x186mm3, TE/TR=11/29ms, flip-angle=12°, voxel-size=1.4mm isotropic, SENSEy/z= 1.2/3.7, TA3DEPI=2.5s). For two participants, a higher-resolution venogram was recorded (3D-EPI, FOV=210x120x60mm3, TE/TR=30/120ms, flip-angle=20°, voxel-size=0.6mm isotropic, SENSEy/z= 1.5/1.5, TAvenous=5min, 5averages). A DREAM B1+ was acquired for phase-shimming over the cerebellum (FOV=224×224×168mm3, TE/TR=3/6ms, flip-angle=7°, voxel-size=3.5mm isotropic, TADREAM=1min). The study protocol was approved by the local ethical committee.
The MP2RAGE was denoised/transmit-field debiased (Fig.1B; ANTs) and the cerebellar white/gray matter were segmented (intensity-based; Fig.1C; Segmentator, Nighres). The cerebellar cortex was densely-tesselated to a mesh (~4.6million vertices; ~25times more than a FreeSurfer neocortex reconstruction; Fig.1D). The fMRI data were motion/distortion corrected, a GLM was fitted (stimulus>rest; FSL) and 6degrees-of-freedom EPI-to-MP2RAGE transform was calculated (ANTs). A venous ROI was defined based on a minimum-intensity-projection. The z-stats-map and venous ROI were sampled onto the cerebellar surface.
For comparison purposes, post-mortem cerebellar tissue was obtained from a human specimen and immunocytochemically labeled with monoclonal anti-Zebrin-II using nickel enhanced 3,3’-diaminobenzidine as a chromogen. The stained section was digitized at 1,200pixes-per-inch (EPSON V700).
Results
Highly-detailed cerebellar cortical surfaces that resolved individual folia were generated from the motion-corrected, RF-shimmed MP2RAGEs (Fig.1D). Finger-flexing resulted in robust cerebellar activation (Fig.2A). Projection of the zstats-map to the high-resolution individual cerebellocortical surface revealed a consistent pattern of stripe-like activations, approximately 1-3mm thick and oriented perpendicularly to the cerebellar fissures, in line with the stripe-patterns observed in animal research. These patterns remained consistent across scanning protocols, fingers, runs and sessions (Fig.2B) and were reproduced across individuals (Fig.2C). Distinct somatosensory paradigms seemed to evoke similar patterns with minimal displacement (Fig.3). This stripe-like orientation did not overlap with the cerebellar macrovasculature (venogram; Fig.4) and was not TE-dependent (Fig.2B), despite the short venous T2* at 7T, suggesting that this activation pattern is not of macrovascular origin. While the zebrin-II stripe-like expression in the Purkinje layer of the cerebellar cortex is more obvious in mice (Fig.5), the human zebrin-stained section also revealed patterns of positive zebrin-II in the Purkinje layer with similar width (~1mm) and orientation to the human fMRI results, further suggesting that these stripe-like fMRI patterns have a neuronal correlation.Discussion and Conclusion
The human cerebellar functional organization is largely unexplored in-vivo beyond its gross anatomical features, such as the lobules9. Here, we integrated optimized high-resolution structural and functional MRI with immunohistochemistry to investigate the presence of a consistent organizational feature in animal literature, known as cerebellar zebrin-stripes, in humans. Using our unique acquisition and processing pipeline, we report stripe-like fMRI patterns that resemble the histologically-observed stripe-like patterns in size and orientation, are within and across-participant and protocol consistent and do not seem to be produced by the cerebellar macrovasculature. While these results need to be confirmed with macrovasculature-insensitive measures, they suggest the presence of a stripe-like functional organization in the human cerebellum across somatosensory paradigms. Given the large surface area of the cerebellar cortex (~80% of the neocortex) and its cognitive and clinical importance9, demonstrating and probing this organization may have far-reaching effects in understanding the role of cerebellum, similar to how the non-invasive visualization of cortical columns and layers enriched our understanding of the human neocortex.Acknowledgements
Nikos Priovoulos is supported by a Dutch Research Council (NWO) grant (OCENW.XS22.4.007) and an Amsterdam Brain and Cognition grant (T0922).Wietske van der Zwaag and Emma J P Brouwer are supported by a Dutch Research Council (NWO)TTW VIDI grant (VI.Vidi.198.016).References
1: Yacoub, 2008, PNAS
2: Sugihara, 2004, Journal of Neuroscience
3: Sillitoe, 2005, ProgBrainRes
4: Priovoulos, 2023, Radiology
5: Andersen, 2022, MRM
6: Sillitoe, 2009, Journal of Neuroscience
7: Delion, 2017, Cerebellum
8: Marzban, 2004, Journal of Neurocytology
9: King, 2019, Nature Neuroscience
Figures
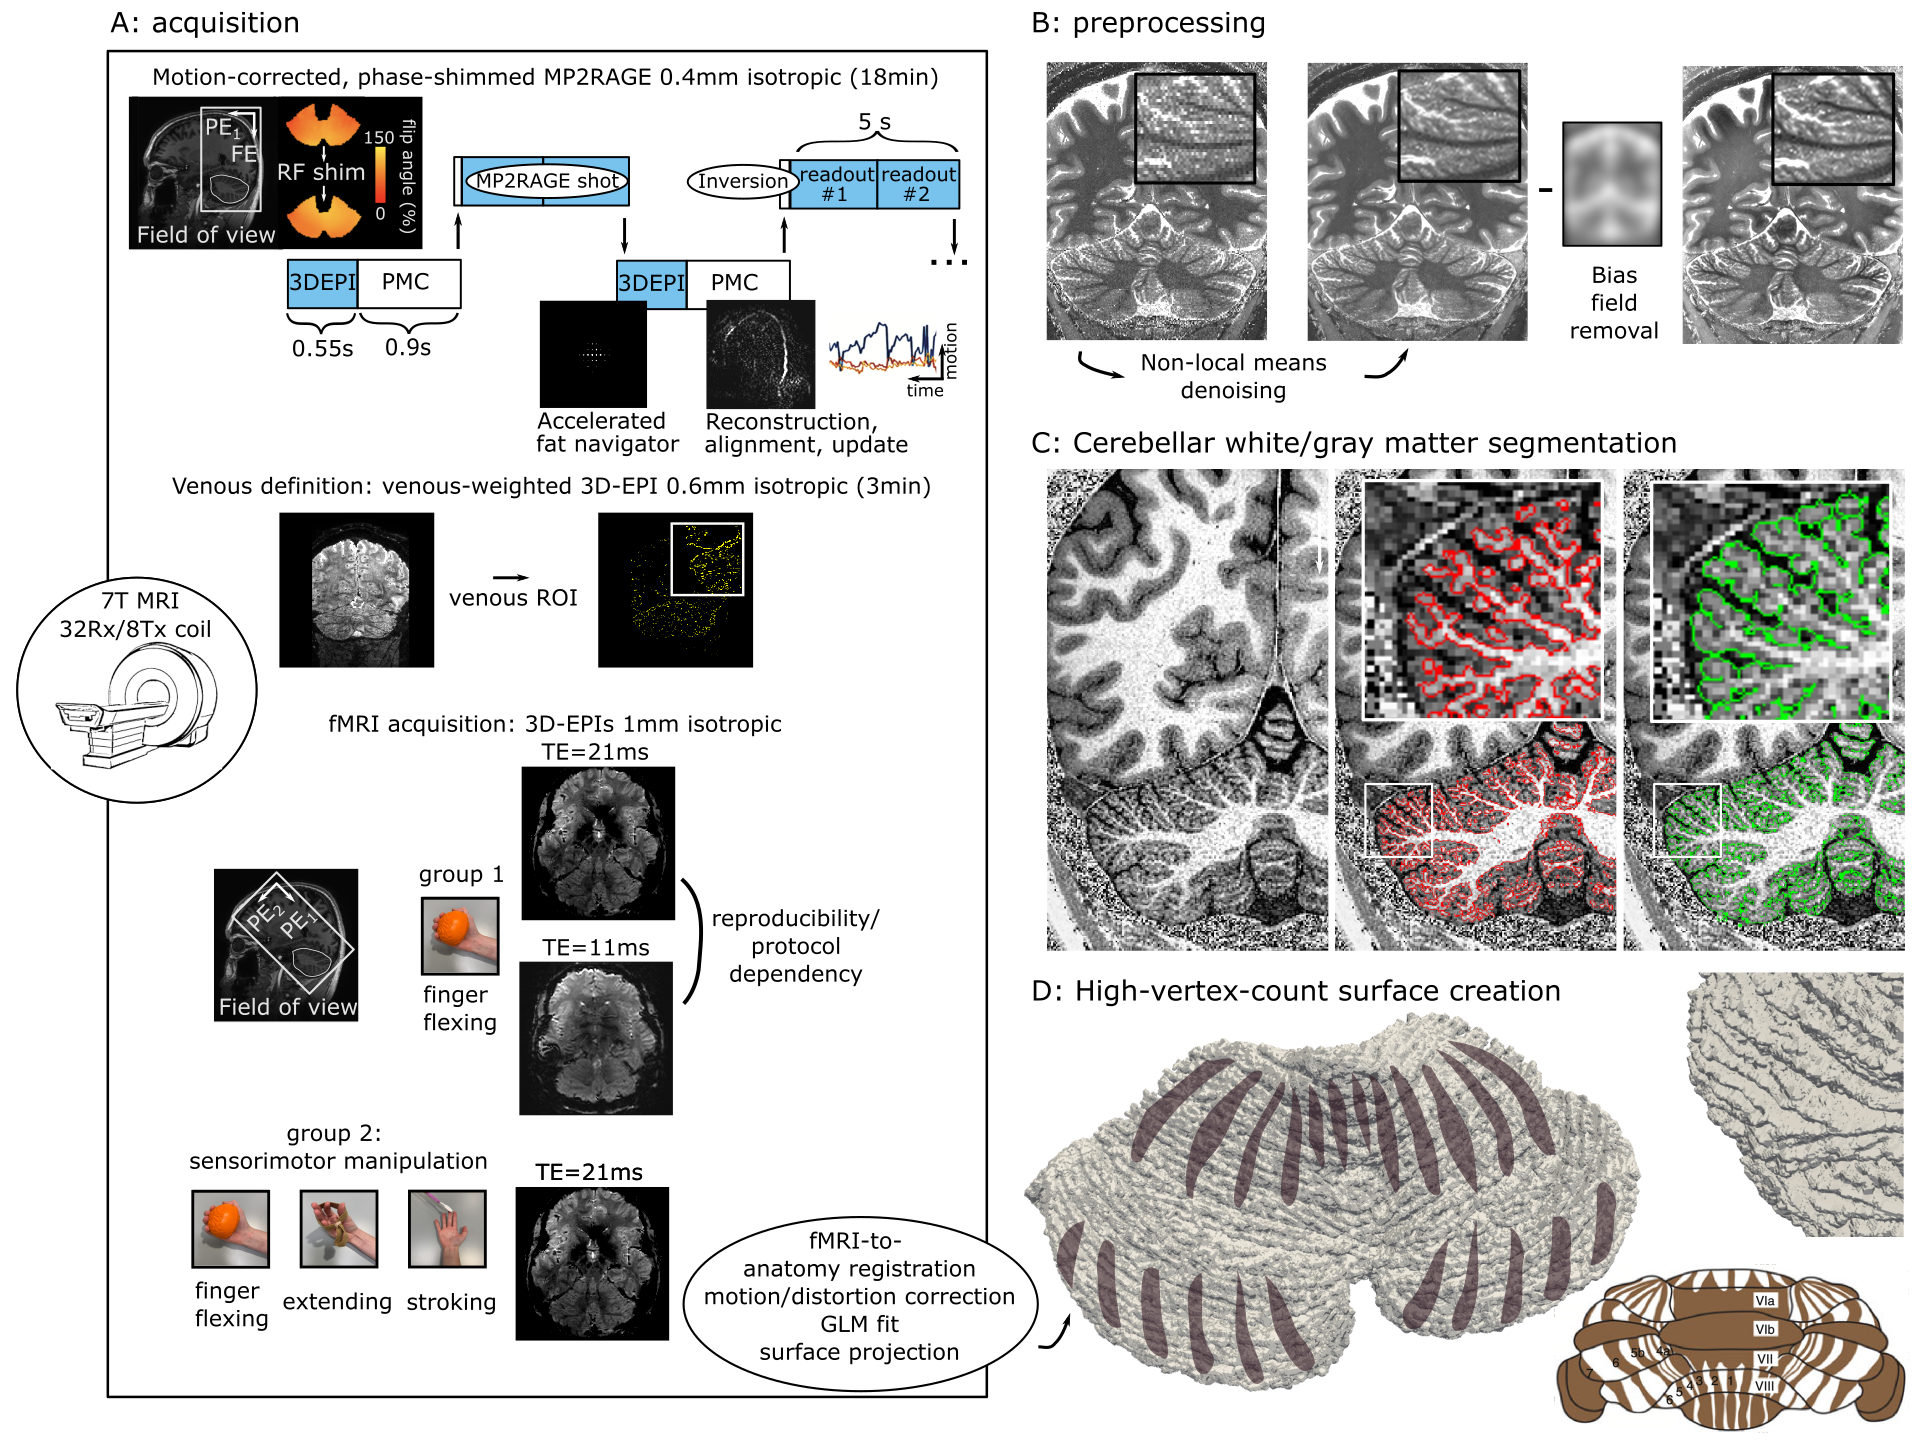
Fig1: A, Acquisition scheme. B, Anatomical preprocessing. C, Example cerebellar segmentation. D, Example cerebellar surface with the hypothesized cerebellar cortical stripes overlaid (brown). Bottom right, cerebellar stripe schematic in mouse brain6.
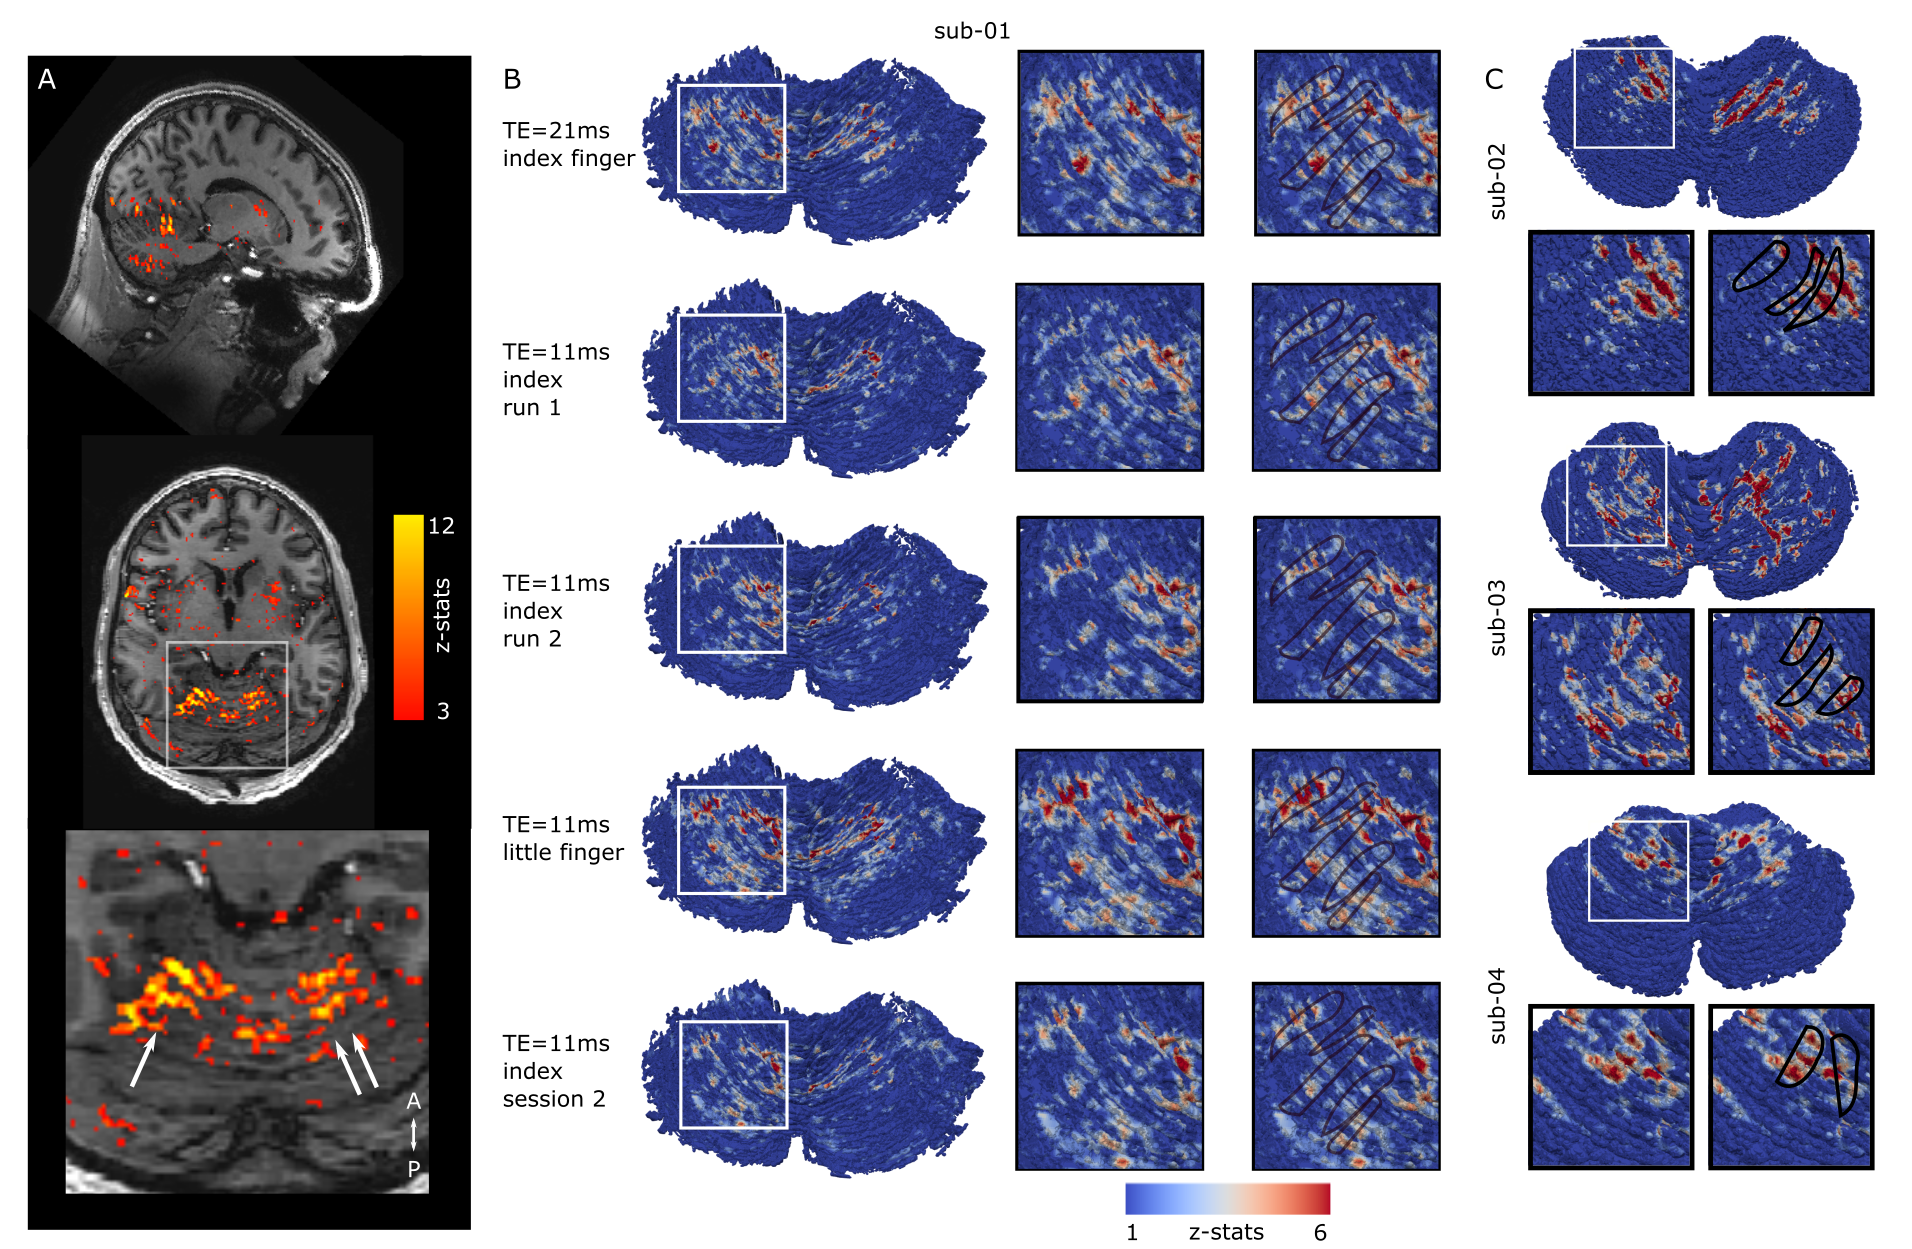
Fig2: A, 3D-space activation in cerebellum for flexing task (3D space; top, sagittal; middle, horizontal; bottom, zoomed). The activation is roughly oriented in the anterior-posterior direction. B, Same-participant activation surface projections (zoomed boxes: right). Stripe-like anterior-posterior oriented activations can be seen. These are spatially consistent across scanning protocols, runs, sessions and fingers (rows; stripe-like patterns outlined in black). C, Individual surface projections (row=participant). Similar patterns can be seen across group.
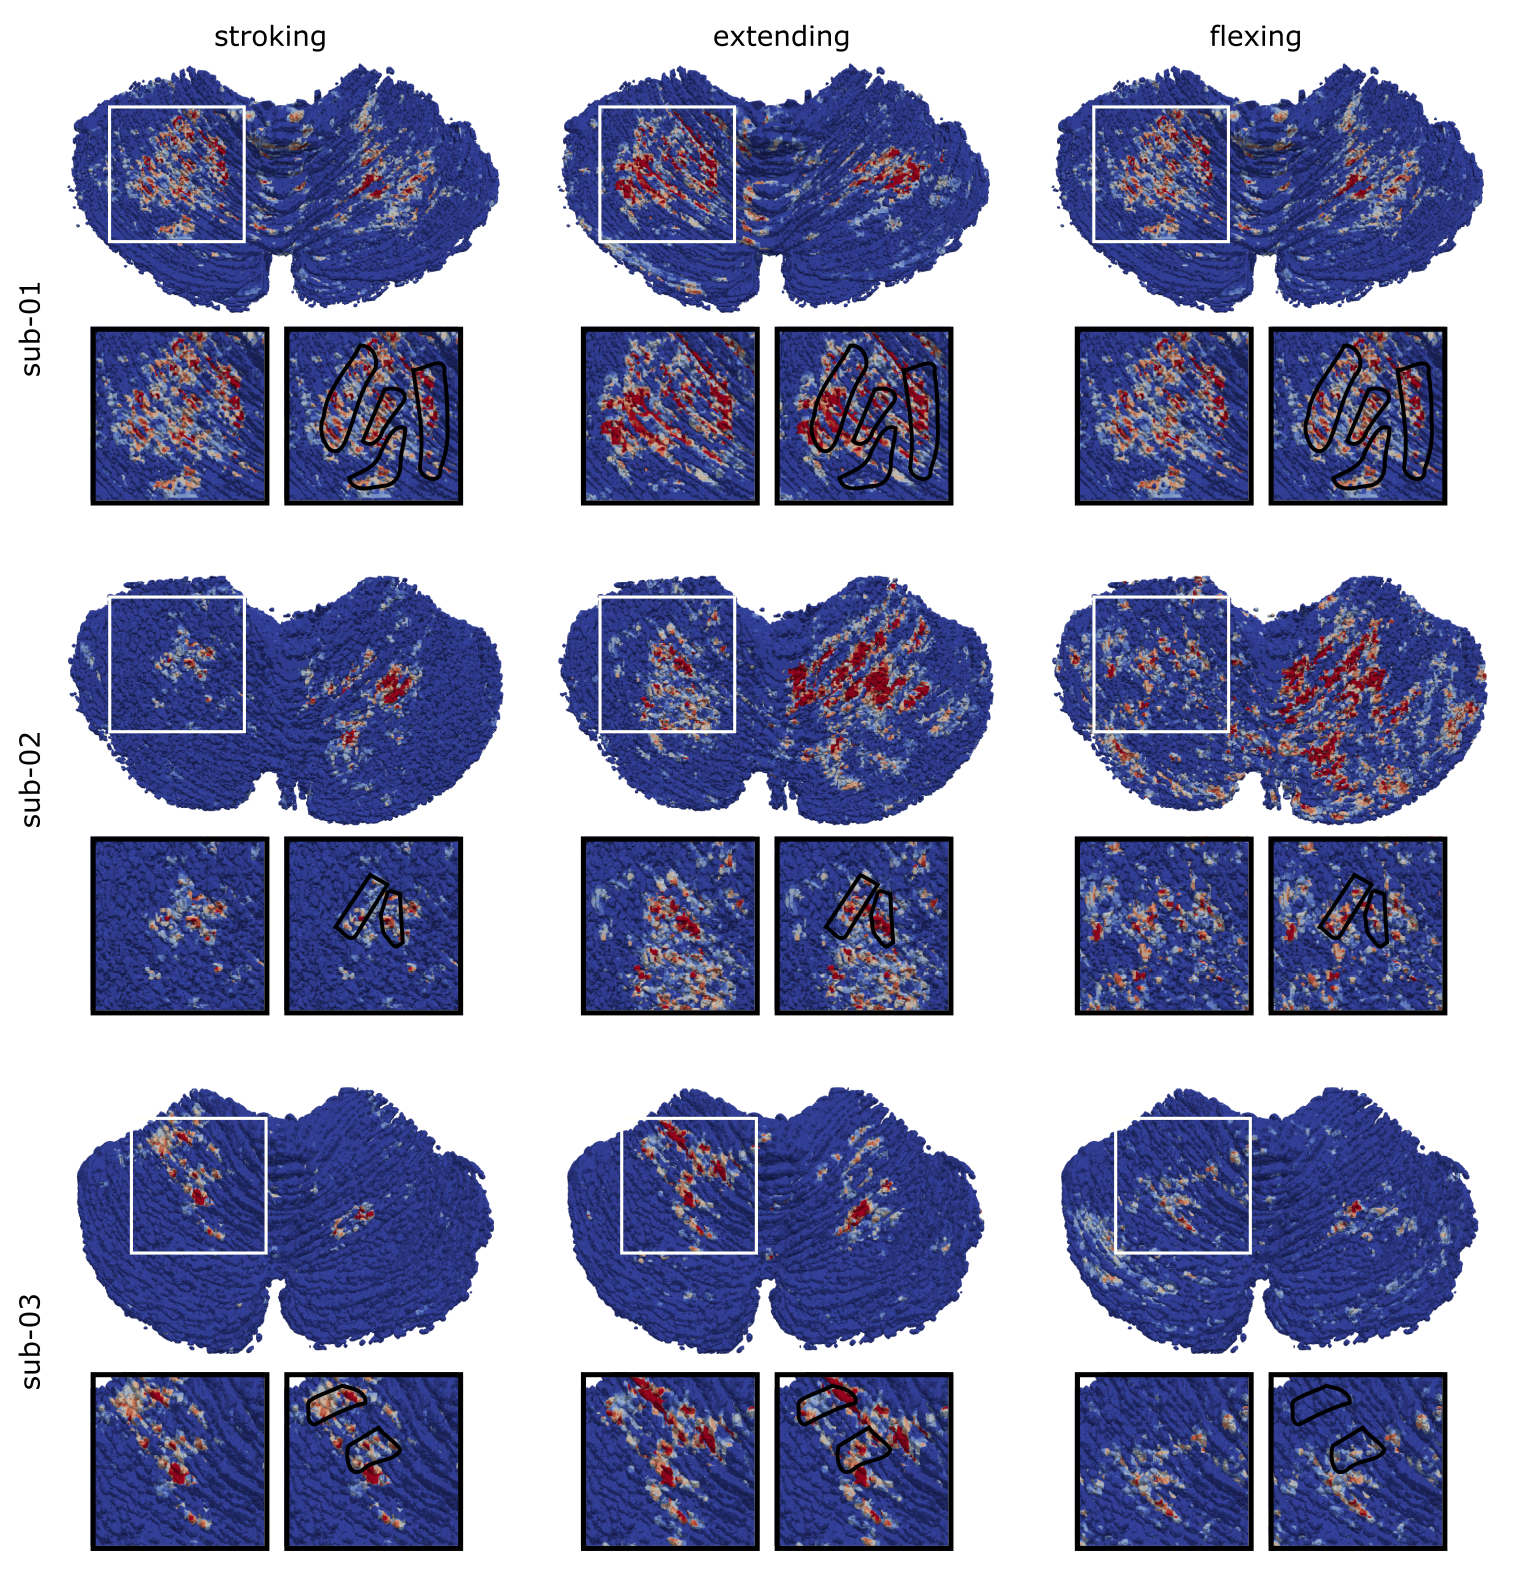
Fig3: Activation surface projections across tasks (column=task; row=participant). Stripe like can be seen across all participants. These are largely consistent across tasks (black outlines).
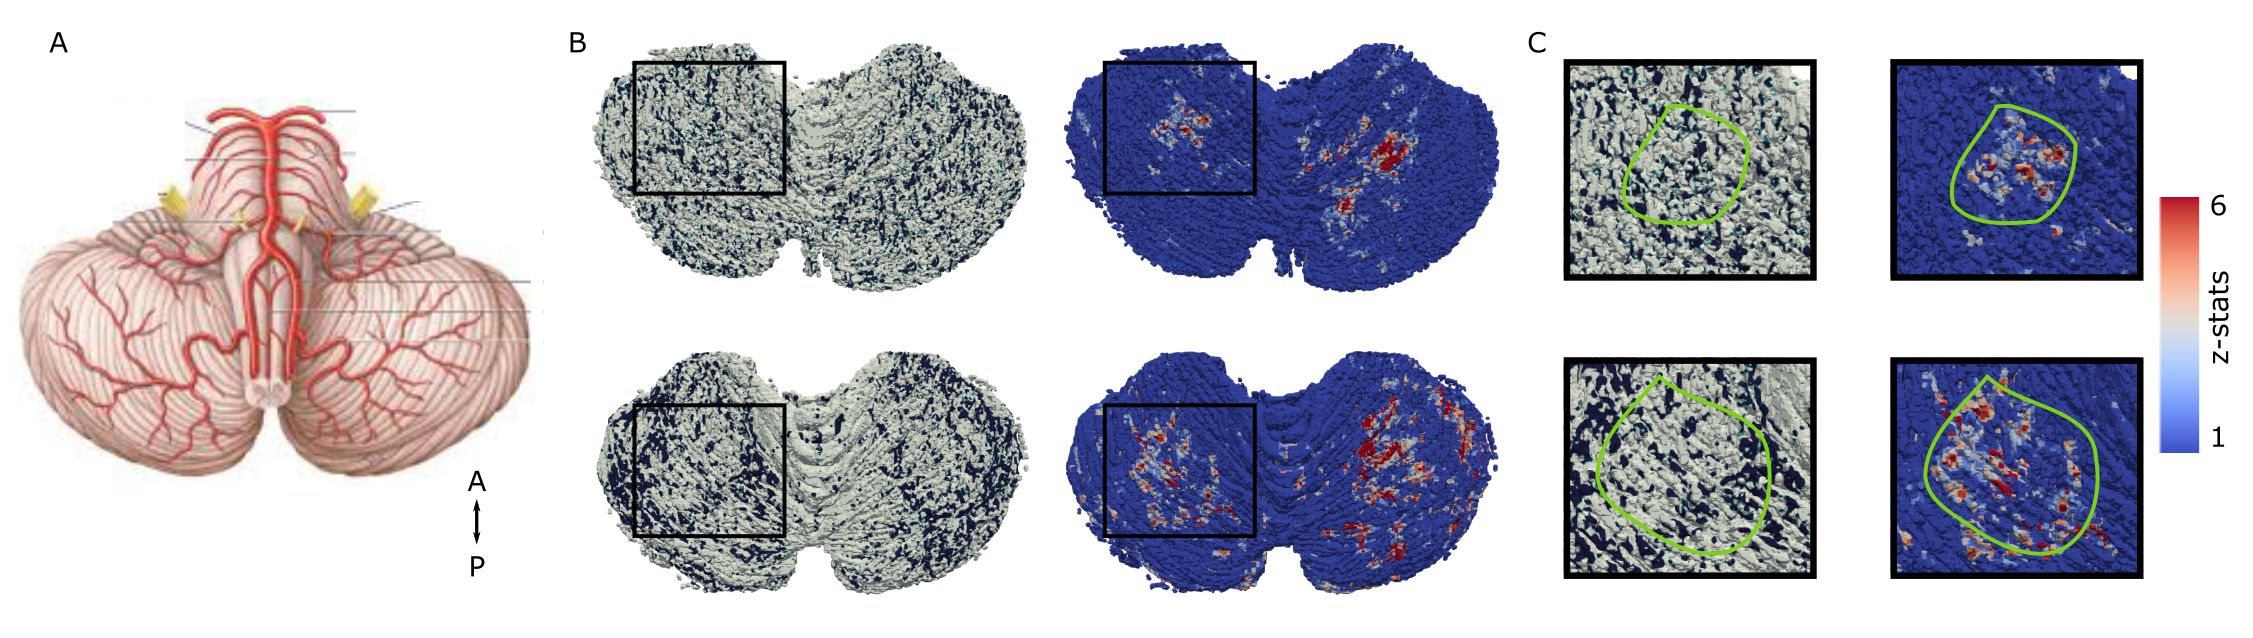
Fig4: A, Human cerebellar vascularization schematic7. Note that no systematic anterior-posterior macrovascular organization exists. B, Venous-ROI surface projection in two subjects (left; black pattern) and matched fMRI response (right) and zoomed box (C). The fMRI stripe-like response (green circle) does not follow the venous pattern.
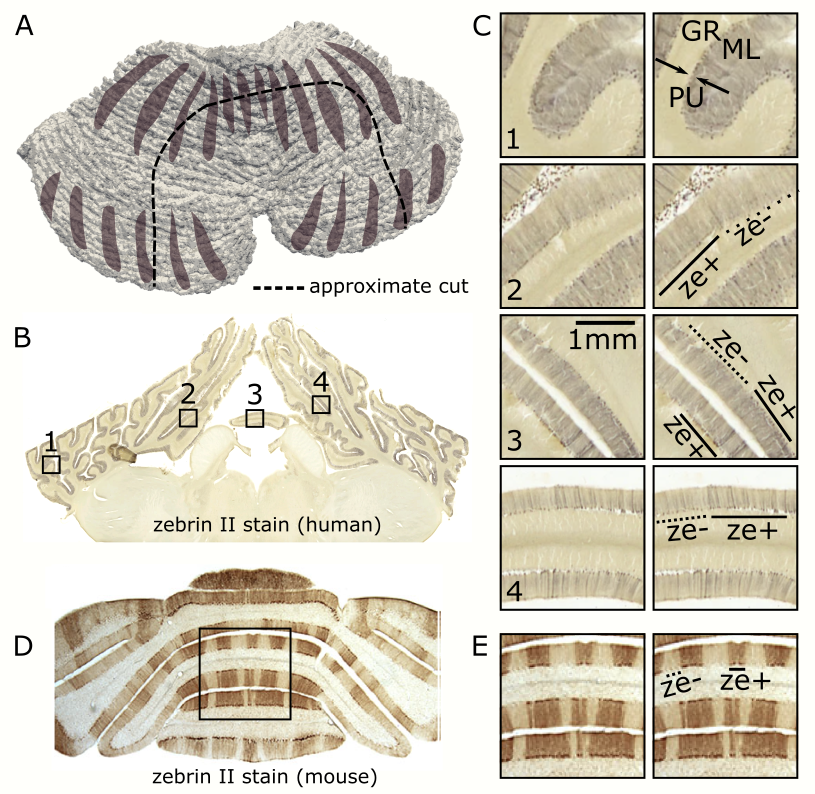
Fig5: Histology comparison. A, Approximate cut. B, Human cerebellar section stained for zebrin (C, close ups). Areas of positive (ze+, line) and negative (ze-, dashed line) zebrin expression approximately 1mm long can be seen in the Purkinje layer (PU) and occasionally in the molecular layer (ML) but not the granular (GL). D, Mouse cerebellar section stained for zebrin from literature8 (E, closeup). The zebrin patterns are clearer in the mouse brain.