0320
Underlying mechanism of hemodynamic and fMRI response to optogenetic stimulation of somatostatin neurons.1Center for Neuroscience Imaging Research (CNIR), Institute for Basic Science (IBS), Suwon 16419, Republic of Korea, Suwon, Korea, Republic of, 2Department of Biomedical Engineering, Sungkyunkwan University, Suwon, Korea, Republic of, 3Department of Intelligent Precision Healthcare Convergence, Sungkyunkwan University, Suwon, Korea, Republic of
Synopsis
Keywords: Functional Connectivity, High-Field MRI, fMRI, interneuron, neurovascular coupling
Motivation: SST neurons, 30% of cortical interneurons, are crucial in interpreting fMRI data and understanding neurovascular coupling within the cortex.
Goal(s): In this study we want to investigate the the SST-induced hemodynamic response
Approach: we used several methods such as neural recording, BOLD-fMRI, and optical intrinsic signaling (OIS) with pharmacological applications.
Results: We observed SST neuron activation causing local neural inhibition, resulting in negative BOLD-fMRI at projection sites. Additionally, it triggered initial NO-induced fast vasodilation, followed by astrocyte-mediated slow vasodilation.
Impact: BOLD-fMRI reflects neural activity changes, yet certain interneurons induce hemodynamic responses without altering neural activity. Studying SST-induced responses is vital for interpreting fMRI.
Introduction
In the cerebral cortex, excitatory and inhibitory neurons constitute 80% and 20% of cortical neurons (1). Unlike excitatory neurons, interneurons have multiple subtypes. Parvalbumin (PV) and somatostatin (SST) neurons constitute up to 40% and 30% of cortical interneurons, respectively (2). Different from PV neurons, which exert perisomatic inhibition, SST neurons appear more involved in controlling synaptic input through dendritic inhibition (3). PV does not contain direct vasoactive peptides, while SST neurons can release various vasoactive neuropeptides, GABA, NO (a powerful vasodilator), and NPY (vasoconstrictor) (4). Activation of SST neurons reduces local excitatory activities (5), but robustly increases the hemodynamic response (5, 6) under anesthesia The source of vasodilation is assumed to be NO (5), but no systematic studies have been performed yet. Here, we investigated the SST-induced hemodynamic response using several methods such as neural recording, BOLD-fMRI, and optical intrinsic signaling (OIS) with pharmacological applications to clarify the source of hemodynamic response.Method
Animals: SOM-cre mice with cortical injection of ChR2-expressing virus to the left forelimb somatosensory area (L-S1) or crossbreed SOM-cre x Ai32 mice (n = 39) with thinned-skull for OIS experiment or fiber implantation for fMRI.Anesthesia: IP injection of an initial mixture of ketamine (Ket: 100mg/kg) and xylazine (Xyl: 10mg/kg), and a supplementary dose (25mg/kg Ket and 1.25mg/kg Xyl).
Stimulation: ChR2 photostimulation was a duration of 5 & 20s, 1-40Hz, 3mW, and 20% of duty cycle. Forepaw somatosensory stimulation is 5Hz, 2ms, 0.5mA with a duration of 5 and 20s.
Functional MRI: BOLD-fMRI (156 × 156 × 500 μm3) with TE/TR of 11ms/1s on a 15.2T scanner.
Optical intrinsic signal imaging: OIS experiment was performed at 530nm (CBV-weighted), 625nm (BOLD-weighted), and 470nm (calcium recording).
Neural recording: 16 channel electrode is perpendicularly inserted up to 1mm in the left forepaw somatosensory area
Results
Firstly, we detected the hemodynamic response induced by optogenetic stimulation of SST neurons at the left forelimb somatosensory area (L-S1) under Ket/Xyl condition by using two-wavelengths optical intrinsic imaging (OIS) (Figure 1A). At different stimulus frequencies, stimulation of SST neurons robustly increases hemodynamic response, similar to forepaw stimulation (pink voxels, Figure 1C, and 1B). With 20s stimulation, SST-induced hemodynamic response increases initially fast, followed by long-lasting vasodilation after stimulus offset (Figure 1D), which is consistent with a previous study (6).Next, we probed the effect of optogenetic stimulation of SST neurons on local neural activity. In this experiment, we used neural recording with a 16-channel electrode perpendicularly inserted at L-S1 (Figure 2A). We found that SST activation significantly suppressed spontaneous spikes at all stimulus frequencies (Figure 2B). Higher frequencies induced more inhibition.
Then we performed BOLD-fMRI responding to optogenetic stimulation at L-S1 SST neurons and to right forepaw stimulation as control. Forepaw stimulation induced positive BOLD responses at both the stimulation site and projection sites (red-yellow voxel, Figure 3C). In contrast, optogenetic stimulation caused a positive BOLD response at the stimulation site, but negative BOLD responses at the projection sites (blue voxel, Figure 3D). This result emphasized that activation of SST neurons caused inhibition of local excitatory neurons, which reduced excitatory inputs at downstream areas.
Interestingly, SST-induced hemodynamic response under both ketamine/xylazine anesthesia and wakefulness has two vasodilation phases; initial fast and long-lasting at post-stimulus. Under awake conditions, the initially fast component was abolished by NO inhibitor (Figure 4E and 4F), while the post-stimulus vasodilation was accompanied by astrocyte activity (Figure 5B and 5C) and completely blocked by SST receptor antagonist (Figure 5G and 5H).
Discussion
Activation of SST neurons induces local inhibition and consequently reduces excitatory inputs at the downstream areas, resulting in negative BOLD responses. However, hemodynamic responses are complex with SST-induced vasodilation and suppressed excitatory neuron-driven vasoconstriction. Our hemodynamic response to optogenetic stimulation of SST neurons has three phases; fast vasodilation, following reduction potentially due to excitatory neuron-driven vasoconstriction, and post-stimulus vasodilation. The initial fast vasodilation is due to NO, potentially released from NO-expressing SST neurons, since inhibiting NO synthase by L-NAME abolished the initial vasodilation. When NO-driven vasodilation is suppressed, inhibition-induced vasoconstriction is more evident. The post-stimulus vasodilation is mediated by astrocytes through the released SST peptides, which are abolished by the SST receptor antagonist. Later vasodilation is not associated with post-stimulus MUA but is closely dependent on the cumulative SOM activities (stimulation duration and frequency).In sum, we observed that the activation of SST neurons causes local inhibition at the stimulation site that leads to a negative BOLD-fMRI response at the projection sites. However, the activation of SST neurons induced a NO-induced fast vasodilation followed by an astrocyte-mediated slow vasodilation.
Acknowledgements
This study was supported by the Institute of Basic Science (IBS-R015-D1).References
- H. S. Meyer et al., Inhibitory interneurons in a cortical column form hot zones of inhibition in layers 2 and 5A. P Natl Acad Sci USA 108, 16807-16812 (2011).
- R. Tremblay, S. Lee, B. Rudy, GABAergic Interneurons in the Neocortex: From Cellular Properties to Circuits. Neuron 91, 260-292 (2016).
- J. Urban-Ciecko, A. L. Barth, Somatostatin-expressing neurons in cortical networks. Nat Rev Neurosci 17, 401-409 (2016).
- I. Yavorska, M. Wehr, Somatostatin-Expressing Inhibitory Interneurons in Cortical Circuits. Front Neural Circuit 10 (2016).
- M. B. Krawchuk, C. F. Ruff, X. Yang, S. E. Ross, A. L. Vazquez, Optogenetic assessment of VIP, PV, SOM and NOS inhibitory neuron activity and cerebral blood flow regulation in mouse somato-sensory cortex. J Cereb Blood Flow Metab 40, 1427-1440 (2020).
- L. Lee et al., Key Aspects of Neurovascular Control Mediated by Specific Populations of Inhibitory Cortical Interneurons. Cereb Cortex 30, 2452-2464 (2020).
Figures
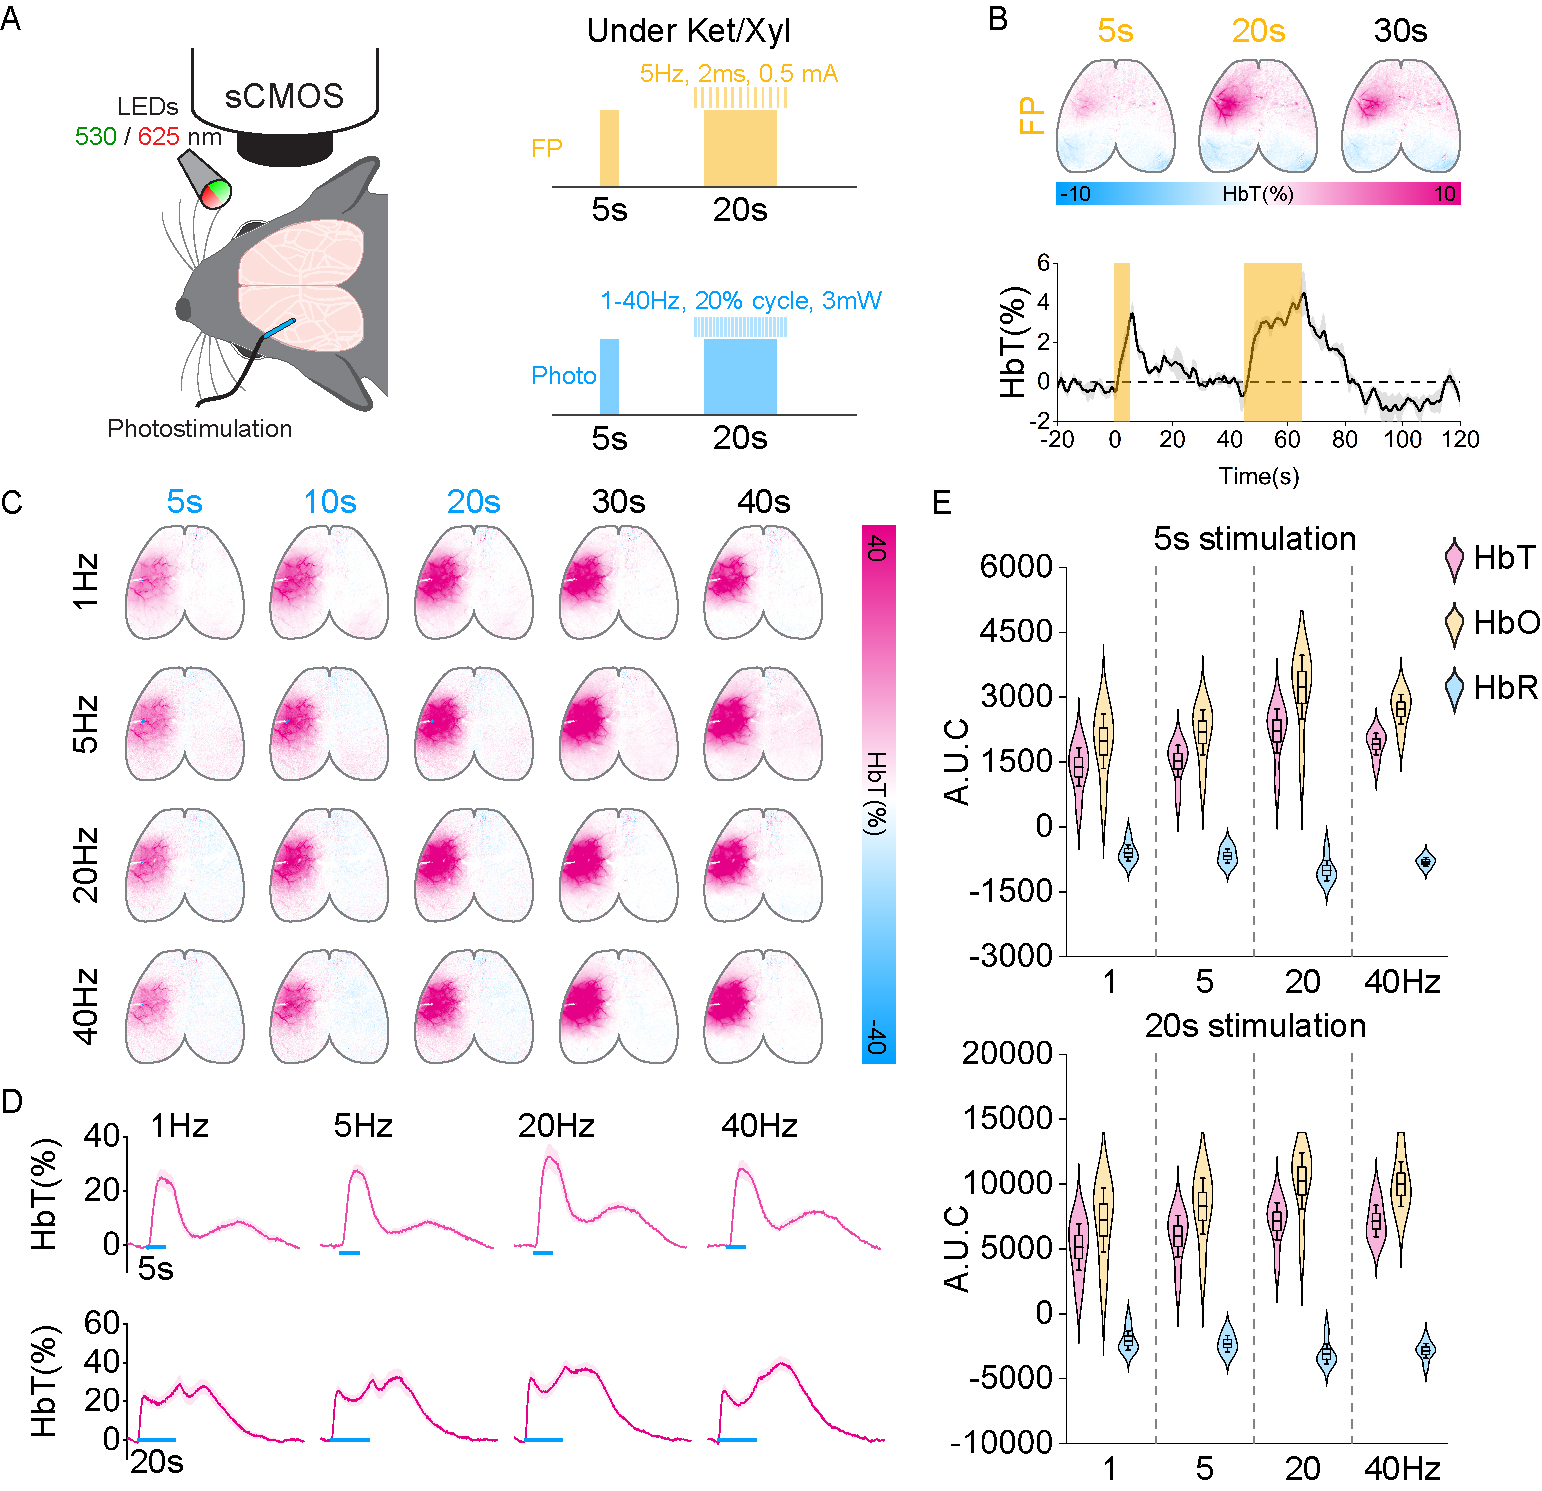
Figure 1. Hemodynamic responses induced by forepaw stimulation and photostimulation of SST neurons at 1, 5, 20, and 40 Hz under Ket/Xyl condition.
A. Schematic diagram of OIS experiment with forepaw and photostimulation. B. Hemodynamic response induced by forepaw stimulation (n=2).
C. Representative HbT activation maps induced by 20s photostimulation of SST neurons at different frequencies. The color bar indicates the total hemoglobin change.
D. Time courses of total hemoglobin (HbT) changes at the stimulation site. E. Quantification of HbT timecourses is shown in Figure D.
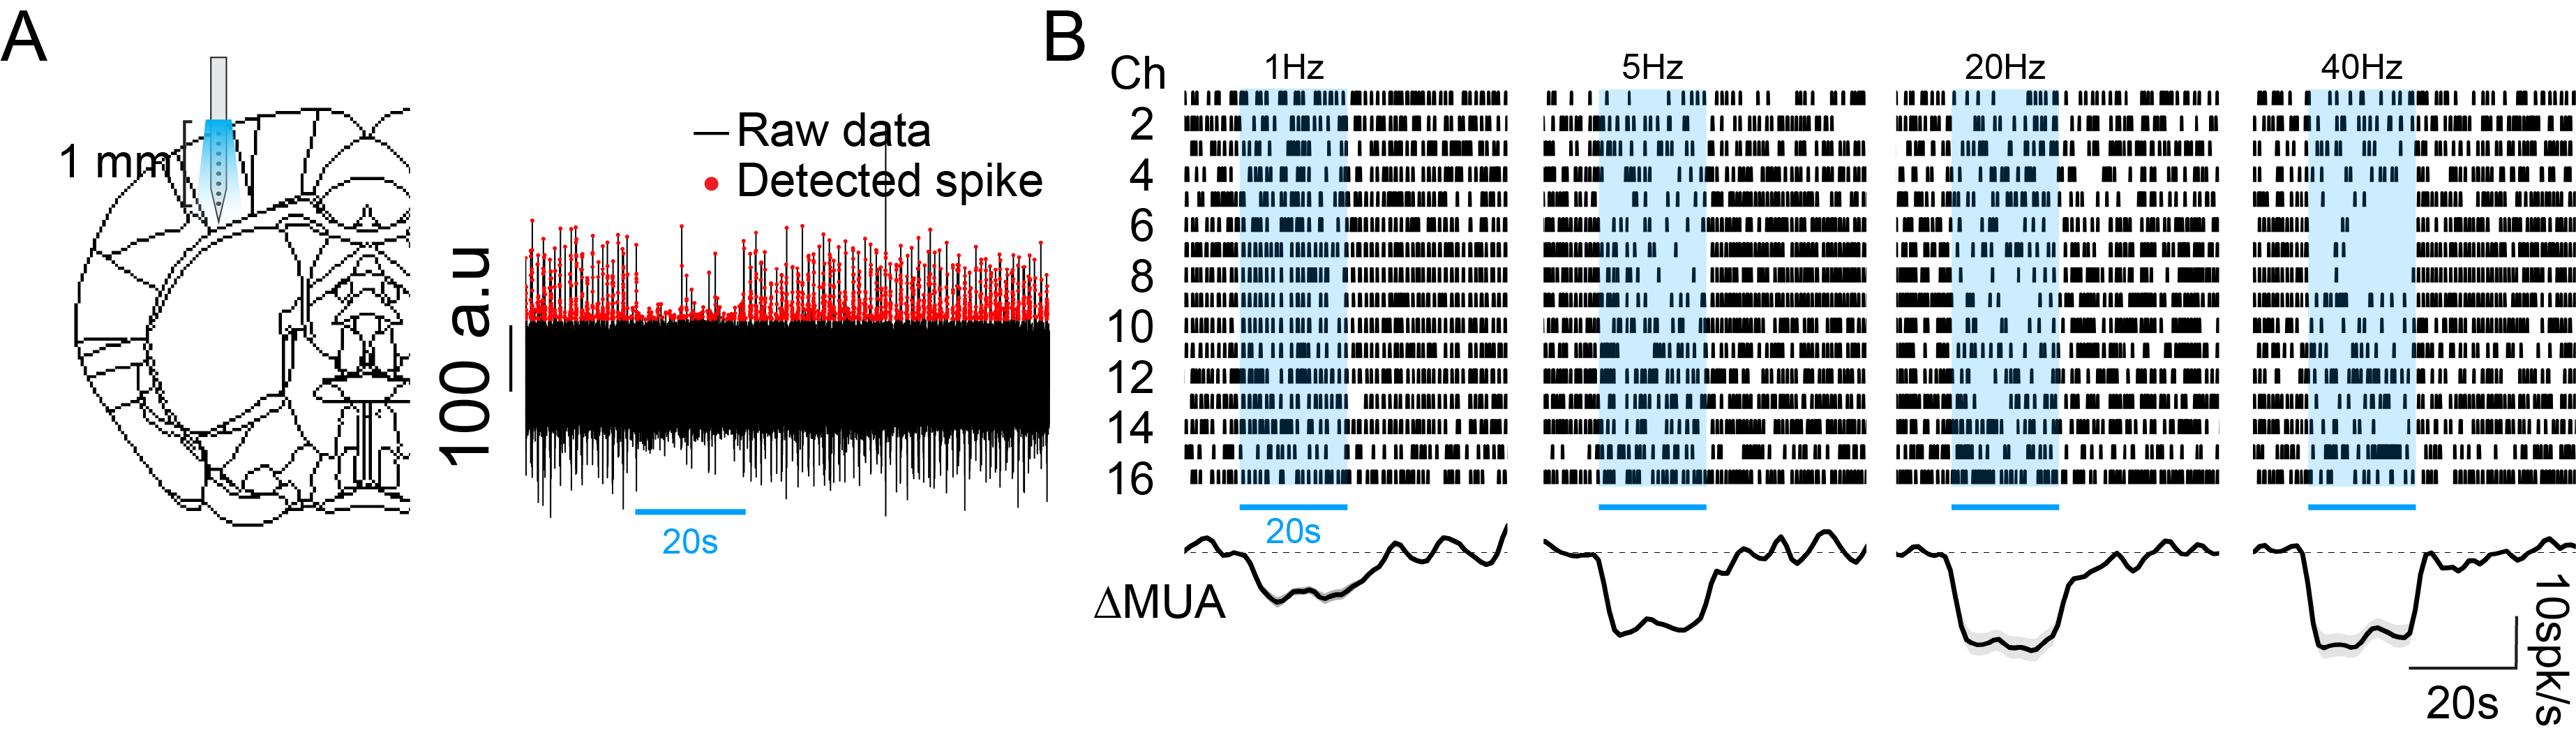
Figure 2. Multiunit activities responding to 20s photostimulation of SST neurons under Ket/Xyl condition.
A. Schematic diagram of 16-channel neural recording experiment.
B. Representative raster plots and multiunit activity changes (ΔMUA) correspond to the photostimulation of SST neurons at different stimulation frequencies.
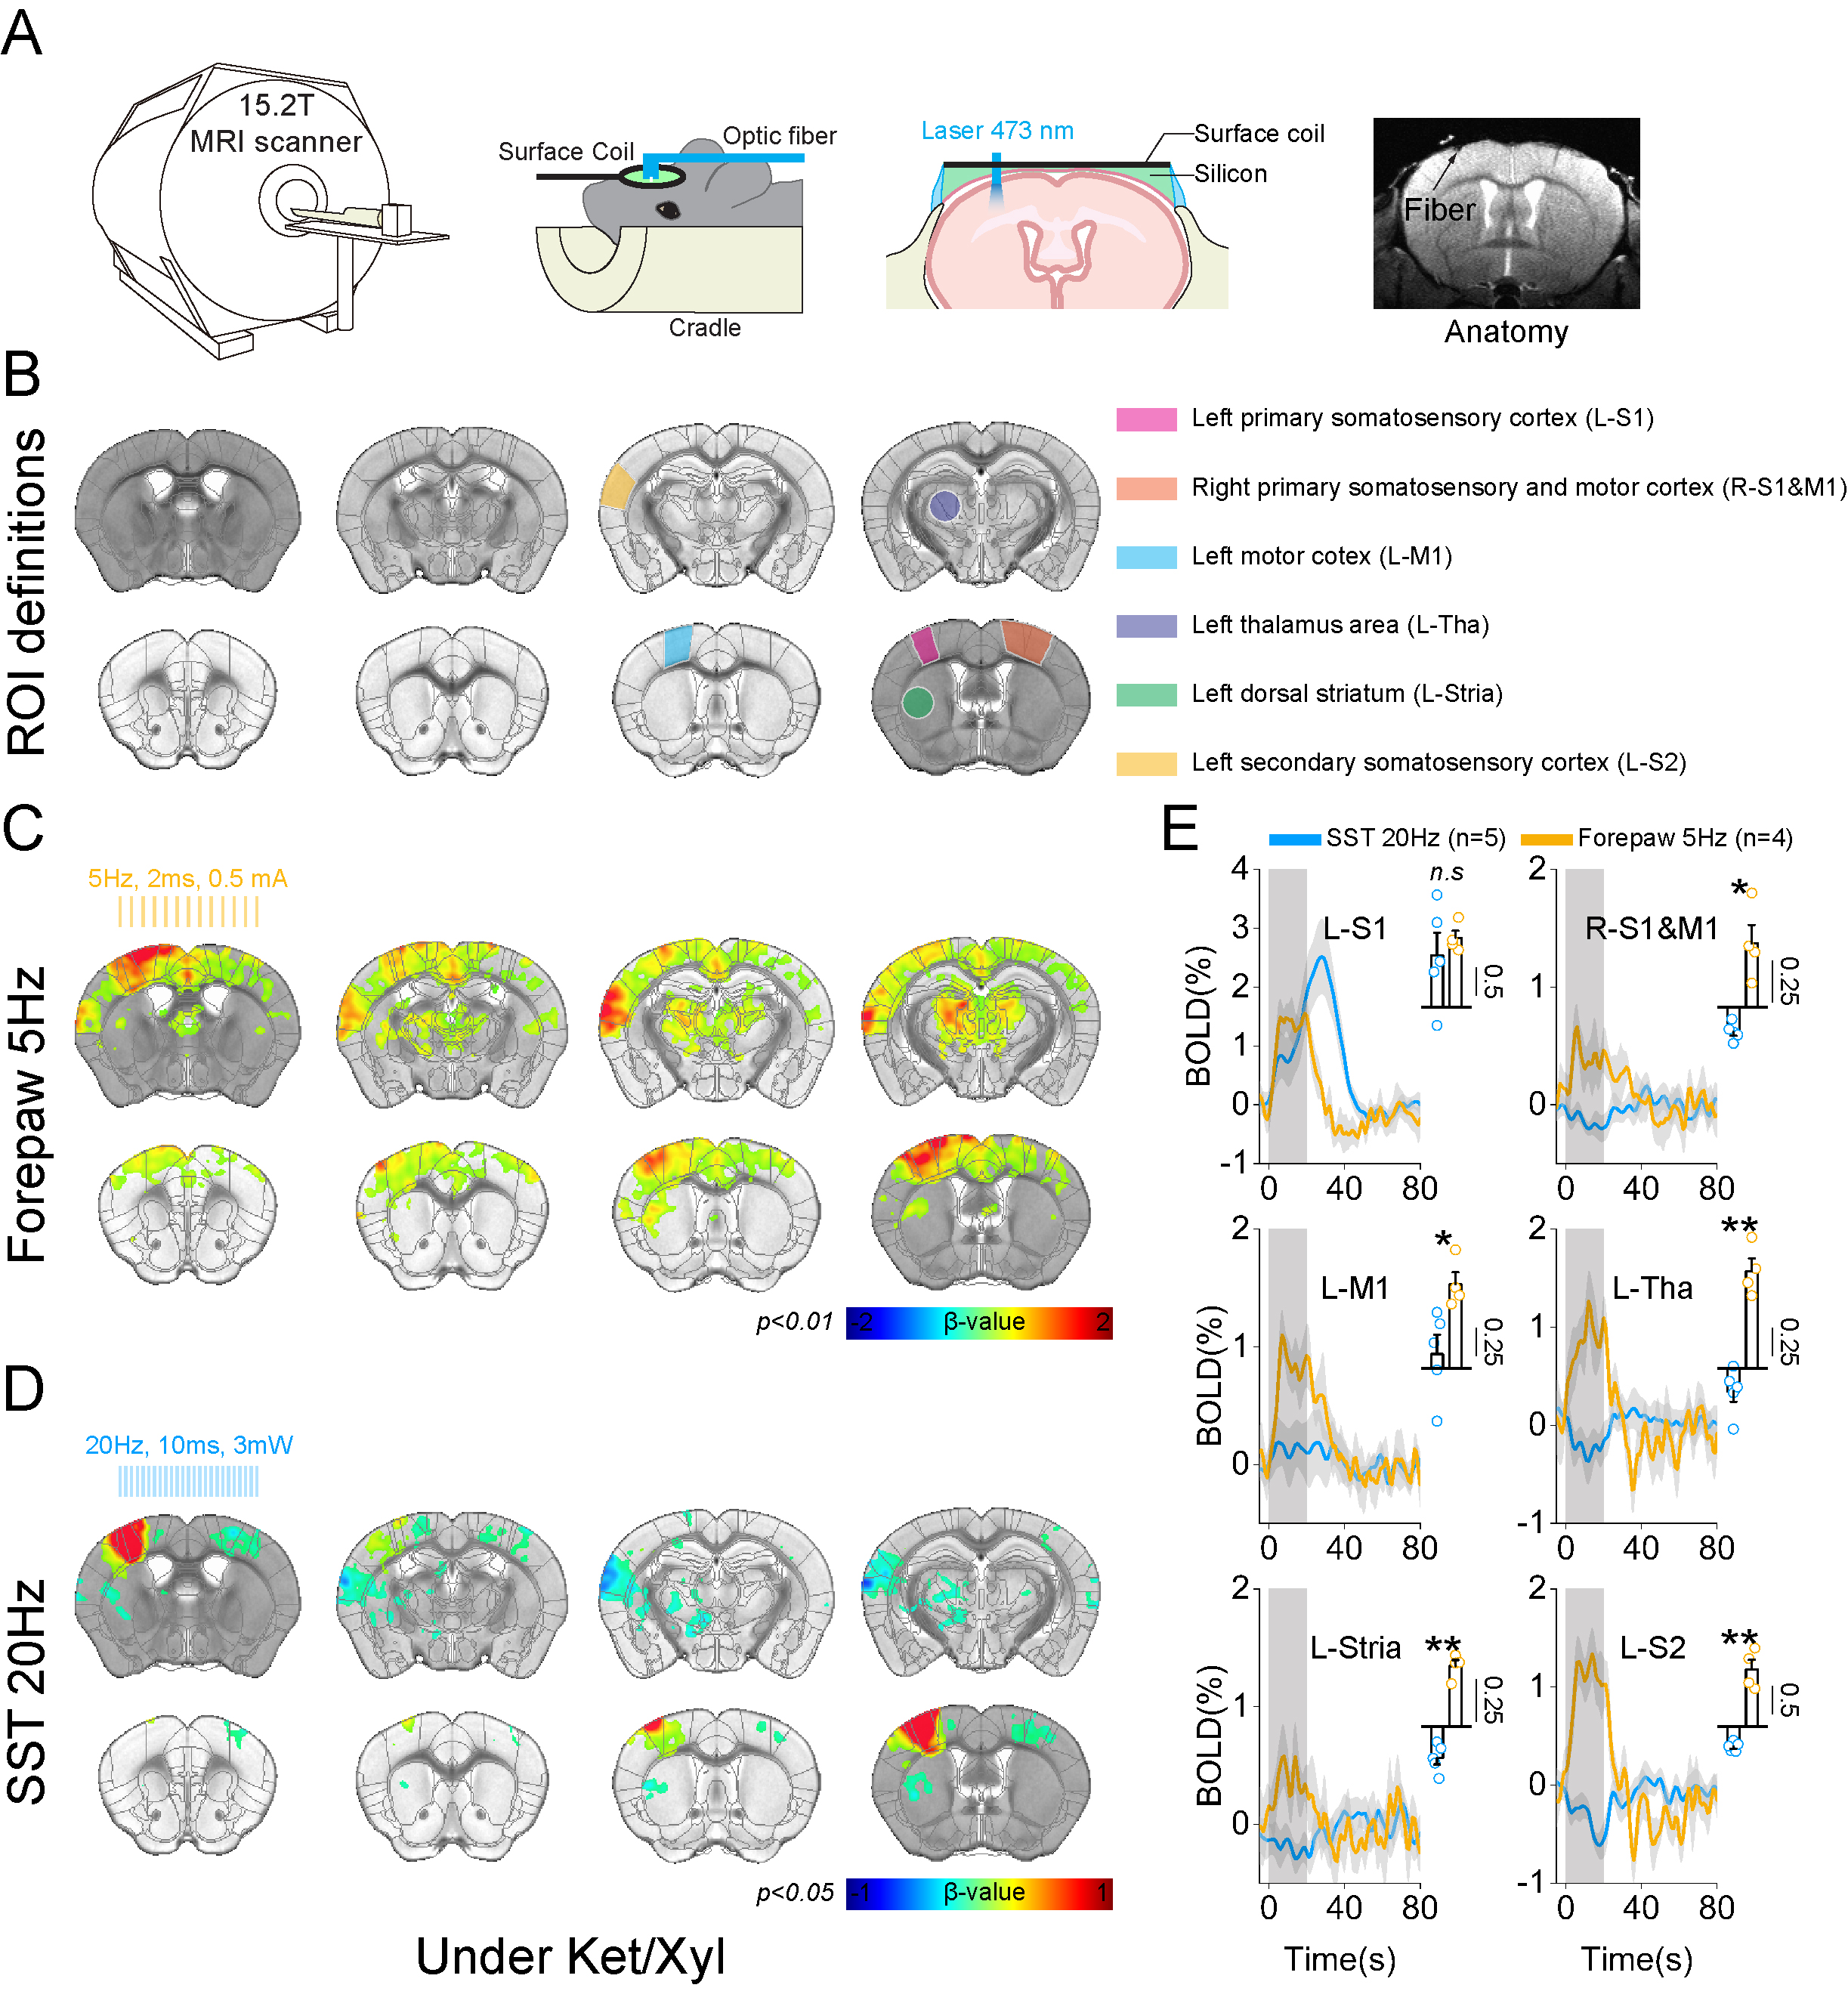
Figure 3. High-field BOLD fMRI responses to 20Hz photostimulation of SST neurons and forepaw somatosensory stimulation under Ket/Xyl condition.
A. Schematic diagram of optogenetic fMRI experiment with fiber implantation at the left somatosensory area (L-S1).
B. ROIs related to L-S1 and its projection site, which is based on the mouse brain atlas.
C-D. 15.2T BOLD fMRI responses evoked by forepaw and optogenetic stimulation.
E. Timecourses and mean BOLD changes during the stimulation period responding to forepaw stimulation and photostimulation for each ROI.
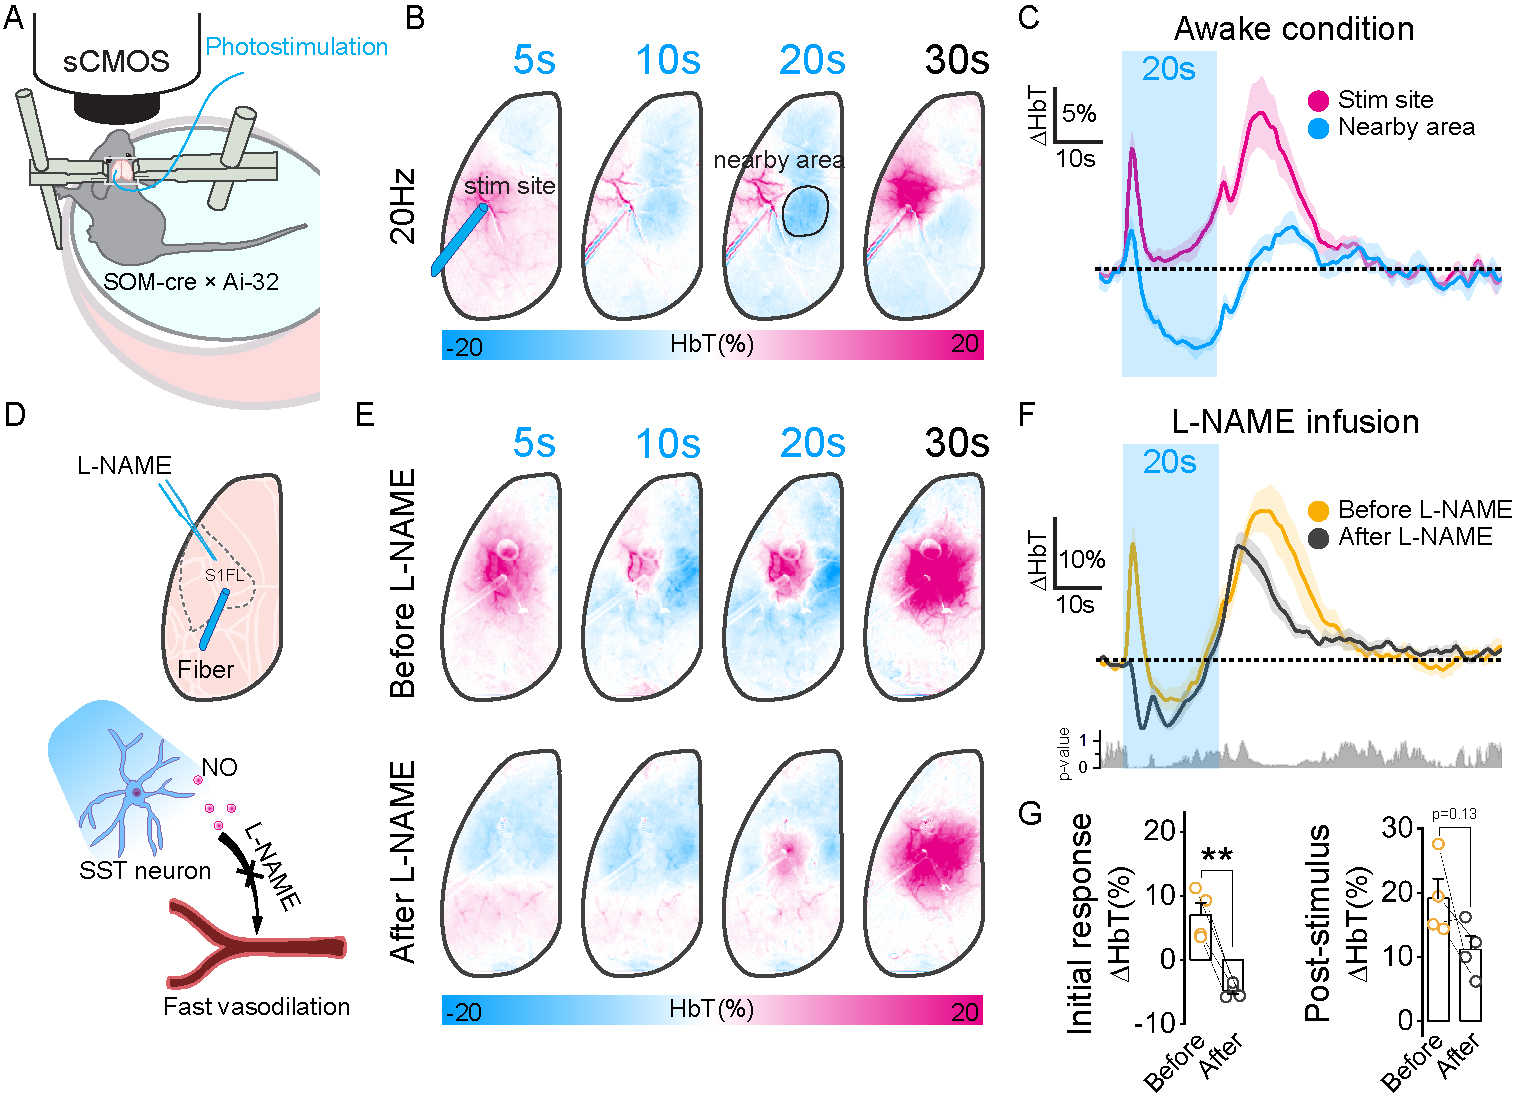
Figure 4. Initial fast vasodilation to activation of SST neurons is due to NO.
A. Schematic diagram of awake OIS experiment.
B. Representative SST-induced activation maps under awake condition.
C. HbT time course extracted from the stimulation site and negative surrounding area.
D. Schematic diagram of NO inhibitor infusion.
E. Representative HbT activation maps before and after infusion.
F. HbT time course of before and after infusion.
G. Mean HbT change of initial (5s after stimulus onset) and post-stimulus response (25-35s after stimulus onset) before and after infusion.
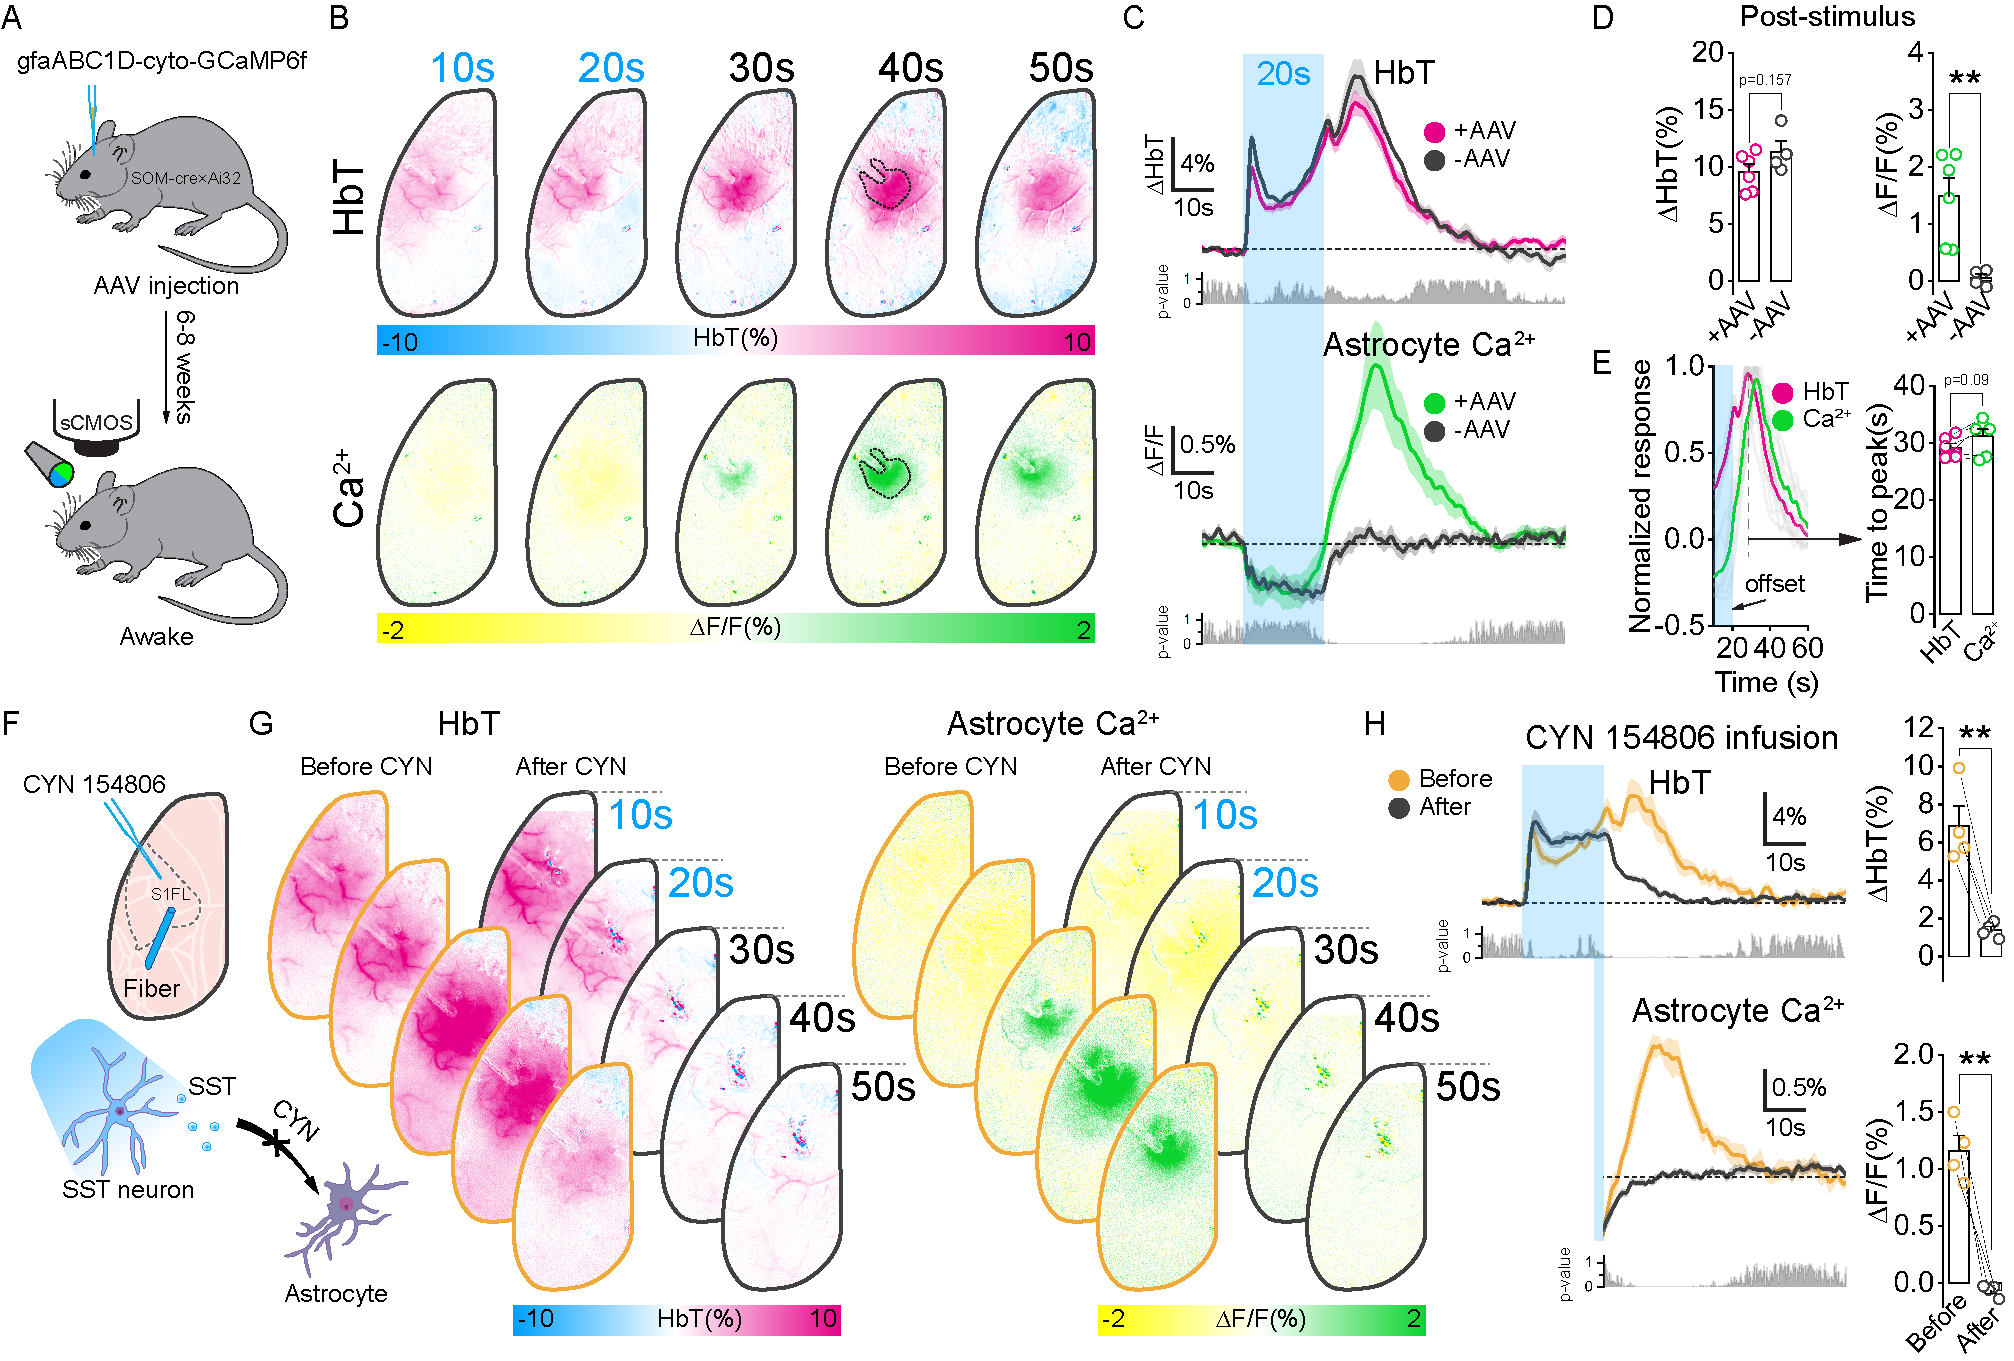
Figure 5. SST neurons-induced post-stimulus vasodilation is mediated by astrocytes through SST receptors.
A. Virus injection prepared for astrocytic calcium recording.
B. HbT and Ca2+ activation maps to SST photostimulation.
C. HbT and Ca2+ timecourse from the stimulation site.
D-E. Mean HbT and Ca2+ response and the time to peak of post-stimulus.
F. Schematic diagram of SST receptor antagonist infusion (CYN 154806).
G. HbT and Ca2+ activation maps before and after infusion. HbT and Ca2+ timecourses before and after infusion from the stimulation site.