0319
Improving laminar fMRI specificity by reducing macrovascular bias caused by respiration effects1UIUC, Urbana, IL, United States, 2NIMH, NIH, Bethesda, MD, United States
Synopsis
Keywords: fMRI Acquisition, fMRI, layer fMRI
Motivation: Although fMRI has achieved sub-millimeter spatial resolution especially with ultra-high field (≥7T) scanners, its spatial specificity has not kept pace.
Goal(s): This study aims to map and validate the influences of natural respiratory variations on fMRI signals and use it to improve laminar fMRI specificity.
Approach: We compare the influences of natural respiratory variations with the patterns induced by deep breath and breath hold tasks and probe their spatial correlation with vascular density.
Results: This respiratory variation revealed information can be used to remove macrovascular-dominated voxels, thereby enhance laminar fMRI specificity.
Impact: We highlight the significance of natural respiratory variations for improving laminar fMRI specificity. By understanding these variations and their link with vascular density, we can better identify and exclude macrovascular-dominated voxels, marking a notable advancement in high-resolution fMRI specificity.
Introduction
Although fMRI has achieved sub-millimeter spatial resolution especially with ultra-high field (≥7T) scanners, its spatial specificity has not kept pace. The fMRI signal doesn’t directly represent neuronal activity or the microvasculature near active neurons. Instead, it is still a complex amalgamation of various physiological influences, including vascular density distribution and respiratory fluctuations. This study aims to map and verify the influences of natural respiratory variations on fMRI signals, compare these with the patterns induced by deep breath and breath hold tasks, probe their spatial correlation with vascular density, and leverage this information to enhance laminar fMRI specificity by removing macrovascular-dominated voxels.Methods
Experiments were performed on a Siemens MAGNETOM 7T scanner. For functional measurement, we acquired an integrated blood volume and perfusion (VAPER) weighted signals using VAPER-3D-EPI1. For anatomical reference, we incorporated magnetization transfer (MT) weighting2 with 3D-EPI using an identical sequence design as functional imaging. Identical acquisition parameters were used for functional and anatomical imaging: volume TR = 6.082s, 96 slices (oversample additional 8.3%), excitation flip angle 20°, resolution 0.8-mm isotropic, partial-Fourier of 7/8 in both phase encoding directions, CAIPI 3x2 (kz shift 1, shot-selective). Through dynamically subtracting the signal in the blood-suppressed condition from control condition, VAPER contrast is generated to be sensitive to both cerebral-blood-volume (CBV) and cerebral-blood-flow (CBF) while BOLD weighting can be largely attenuated. Macro-vasculature, including veins and arterials, was automatically segmented from the susceptibility weighted imaging (SWI) and quantitative susceptibility mapping (QSM) postprocessing of MT-3D-EPI images3. Participants underwent deep breath (10 subjects), breath hold (5 subjects) and visual checkerboard (9 subjects) tasks.Results
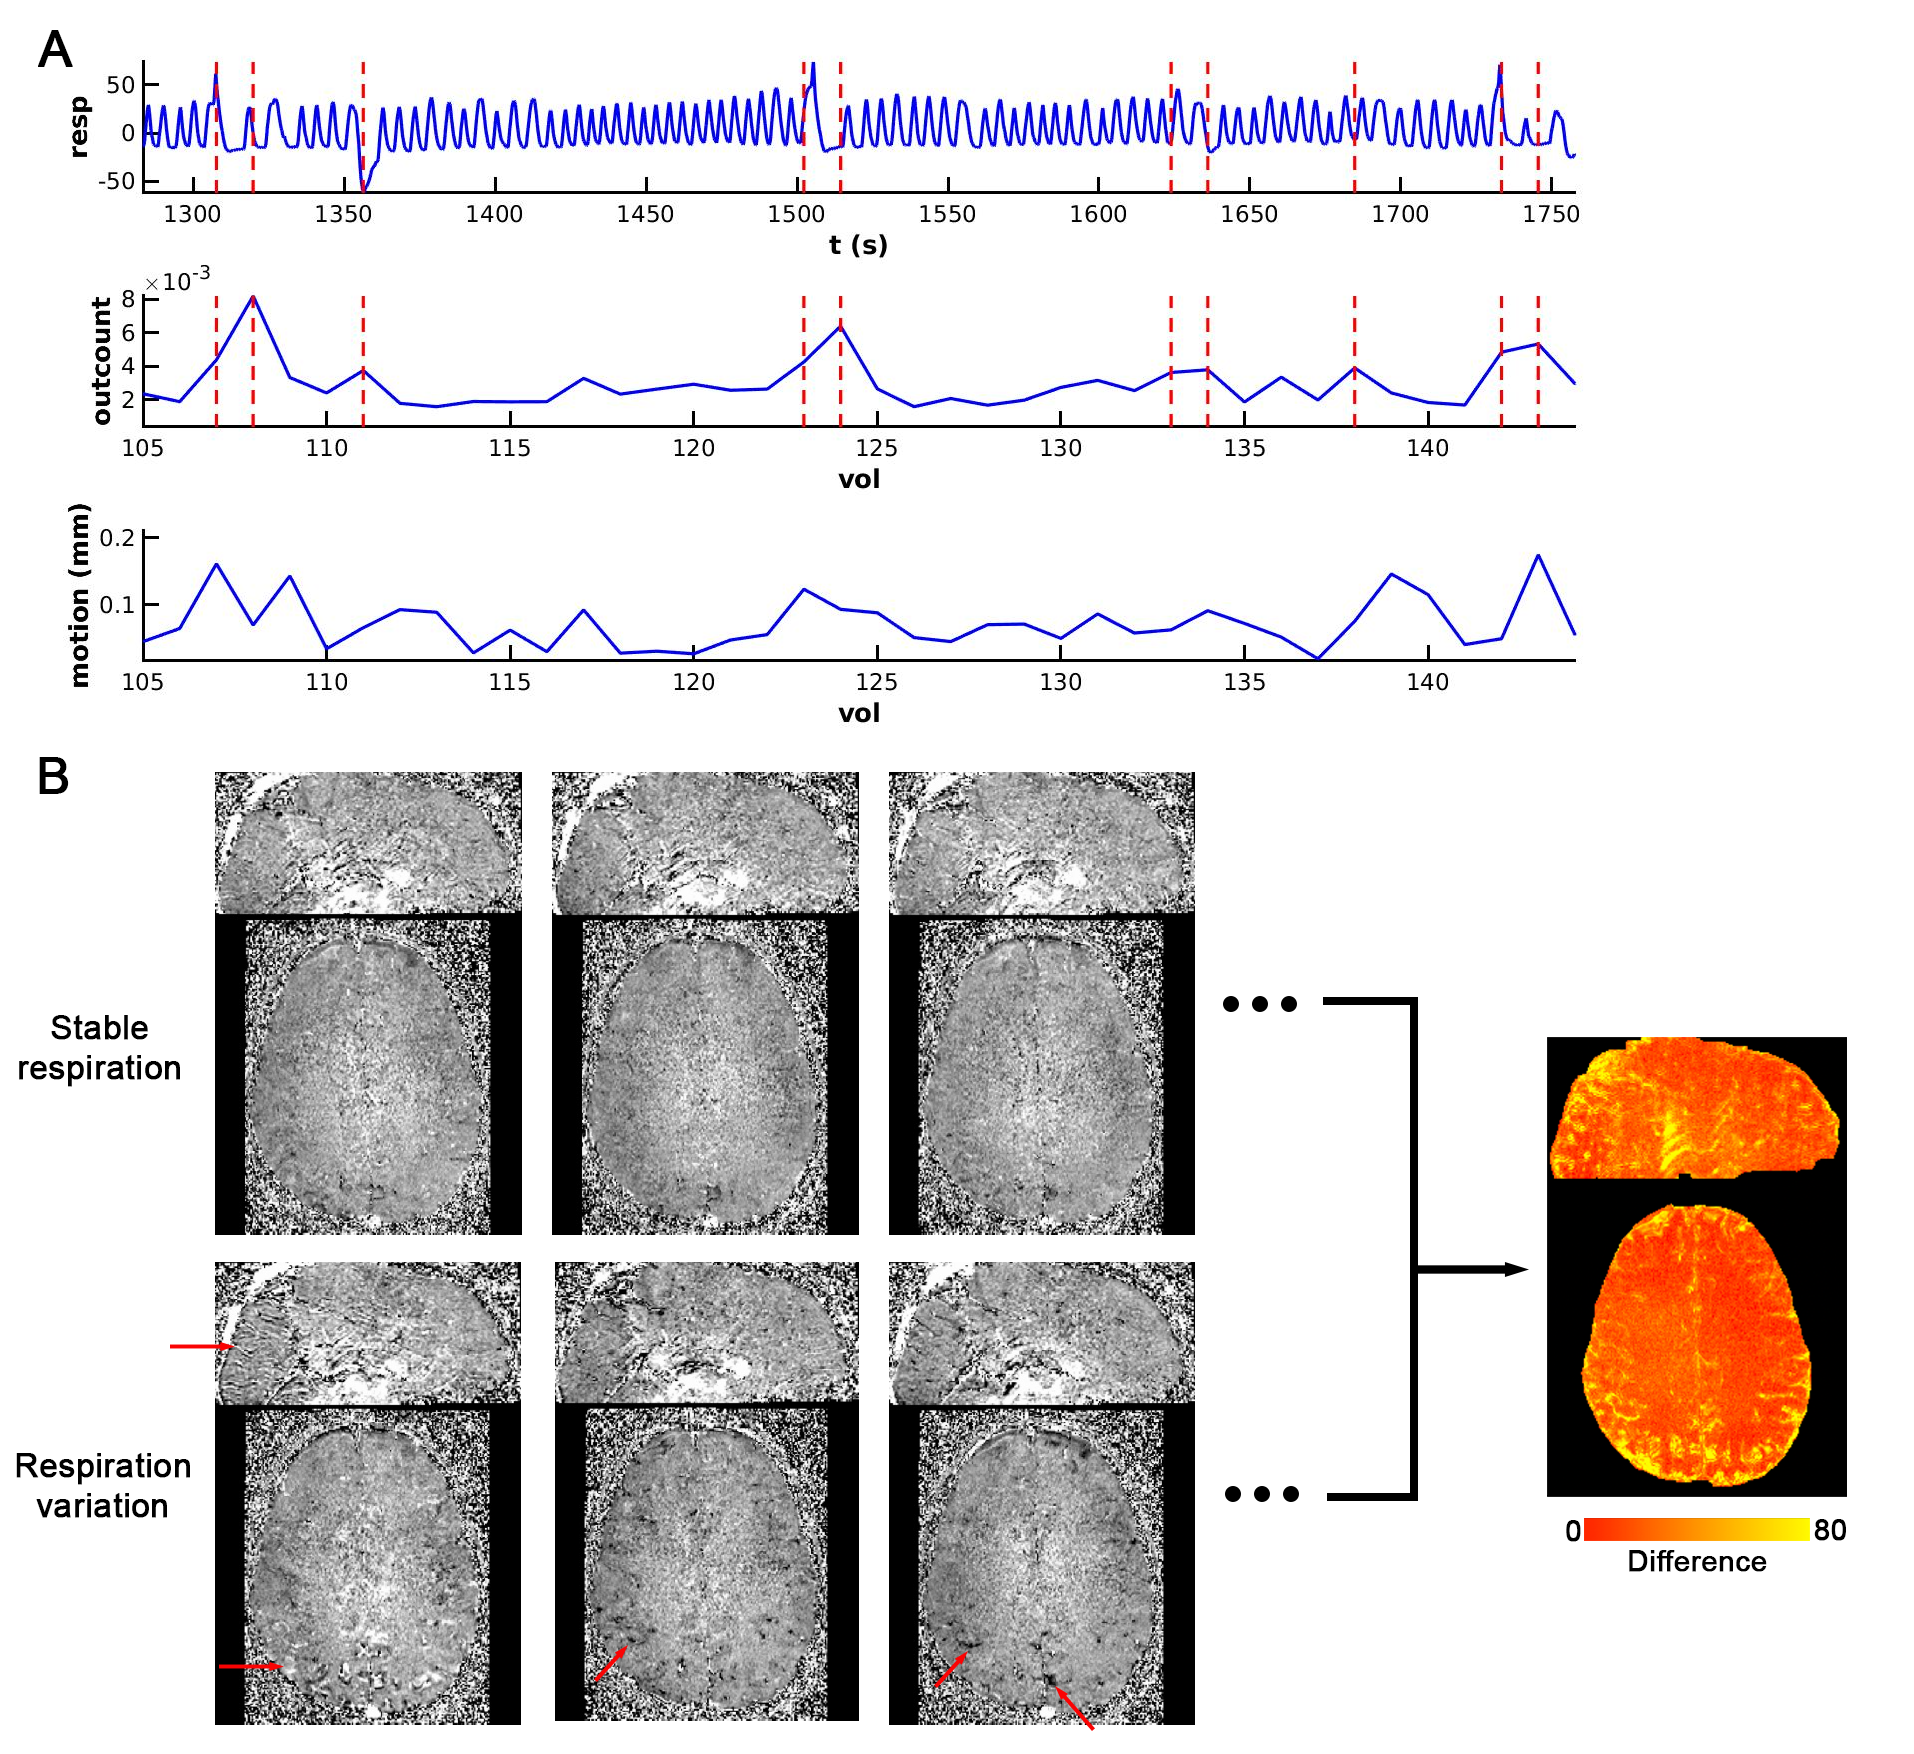
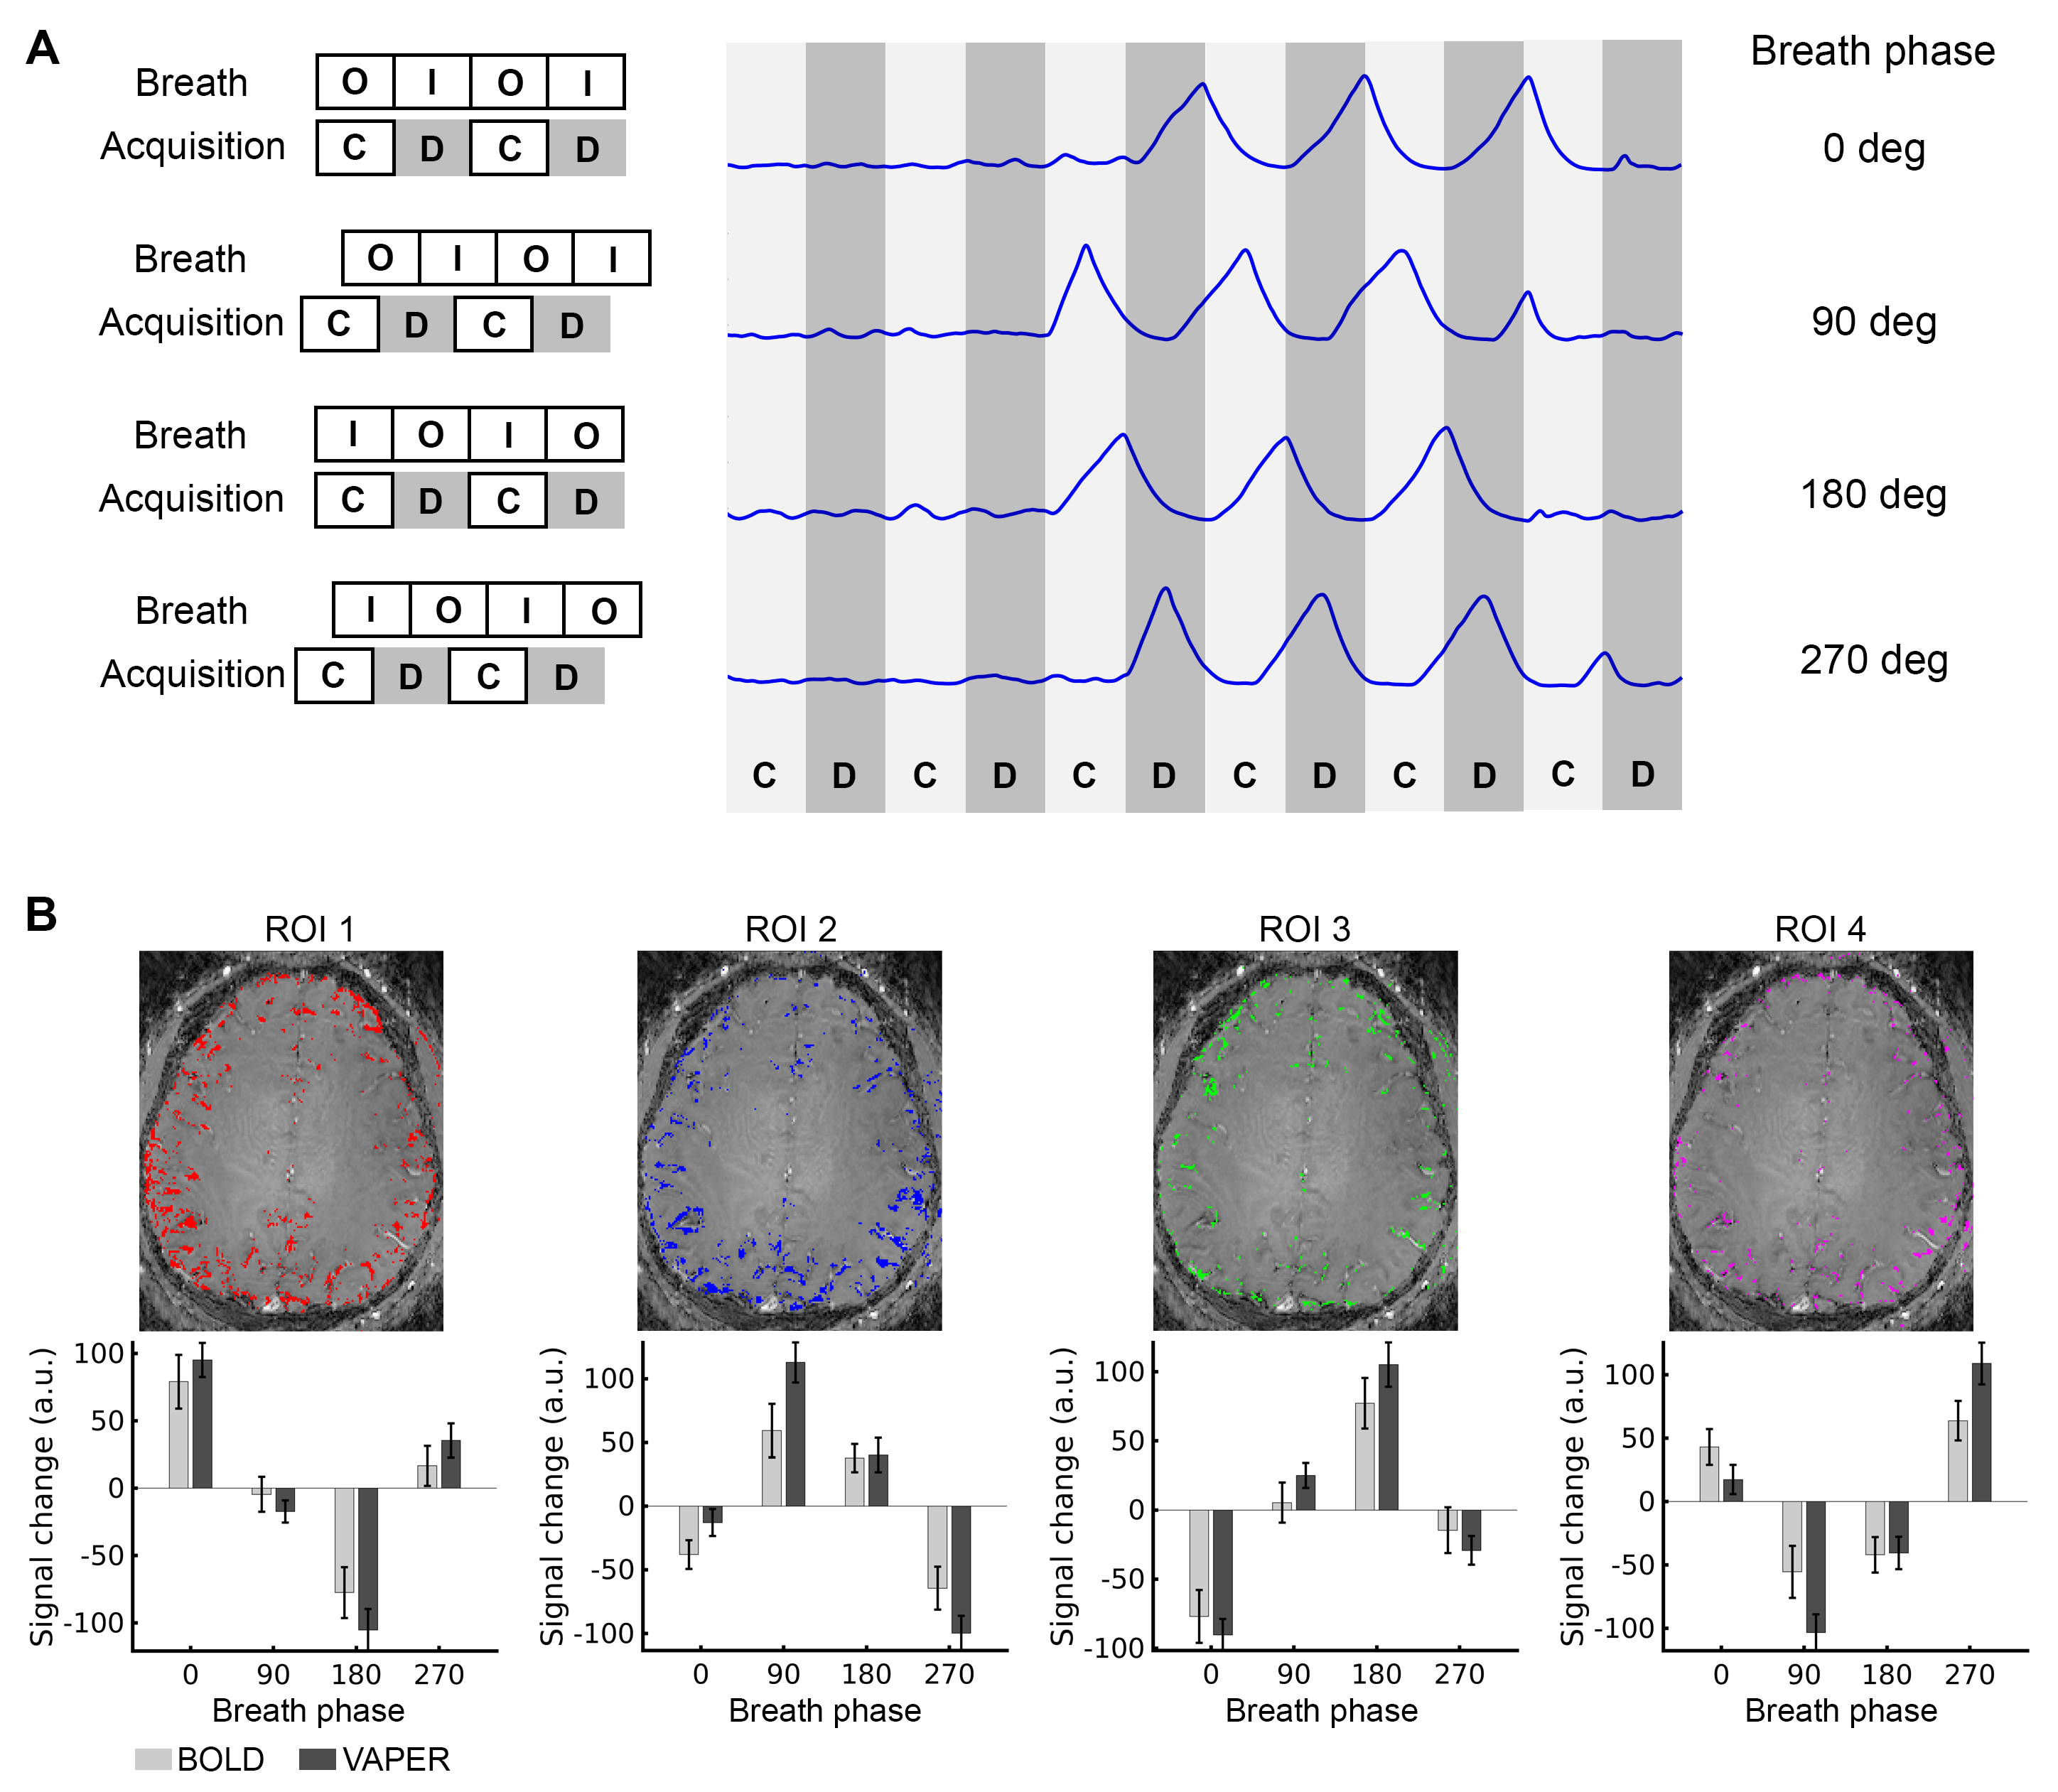
Fig. 1 presents the respiratory wave and VAPER-fMRI metrics captured during a segment of fMRI visual experiment. By analyzing the fraction of voxels diverging in signal intensity from the trend (outcount in Fig. 1A) at each time point, we identified the top 15% of time points with the highest outcount fraction as the respiration variation points, marked as vertical dashed lines overlaying the respiratory and outcount wave. The mean of these absolute signal changes across all respiration variation time points is represented in Fig. 1B.In deep-breath experiment, DANTE-prepared volume acquisitions were adjusted to be acquired during the breath-in, breath-out, or in the transition periods from breath-in to breath-out or opposite. During deep breath with a phase at 0-degree, the signal change in (region-of-interest 1) ROI1 is maximized positively, whereas it is near-zero in ROI2 and ROI4 and maximized negatively in ROI3. These signal changes at varied breath phases manifest a sinusoidal-like curve, with a quarter-cycle shift in ROI2, half-cycle shifts in ROI3, and three-quarter-cycle shifts in ROI4. This signal change pattern is consistent in VAPER and BOLD, with no significant difference (two-sample t-test, p>0.05).
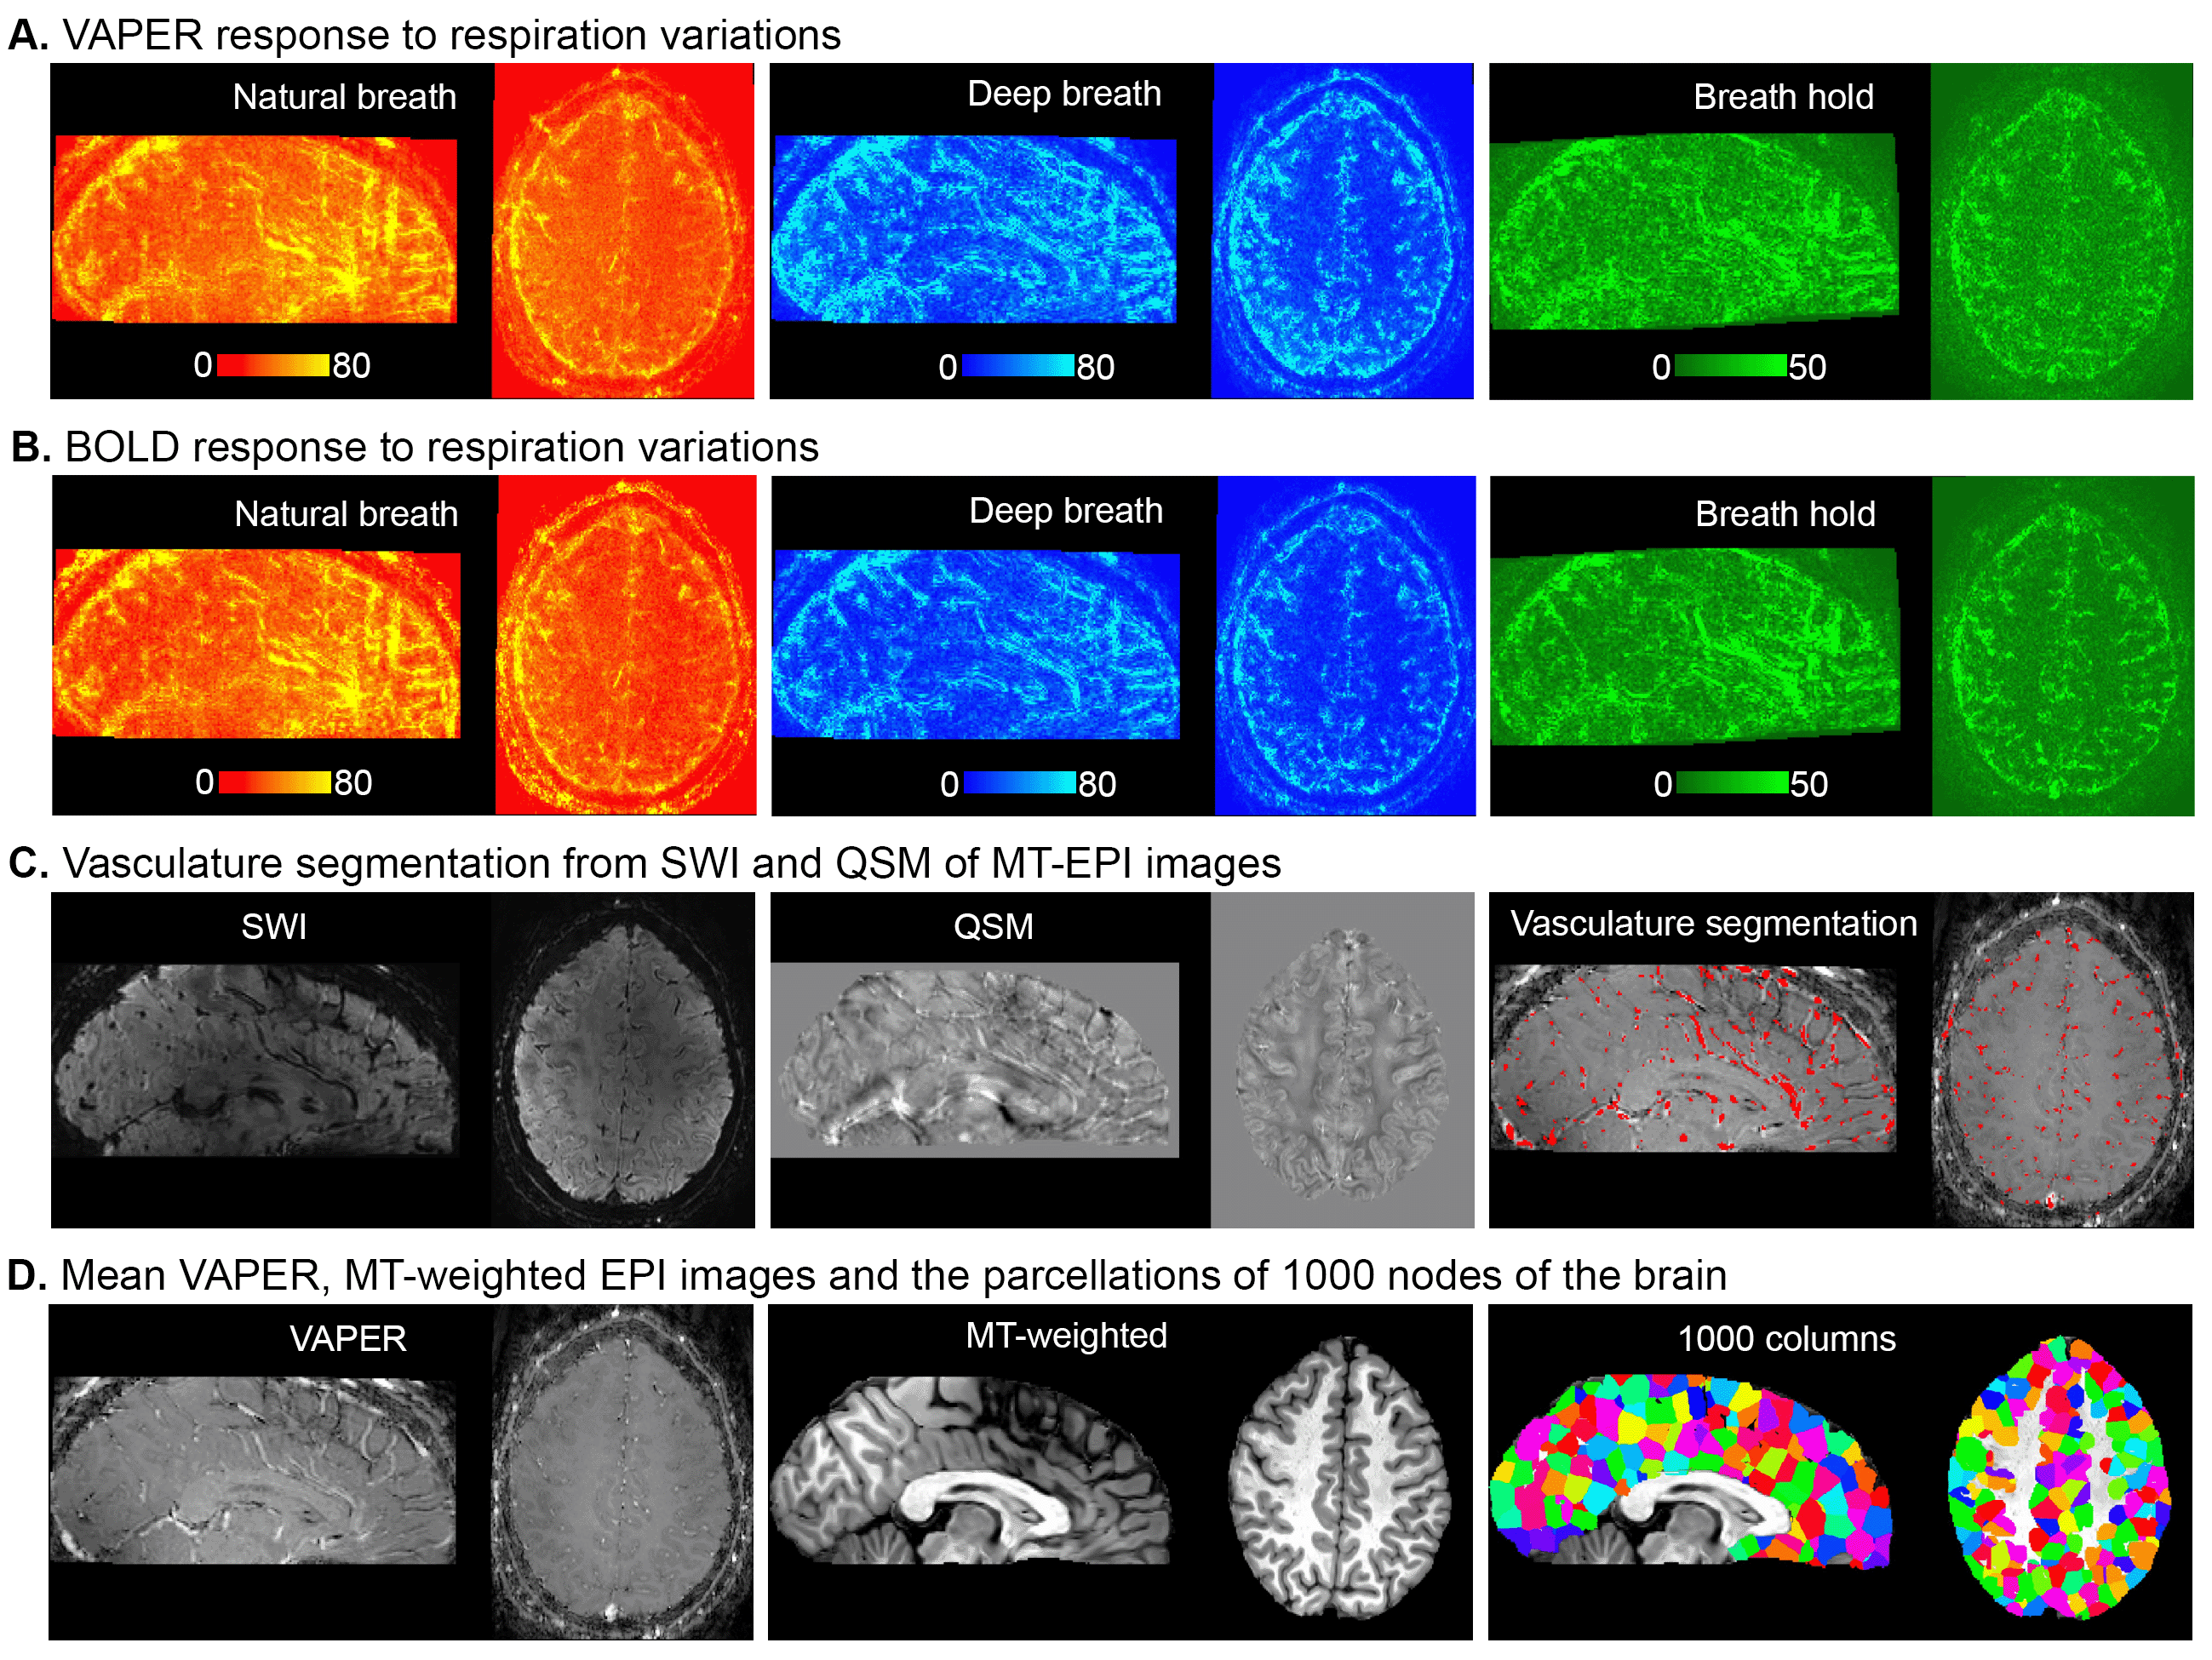
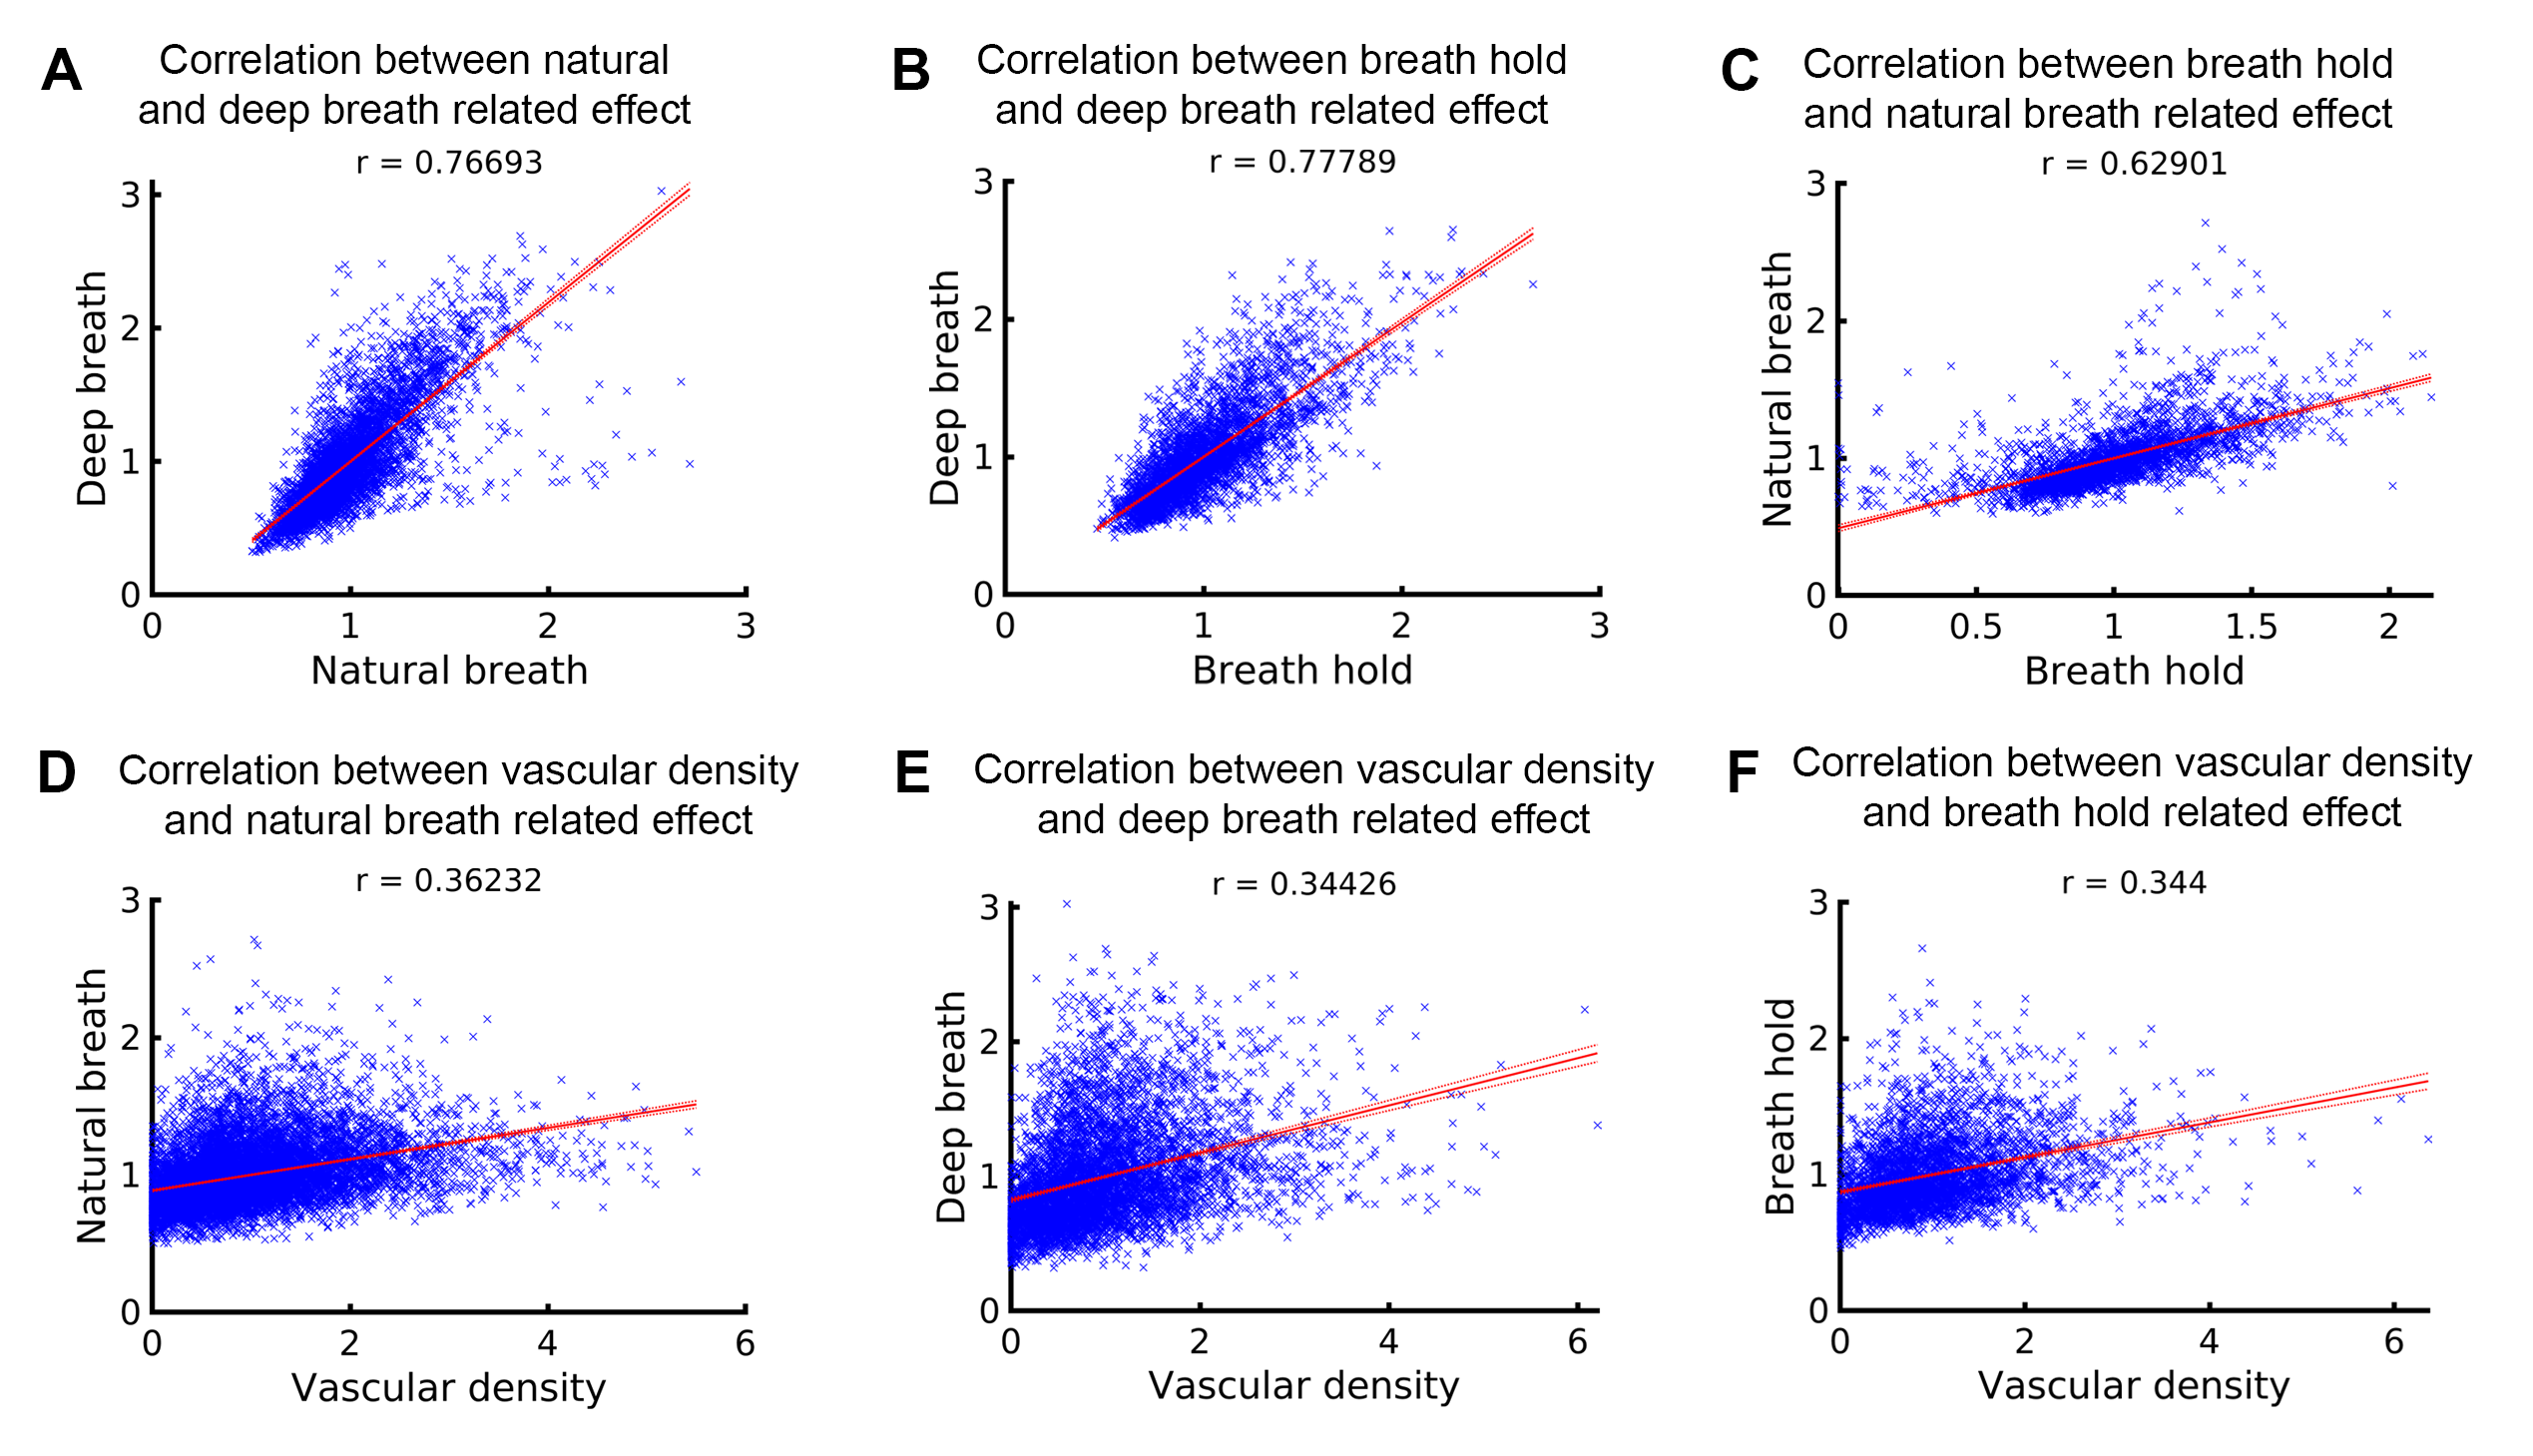
To determine whether the variations in the fMRI signal outcount fraction are indeed induced by respiration, we compared them with signal change patterns induced by deep breath and breath hold tasks. Fig. 3A and 3B displays VAPER and BOLD maps that elucidate absolute signal changes induced by various respiratory variations. The significant spatial correlations between these maps (r = 0.77, 0.78 and 0.63), depicted in Fig. 4A-C, substantiate the effective extraction of fMRI maps related to natural respiratory variations.
Fig. 3C illustrates vasculature segmentation resulting from SWI and QSM analysis of MT-EPI images, and Fig. 3D delineates the mean VAPER and MT-EPI images, with the cerebral cortex subdivided into 1000 columns/nodes based on the MT-EPI image. Subsequently, the node-wise correlation between the maps of VAPER and BOLD fMRI signal changes, invoked by various respiration variations, and vascular density were computed as in Fig. 4, all exhibiting significant correlations (all r > 0.34).
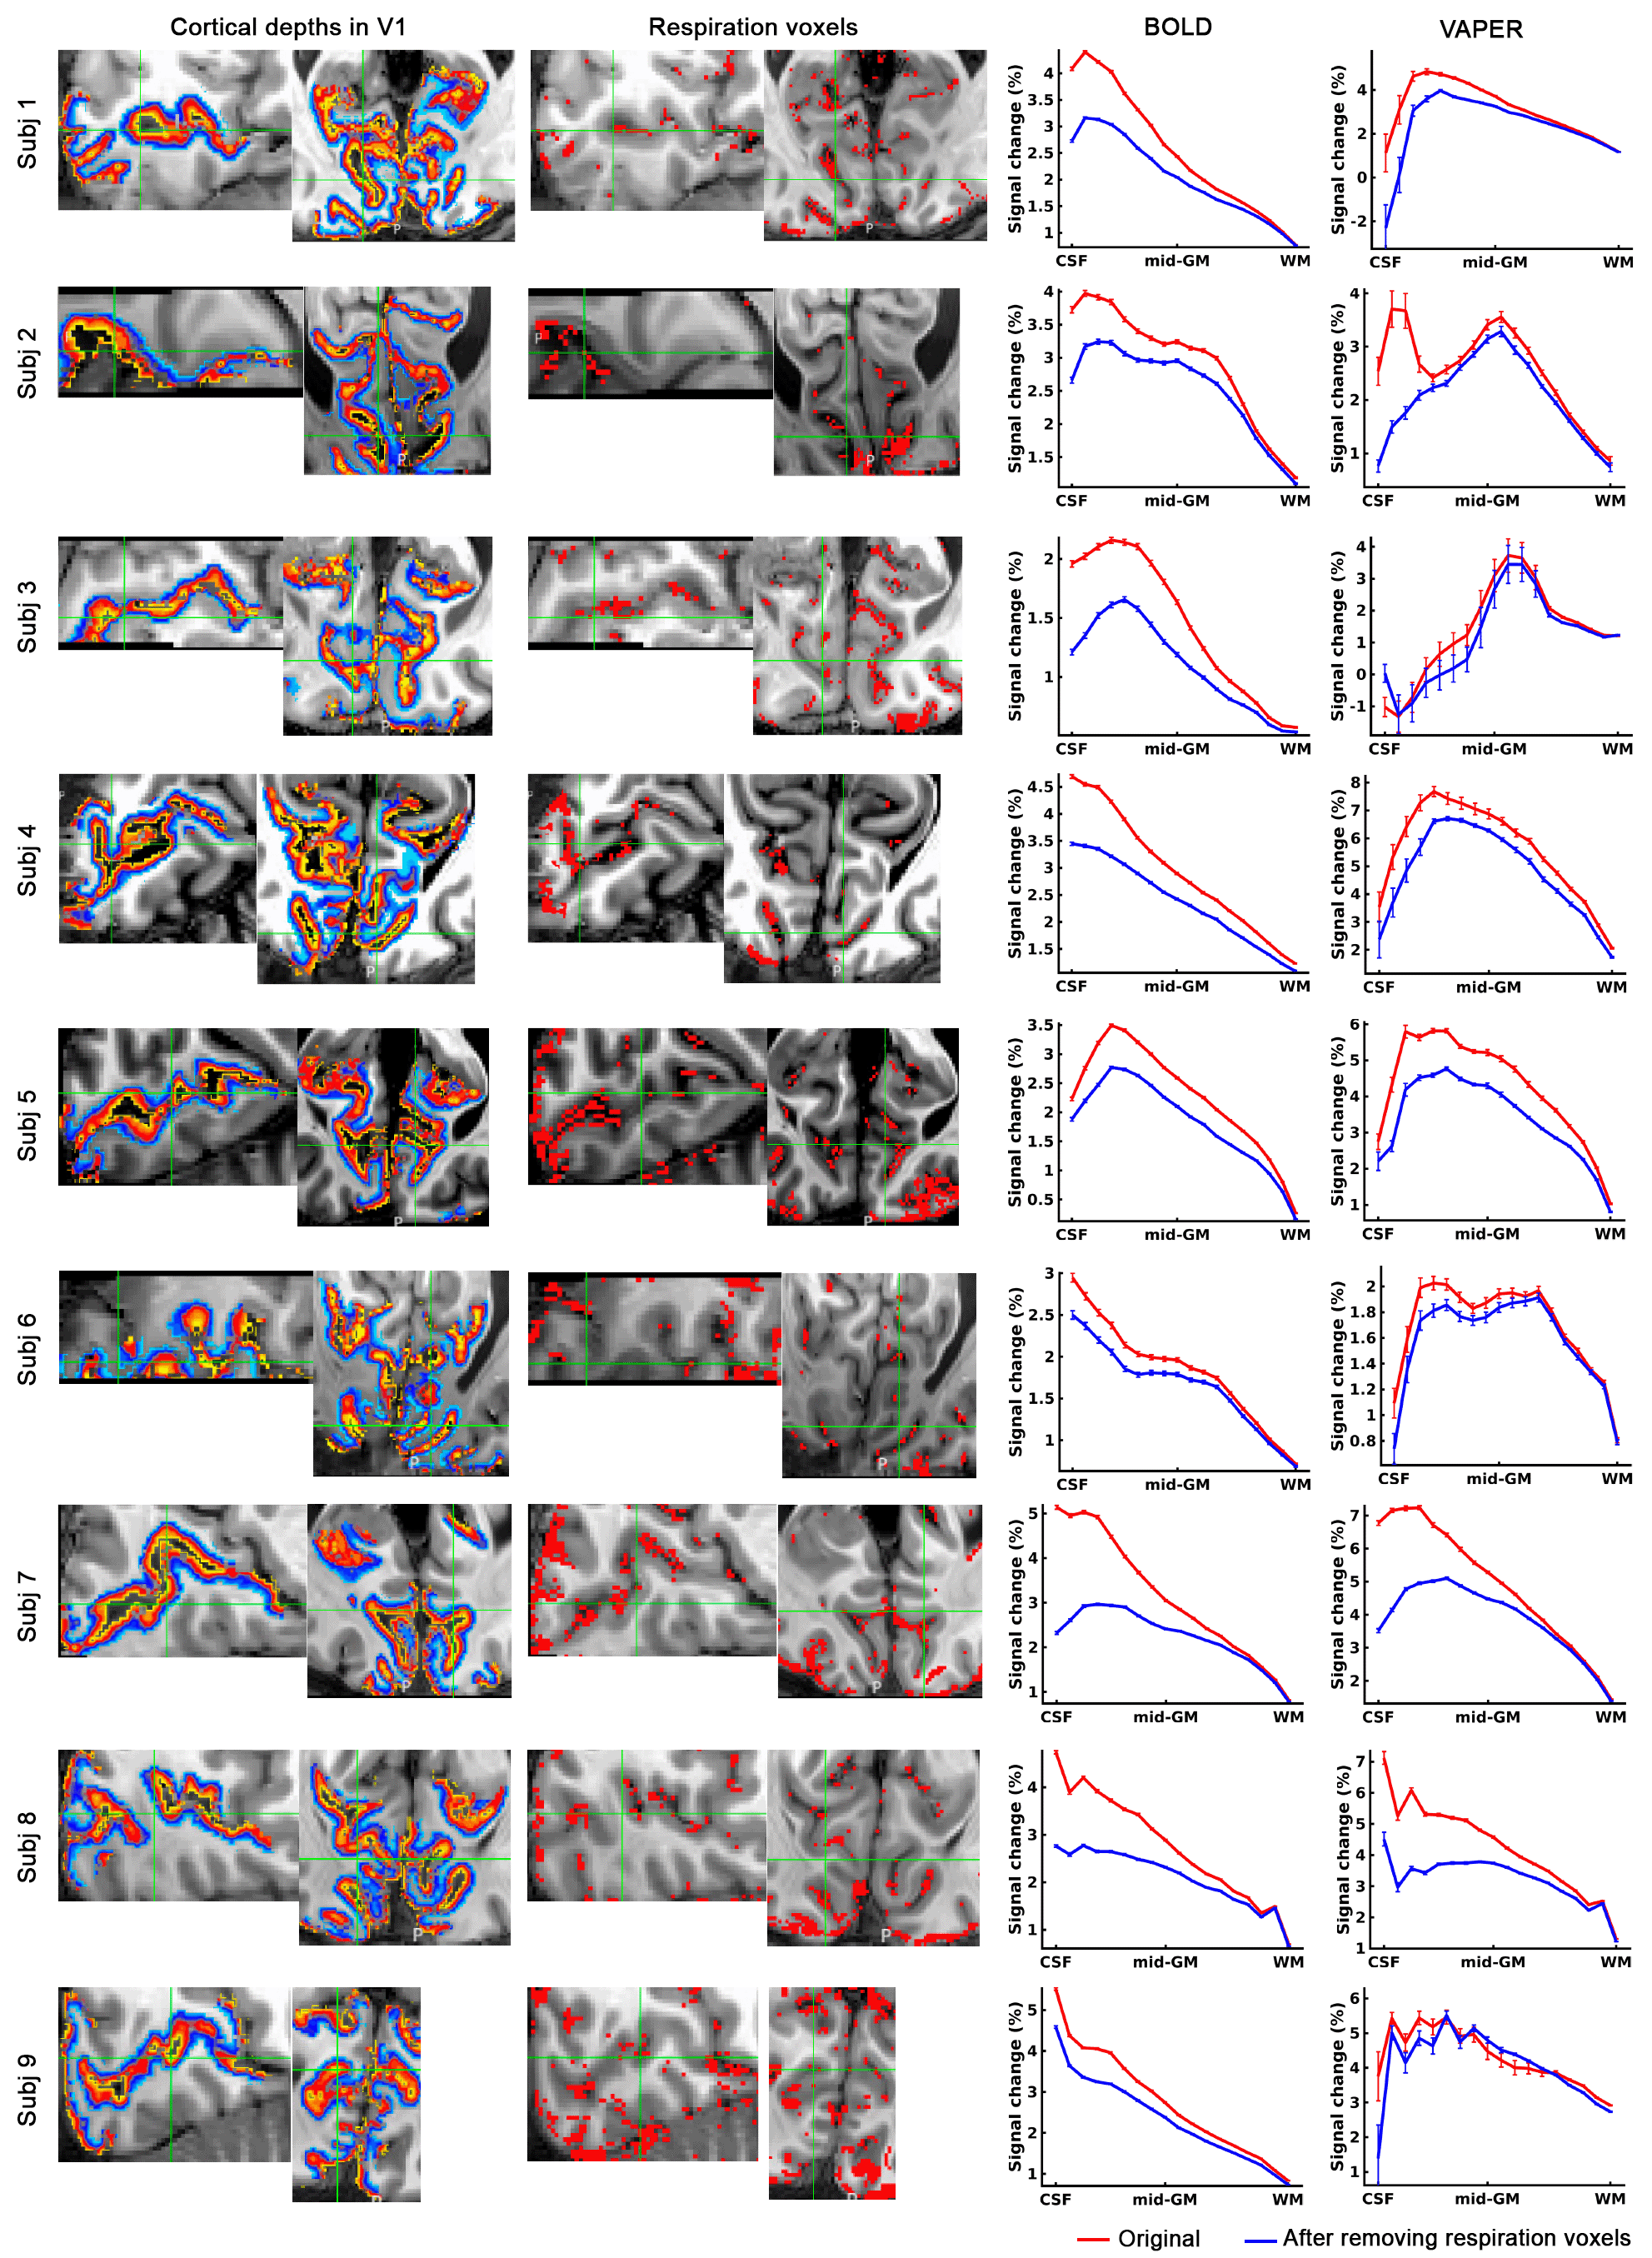
Fig. 5 depicts that by selectively excluding voxels most sensitive to respiration variations, a refined layer-specificity in fMRI can be achieved. The exclusion of the most respiration-related voxels markedly reduced the superficial bias observed in BOLD profiles. The VAPER laminar profile, compared to BOLD, has notably less superficial bias before the exclusion of respiration-related voxels. However, it is essential to note that VAPER is not entirely devoid of superficial bias due to suboptimal BOLD correction and the contribution of intravascular signals from large vessels. This residual bias in VAPER is more pronounced in some individuals (subjects 2, 7, 8 in Fig. 5). Through removing those respiration-related voxels corresponding to large vessels, the remaining superficial bias in VAPER can be further suppressed.
Conclusions
We provided insight into the interaction between respiratory fluctuations, vascular density, and high-resolution fMRI signals, offering novel perspectives on leveraging these interactions to enhance the specificity of laminar fMRI measurements.Acknowledgements
P. Bandettini and B. Sutton are joint senior authors of this work. This work was supported by the NIBIB program 1 R03 EB034324-01. We thank Benedikt A. Poser for contributions of the 3D-EPI.References
1. Chai, Y., Li, L., Huber, L., Poser, B. A. & Bandettini, P. A. Integrated VASO and perfusion contrast: A new tool for laminar functional MRI. Neuroimage 207, (2020).
2. Chai, Y. et al. Magnetization transfer weighted EPI facilitates cortical depth determination in native fMRI space. Neuroimage 242, (2021).
3. Straub, S. et al. A novel gradient echo data based vein segmentation algorithm and its application for the detection of regional cerebral differences in venous susceptibility. Neuroimage 250, (2022).
Figures