0317
MRI meets economics: Balancing sample size and scan duration1National University of Singapore, Singapore, Singapore, 2Big Data Institute, Oxford, United Kingdom, 3Washington University, St. Louis, MO, United States, 4McGill University, Montreal, QC, Canada, 5Research Center Jülich, Jülich, Germany, 6Rutgers University, Piscataway, NJ, United States
Synopsis
Keywords: fMRI Analysis, fMRI (resting state)
Motivation: Resting-state functional connectivity (RSFC) is widely used to predict behavioral traits in individuals.
Goal(s): A pervasive dilemma when collecting functional MRI data is whether to prioritize sample size or scan duration given fixed resources.
Approach: We systematically investigate the trade-off between sample size and scan time in the context of prediction accuracy and reliability of brain-behavior relationships using RSFC.
Results: Increasing sample size (with fixed scan time) or scan time (with fixed sample size) leads to similar accuracy. Reliability of brain-behavior association can only be improved with bigger sample sizes but not scan time.
Impact: Our findings establish an empirically informed reference for calibrating scan times and sample sizes to maximize prediction of behavioral performance and reliability of brain-behavior associations when using resting-state functional connectivity.
Background
Resting-state functional connectivity (RSFC) is widely used to predict behavioral traits in individuals[1]–[3]. A pervasive dilemma when collecting functional MRI (fMRI) data is whether to prioritize sample size or scan duration given fixed resources. Larger sample sizes lead to better individual-level prediction accuracy and brain-behavior association reliability[4]–[6]. However, in parallel, other studies have emphasized the importance of longer fMRI scan duration per participant, which leads to improved data quality, reliability, and prediction performance[7]. Here, we systematically investigate the trade-off between sample size and scan time in the context of prediction accuracy and reliability of brain-behavior relationships using RSFC.Methods
We utilized 2 large datasets - 792 participants from the Human Connectome Project (HCP) and 2565 participants from the Adolescent Brain Cognitive Development (ABCD) study. Each participant’s brain was parcellated into 419 regions of interest[8], and a FC matrix was formed by taking the correlation of BOLD signals for each pair of regions from the first T mins. The FC matrices were used to train regression models[9] for a wide set of behavioral measures[10]. A nested cross-validation procedure was used and accuracy was measured using Pearson’s correlation (r) between the predicted and actual scores of participants in the test fold. The above analysis was repeated with different training set sizes, N, achieved by subsampling each training fold, while keeping the test set identical across different training set sizes to keep the results comparable across different N. The whole procedure was repeated with different values of T. T was varied from 2 mins to the maximum scan time of each dataset.To explore the reliability of univariate brain-wide association analyses, we followed a previously established split-half procedure[4]. We derived the t-statistic between each RSFC edge and behavioral measure across participants, on two non-overlapping sets of participants. Their concurrence was then computed using the intra-class correlation formula[4]. Sample size and scan duration were varied in a similar manner as before.
Results
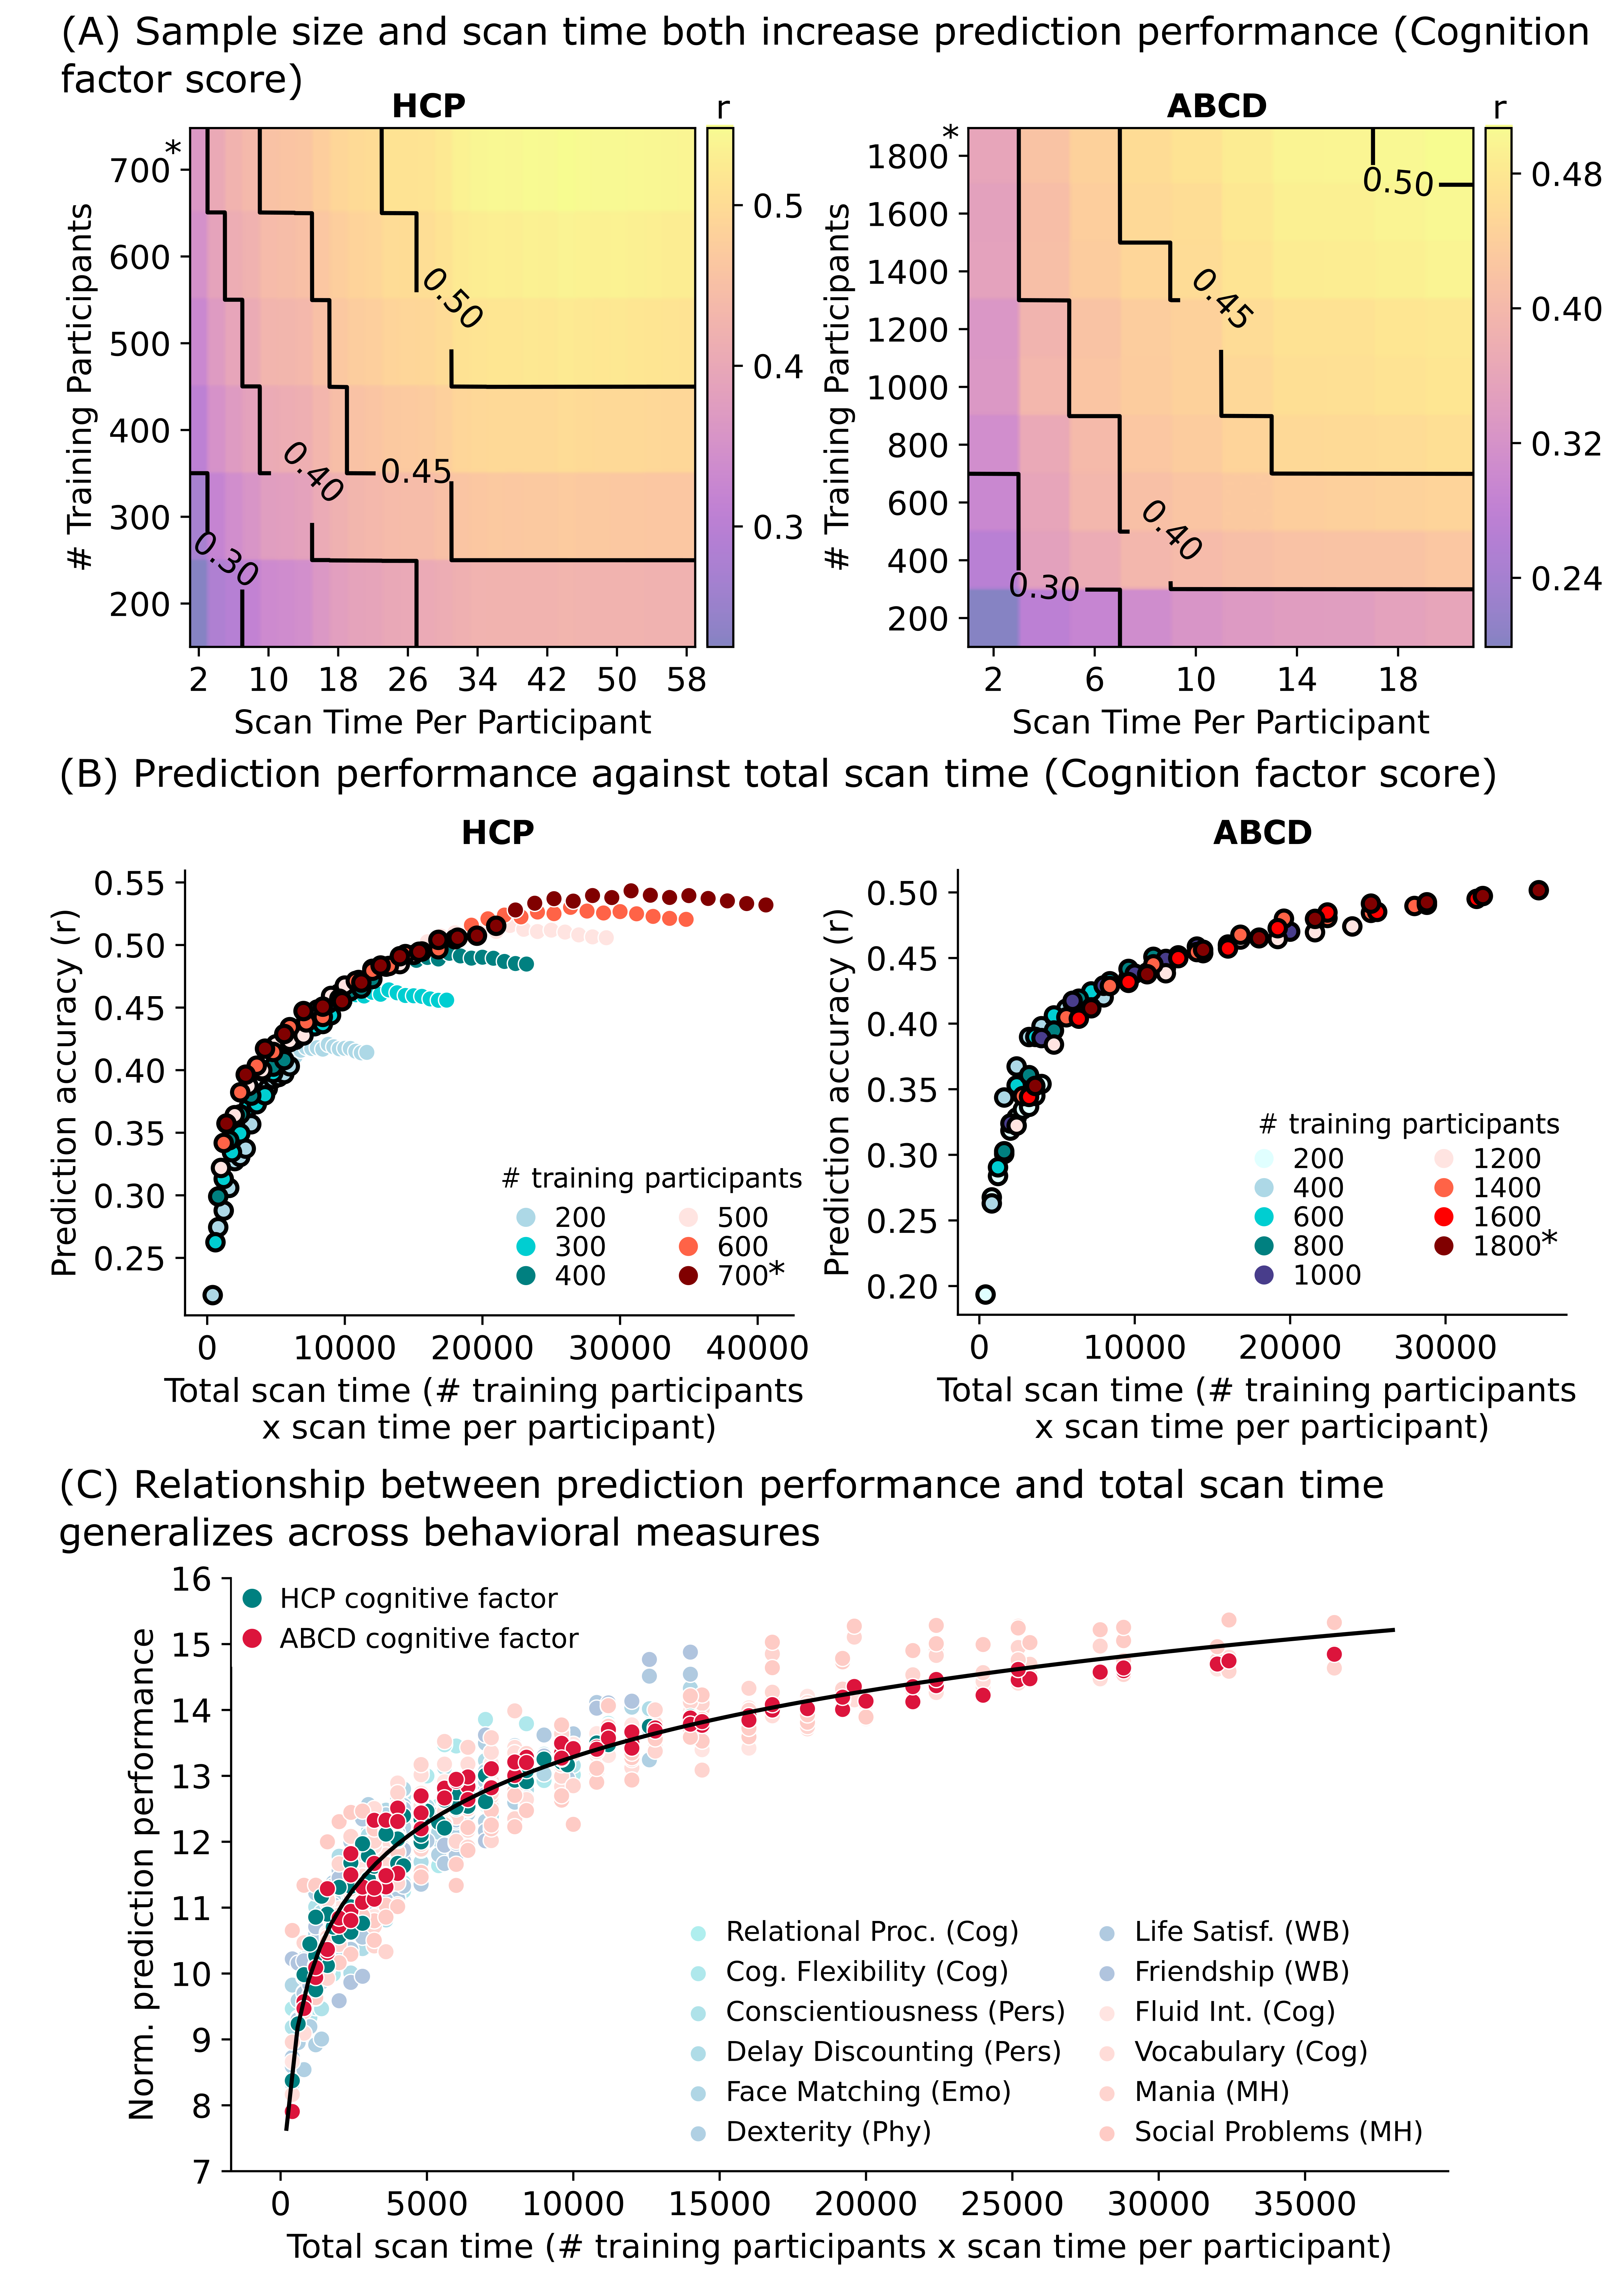
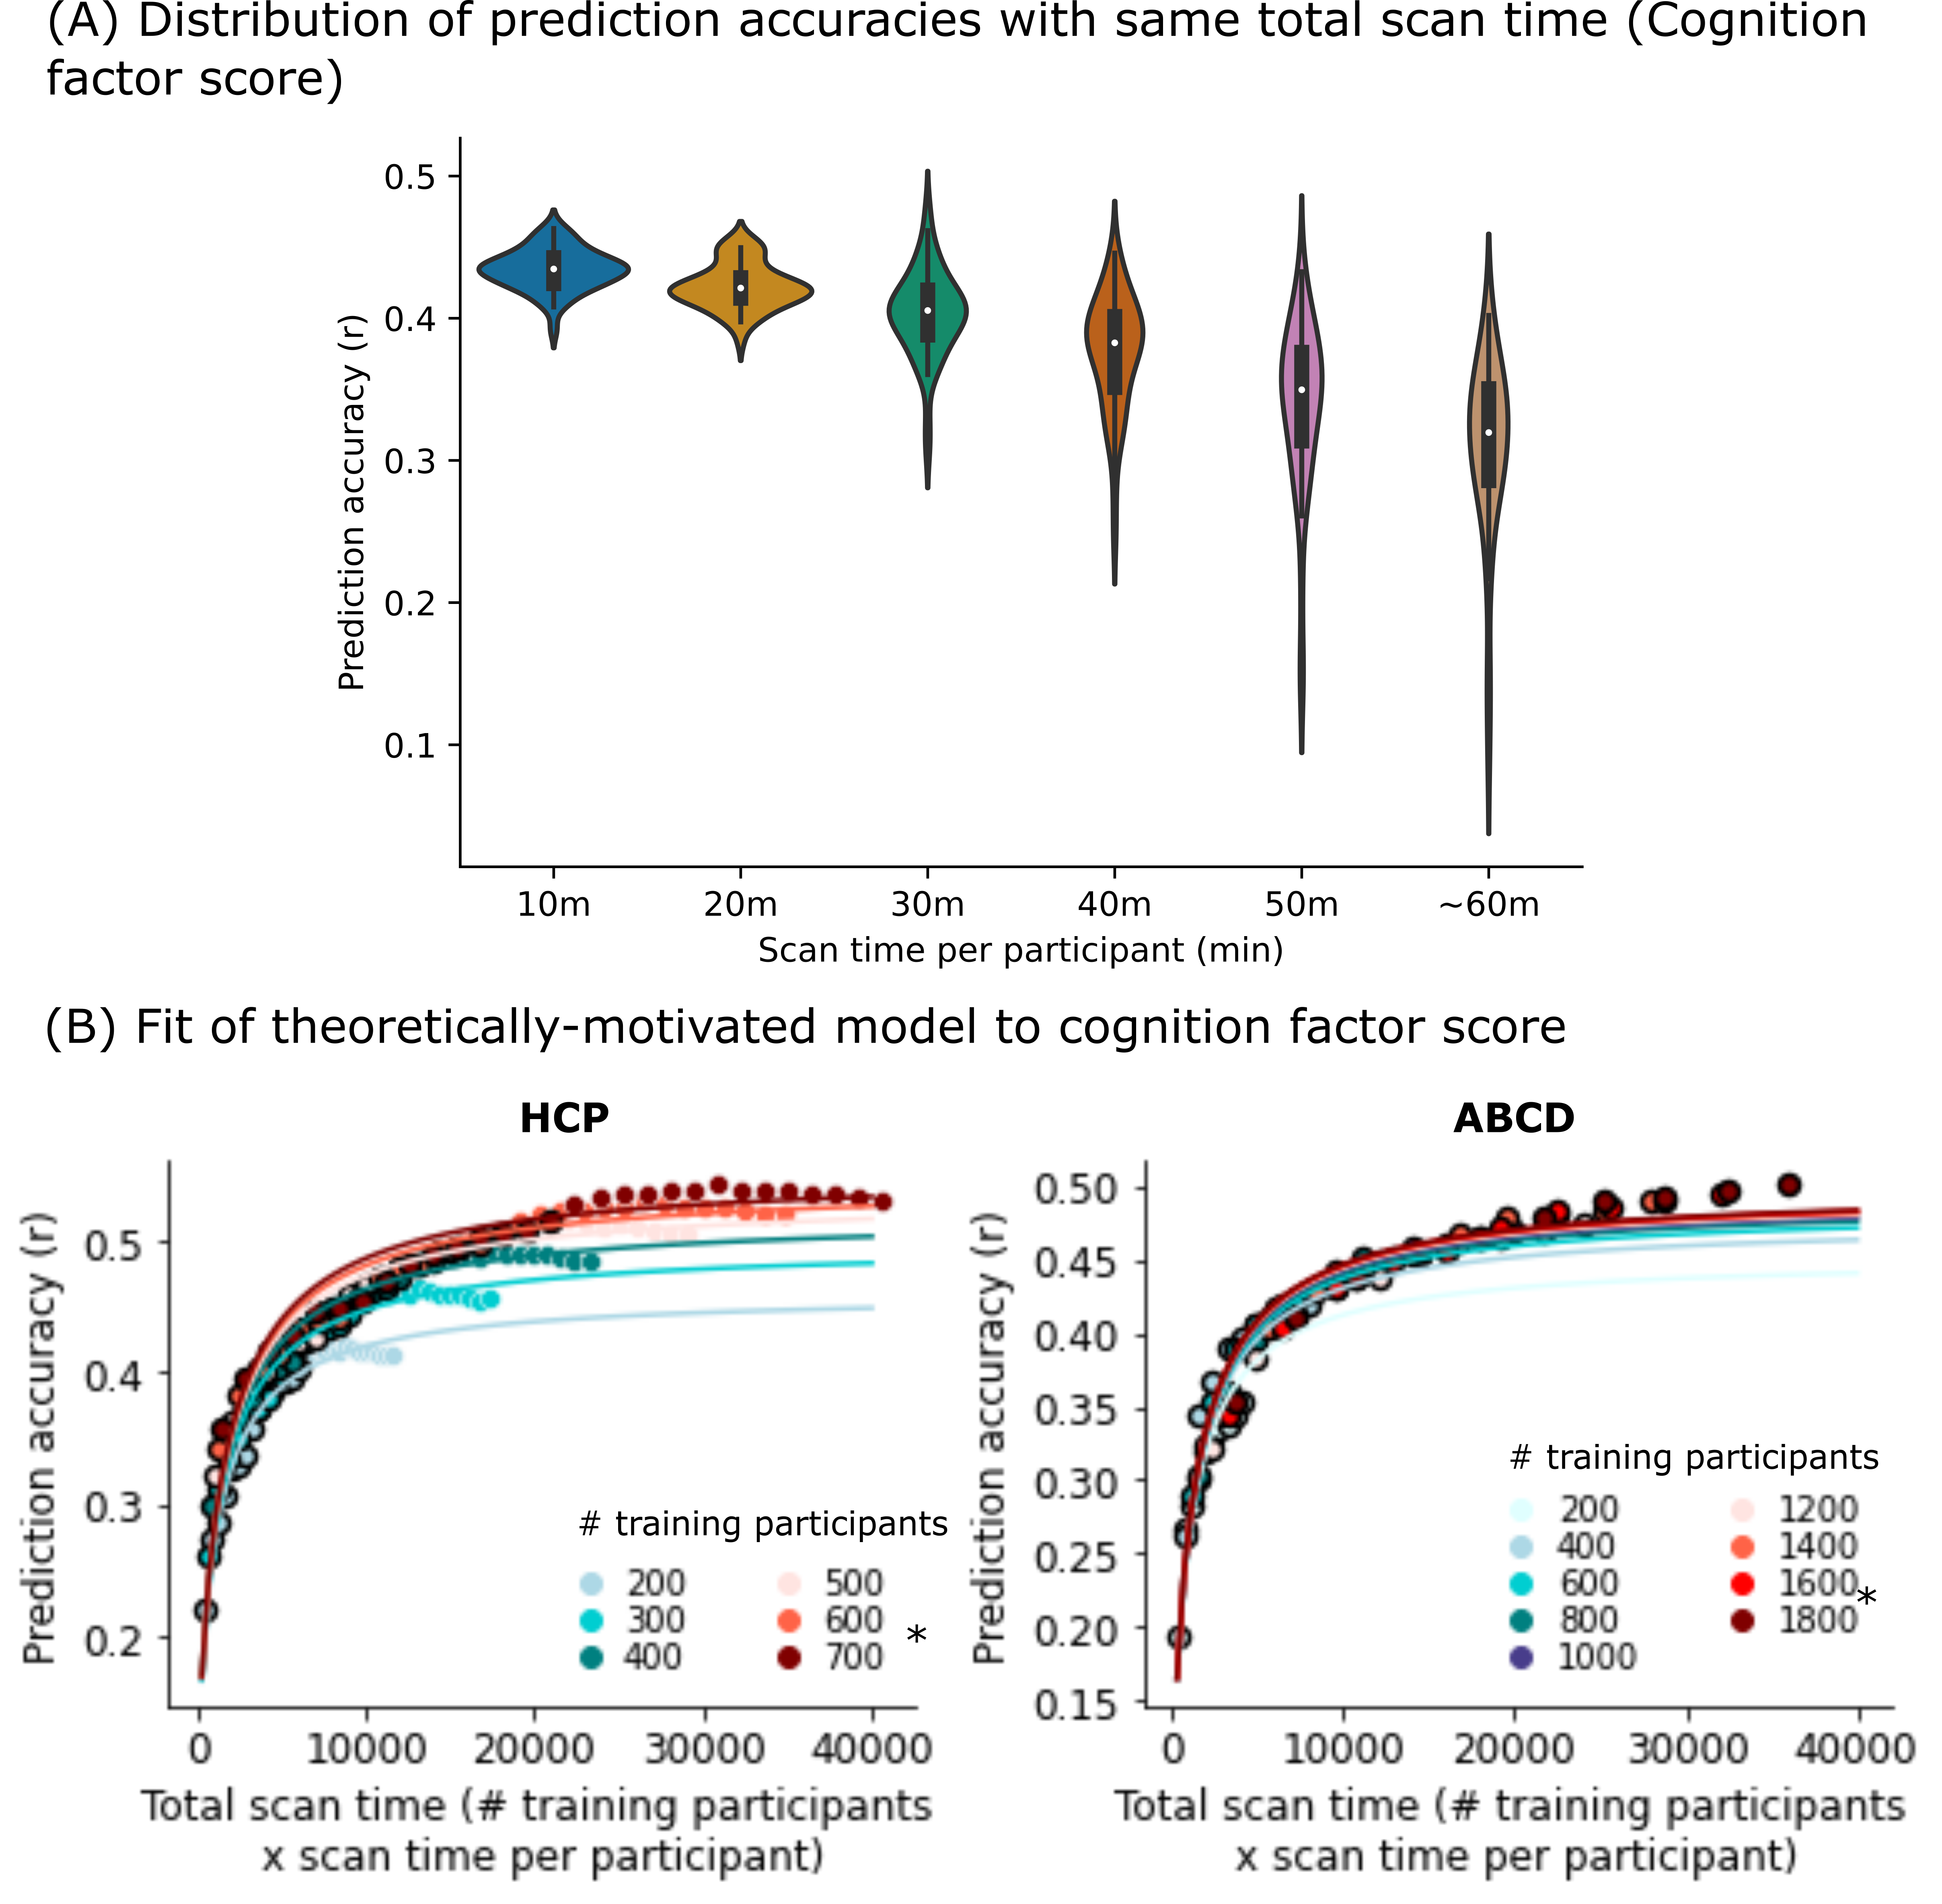
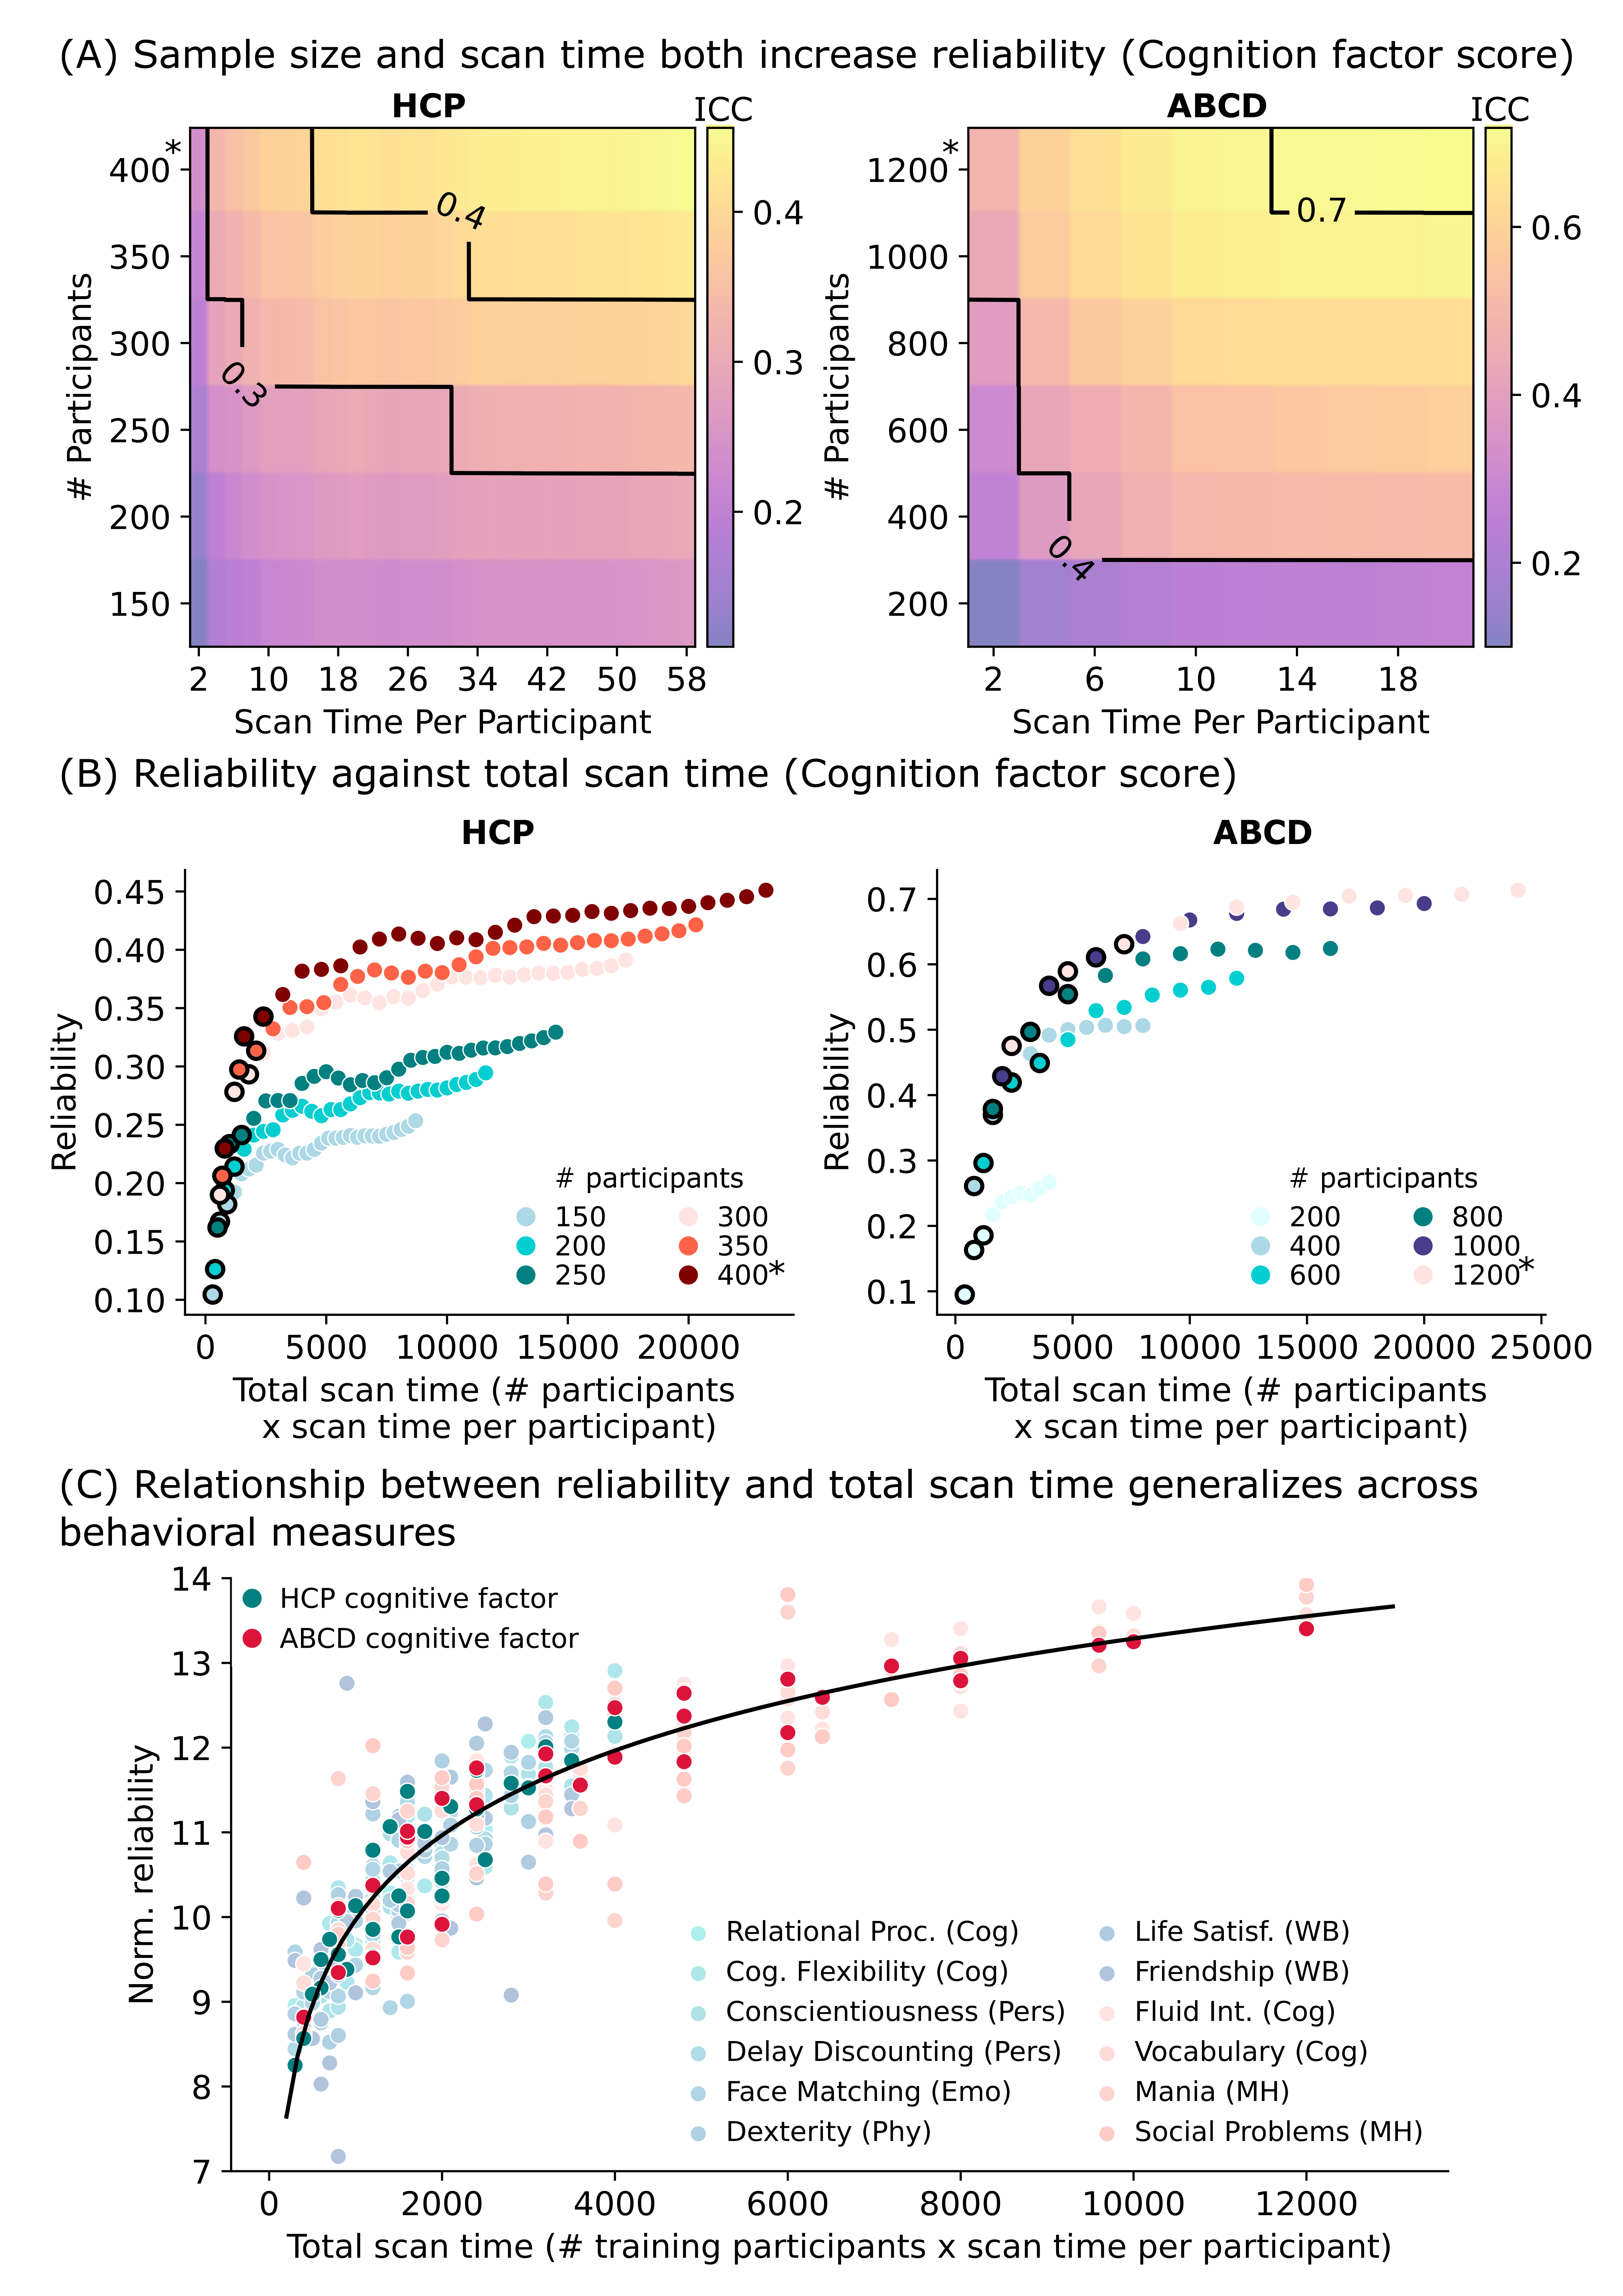
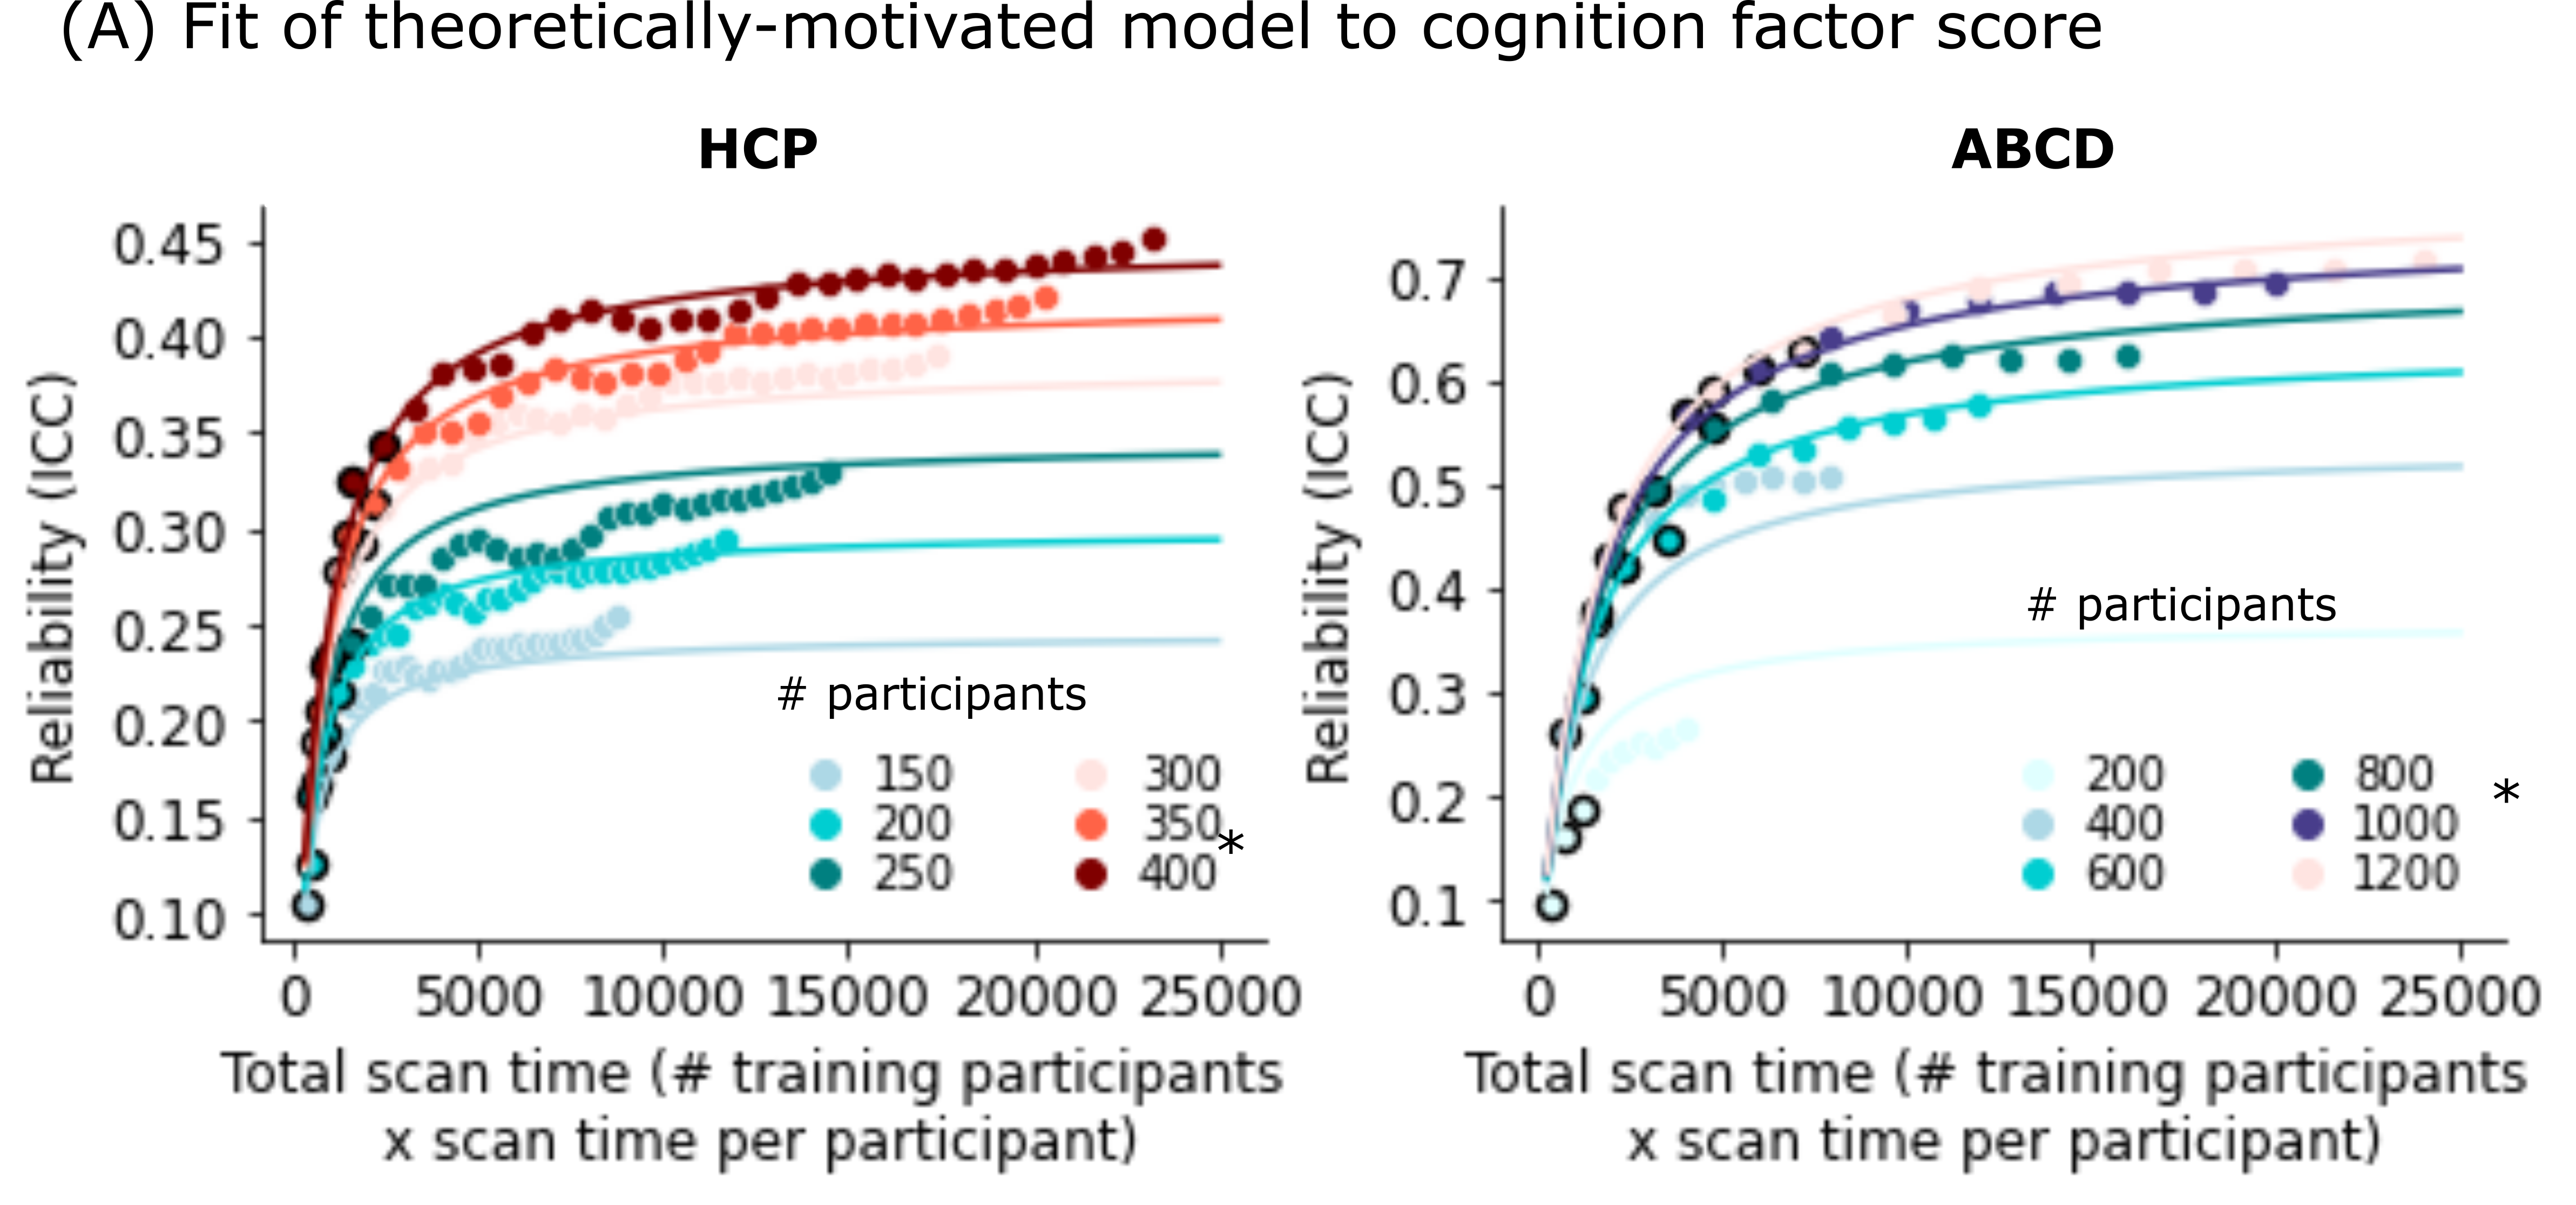
Fig 1A shows that prediction performance for a cognition factor score derived from a factor analysis over all scores in each dataset. Accuracy increases with more training participants and scan time. Plotting prediction performance against total scan time (# training participants * scan time), reveals a logarithmic-like relationship when considering points with less than 30min of scan time (Fig 1B). Sample size and total scan time are broadly interchangeable below this point, achieving comparable prediction accuracies so long as the total scan time is similar. This relationship generalized to 19 other scores that we investigated in the HCP, and 14 others in the ABCD. Fig 1C shows that total scan time explains prediction accuracy remarkably well across measures in both datasets. We further delved into whether sample size or scan time was more beneficial by comparing 6 datapoints from the cognition factor score with the same total scan time of 6000 minutes. We observed a small empirical drop in accuracy when scan time was increased but number of participants was decreased (Fig 2A). We fit a theoretically-motivated model to explain this difference between training participants and scan time.The fit of the model is shown for the cognition factor score in Fig 2B.Reliability of brain-behavior associations increases with more training participants and scan time as well (Fig 3A). However, plotting reliability against total scan time reveals that sample size dominates scan time much earlier, between 6 to 10 mins of scan time (Fig 3B). We similarly visualized reliability in terms of total scan time with a logarithmic function in Fig 3C to show the generalizability of this relationship across multiple behavioral measures. We then also fit a theoretically-motivated model, results for the cognition factor scores in the HCP and ABCD are shown in Fig 4.
Conclusions
Total scan time explains prediction performance of behavioral measures very well, such that increasing sample size (with fixed scan time) or scan time (with fixed sample size) leads to similar accuracy. Conversely, reliability of brain-behavior association is more dependent on sample sizes rather than scan time. Notably, larger samples are important to get better sampling of intersubject variability related to features, targets and confounds. Our findings establish an empirically informed reference for calibrating scan times and sample sizes to maximize prediction and reliability of brain-behavior association.Acknowledgements
No acknowledgement found.References
[1] E. S. Finn et al., “Functional connectome fingerprinting: identifying individuals using patterns of brain connectivity,” Nat. Neurosci., vol. 18, no. 11, pp. 1664–1671, Oct. 2015.
[2] E. Dhamala, K. W. Jamison, A. Jaywant, S. Dennis, and A. Kuceyeski, “Distinct functional and structural connections predict crystallised and fluid cognition in healthy adults,” Hum. Brain Mapp., vol. 42, no. 10, pp. 3102–3118, Jul. 2021.
[3] R. Kong et al., “Individual-specific areal-level parcellations improve functional connectivity prediction of behavior,” Cereb. Cortex, vol. 31, no. 10, pp. 4477–4500, Aug. 2021.
[4] Y. Tian and A. Zalesky, “Machine learning prediction of cognition from functional connectivity: Are feature weights reliable?,” Neuroimage, vol. 245, p. 118648, Dec. 2021.
[5] S. Marek et al., “Reproducible brain-wide association studies require thousands of individuals,” Nature, vol. 603, no. 7902, pp. 654–660, Mar. 2022.
[6] J. Chen et al., “There is no fundamental trade-off between prediction accuracy and feature importance reliability,” bioRxiv, p. 2022.08.08.503167, 11-Aug-2022.
[7] P. Feng et al., “Determining four confounding factors in individual cognitive traits prediction with functional connectivity: an exploratory study,” Cereb. Cortex, May 2022.
[8] A. Schaefer et al., “Local-Global Parcellation of the Human Cerebral Cortex from Intrinsic Functional Connectivity MRI,” Cereb. Cortex, vol. 28, no. 9, pp. 3095–3114, Sep. 2018.
[9] T. He et al., “Deep neural networks and kernel regression achieve comparable accuracies for functional connectivity prediction of behavior and demographics,” Neuroimage, vol. 206, p. 116276, Feb. 2020.
[10] L. Q. R. Ooi et al., “Comparison of individualized behavioral predictions across anatomical, diffusion and functional connectivity MRI,” Neuroimage, vol. 263, no. 119636, p. 119636, Sep. 2022.
Figures