0314
Establishing Magnetic Resonance Parkinsonism Index reference ranges to distinguish Progressive Supranuclear Palsy and Corticobasal Syndrome1Advanced Clinical Imaging Technology, Siemens Healthineers International AG, Lausanne, Switzerland, 2LTS5, École Polytechnique Fédérale de Lausanne, Lausanne, Switzerland, 3Department of Diagnostic and Interventional Radiology, Lausanne University Hospital and University of Lausanne, Lausanne, Switzerland, 4Siemens Healthineers India, Bangalore, India, 5International Institute of Information Technology, Bangalore, India, 6Paris Brain Institute, ICM, Inserm U 1127, CNRS UMR 7225, Sorbonne Université, F-75013, Paris, France
Synopsis
Keywords: Parkinson's Disease, Neurodegeneration, MRPI; Brain; Reference ranges; Corticobasal syndrome; Progressive supranuclear palsy
Motivation: distinguishing Parkinsonian syndromes can be challenging since these diseases exhibit overlapping clinical manifestation.
Goal(s): provide extended reference ranges of established biomarkers to distinguish Progressive Supranuclear Palsy (PSP) from Corticobasal Syndrome (CBS) in a fast, automated way.
Approach: we build reference ranges of relevant brain measurements from a large cohort of healthy subjects; then, we compute corresponding Z-scores of these measurements to distinguish PSP and CBS patients.
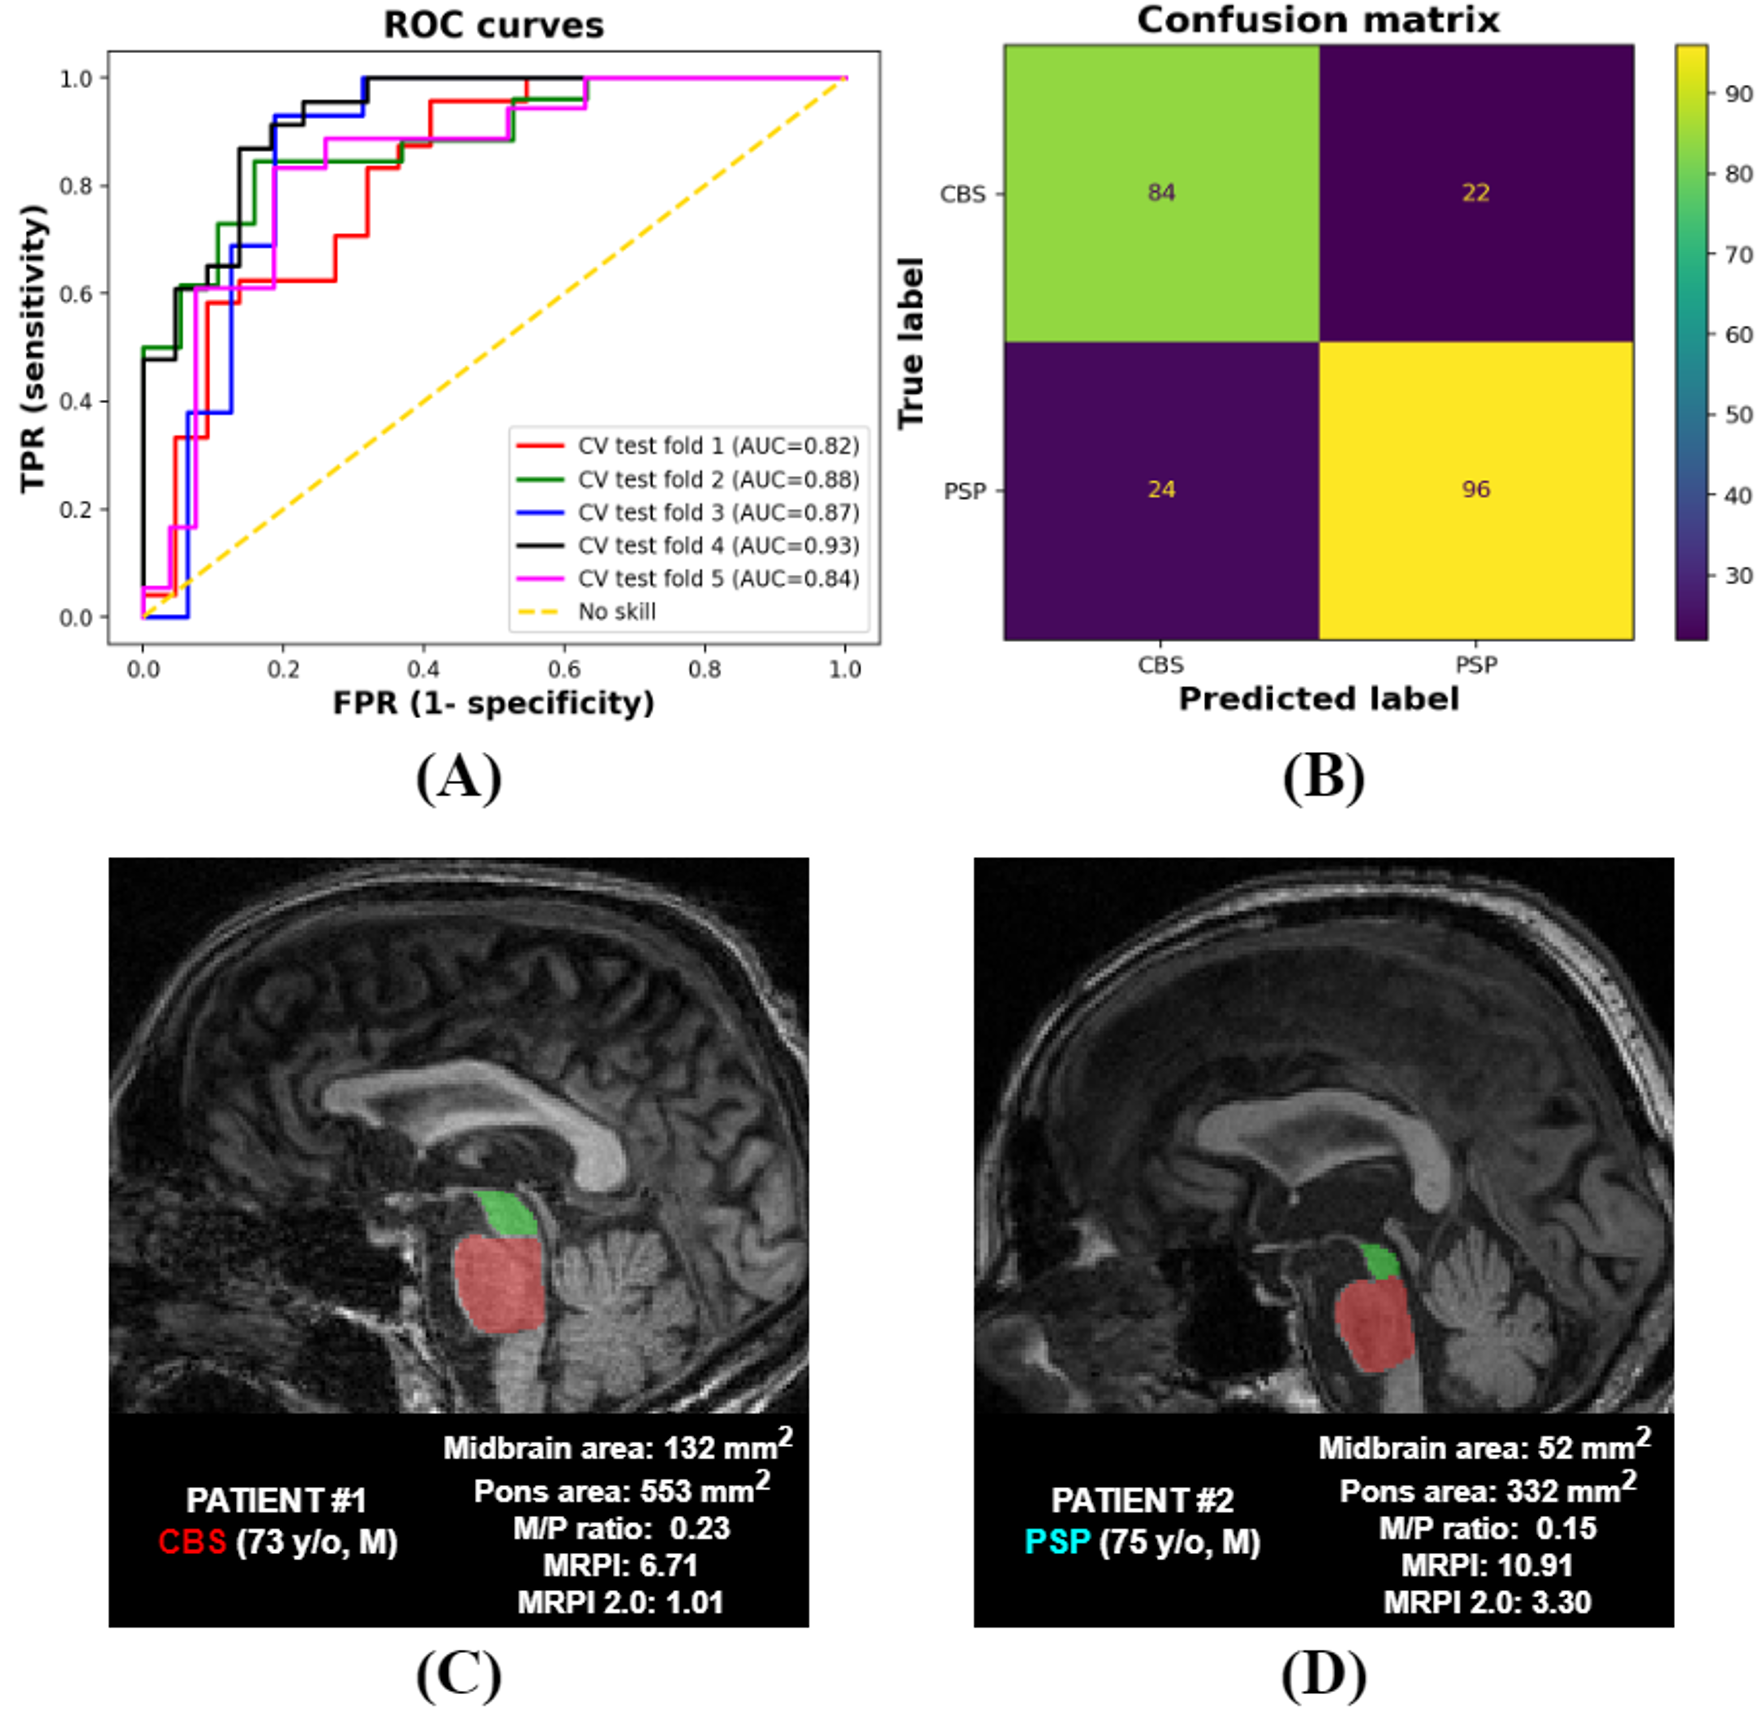
Results: the midbrain area is the most informative measurement to discern PSP and CBS. A logistic regressor that combines Z-scores of multiple brain measurements achieves mean AUC of .87 in 5-fold-cross-validation when distinguishing PSP and CBS.
Impact: We release extended age-/sex-specific reference ranges built from healthy controls for several biomarkers used to differentiate Parkinsonian disorders. Our ranges show notable variation with age/sex and could be used by radiologists as benchmark to better differentiate Parkinsonian subtypes.
Introduction
MRI-based biomarkers derived from volumetric changes of infratentorial structures proved to be useful to differentiate different Parkinsonian syndromes [1,2]. Together with cross-sectional biomarkers, longitudinal changes and reference values of these structures also showed potential for differential diagnosis [3,4]. One example of disease discrimination among Parkinsonian disorders is the one between progressive supranuclear palsy (PSP) and corticobasal syndrome (CBS), the most common presentation of corticobasal degeneration (CBD) [5]. Although PSP and CBS exhibit pronounced overlap in clinical manifestation (some CBS patients can be classified as PSP variants), Ling et al. outlined distinct neuropathological, biochemical, and genetic features [6]. Recently, Illán-Gala et al [2] presented results for differentiating PSP/CBD using the Magnetic Resonance Parkinsonism Index (MRPI) [7] and other MRI-derived atrophy measures. In line with prior work, we aim to distinguish PSP/CBS patients using morphological descriptors of the brainstem, ventricles, and cerebellar peduncles. This work has three contributions:- provide novel age-/sex- specific reference ranges for each measurement on a larger age range compared to [3]
- investigate the use of single age-/sex- specific Z-scores (built from our reference ranges) to classify PSP/CBS
- assess classification performances of a logistic regressor that combines all Z-scores together
Materials & Methods
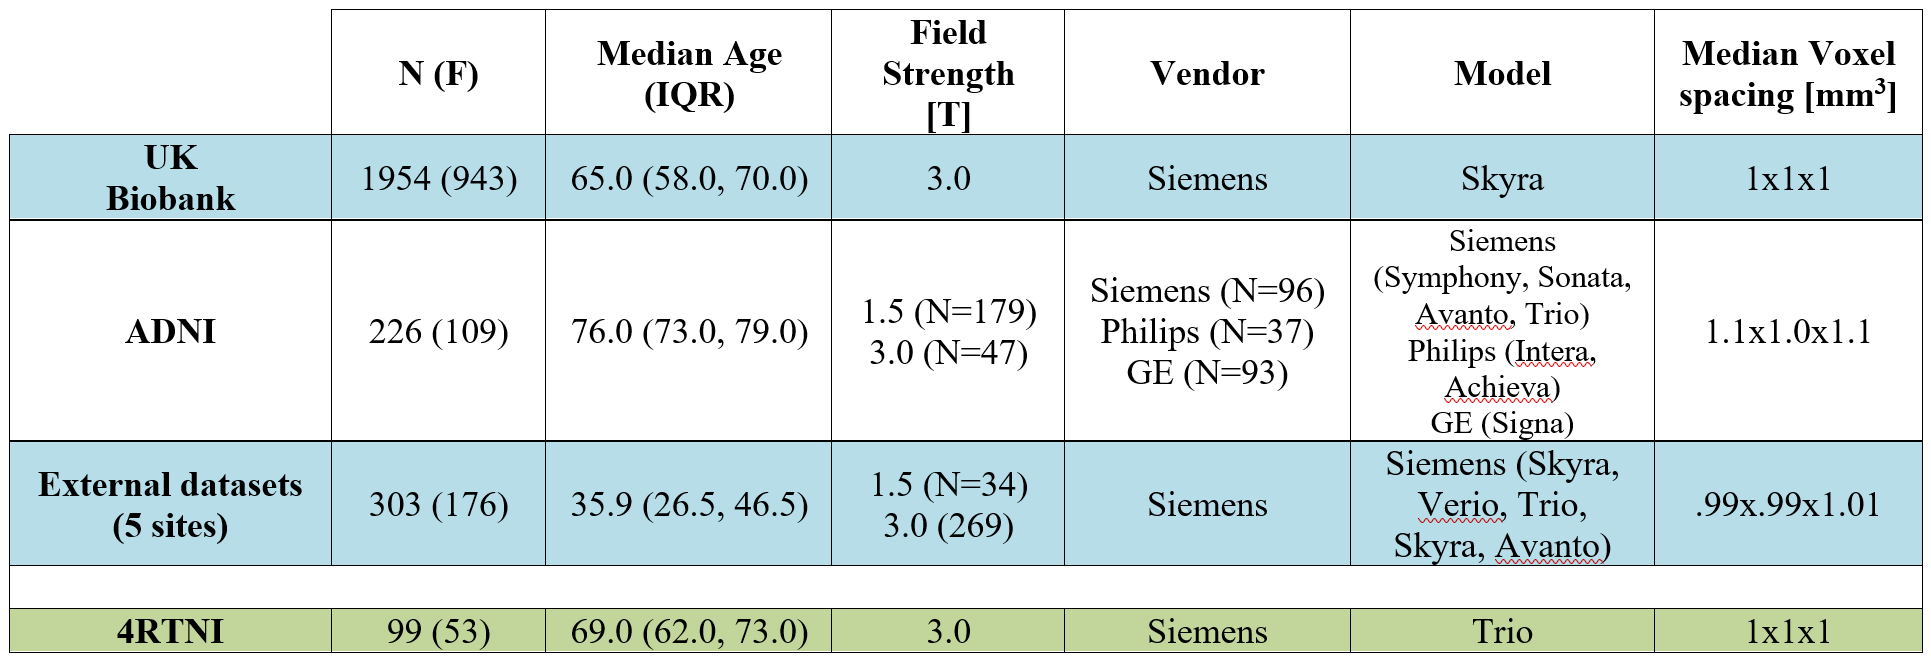
2.1 DataTo generate age-/sex- specific reference ranges for MRPI, MRPI 2.0 [8], and relevant brainstem measurements, we collected 3D-T1weighted scans of N=2495 adult healthy controls belonging to 7 different datasets (2/7 open datasets – UK Biobank [9], ADNI [10] based on pre-defined selection process - and 5/7 hospitals following same selection guidelines). To investigate the discriminative validity of our morphological measurements between PSP/CBS patients, we used the 4RTNI dataset [11]. This comprises N=99 patients (53 females), out of which N=54 have PSP-Richardson’s syndrome and N=45 have CBS (selection criteria in [12]). Figure 1 shows demographic information and acquisition parameters both for healthy controls and for 4RTNI.
2.2 Methods
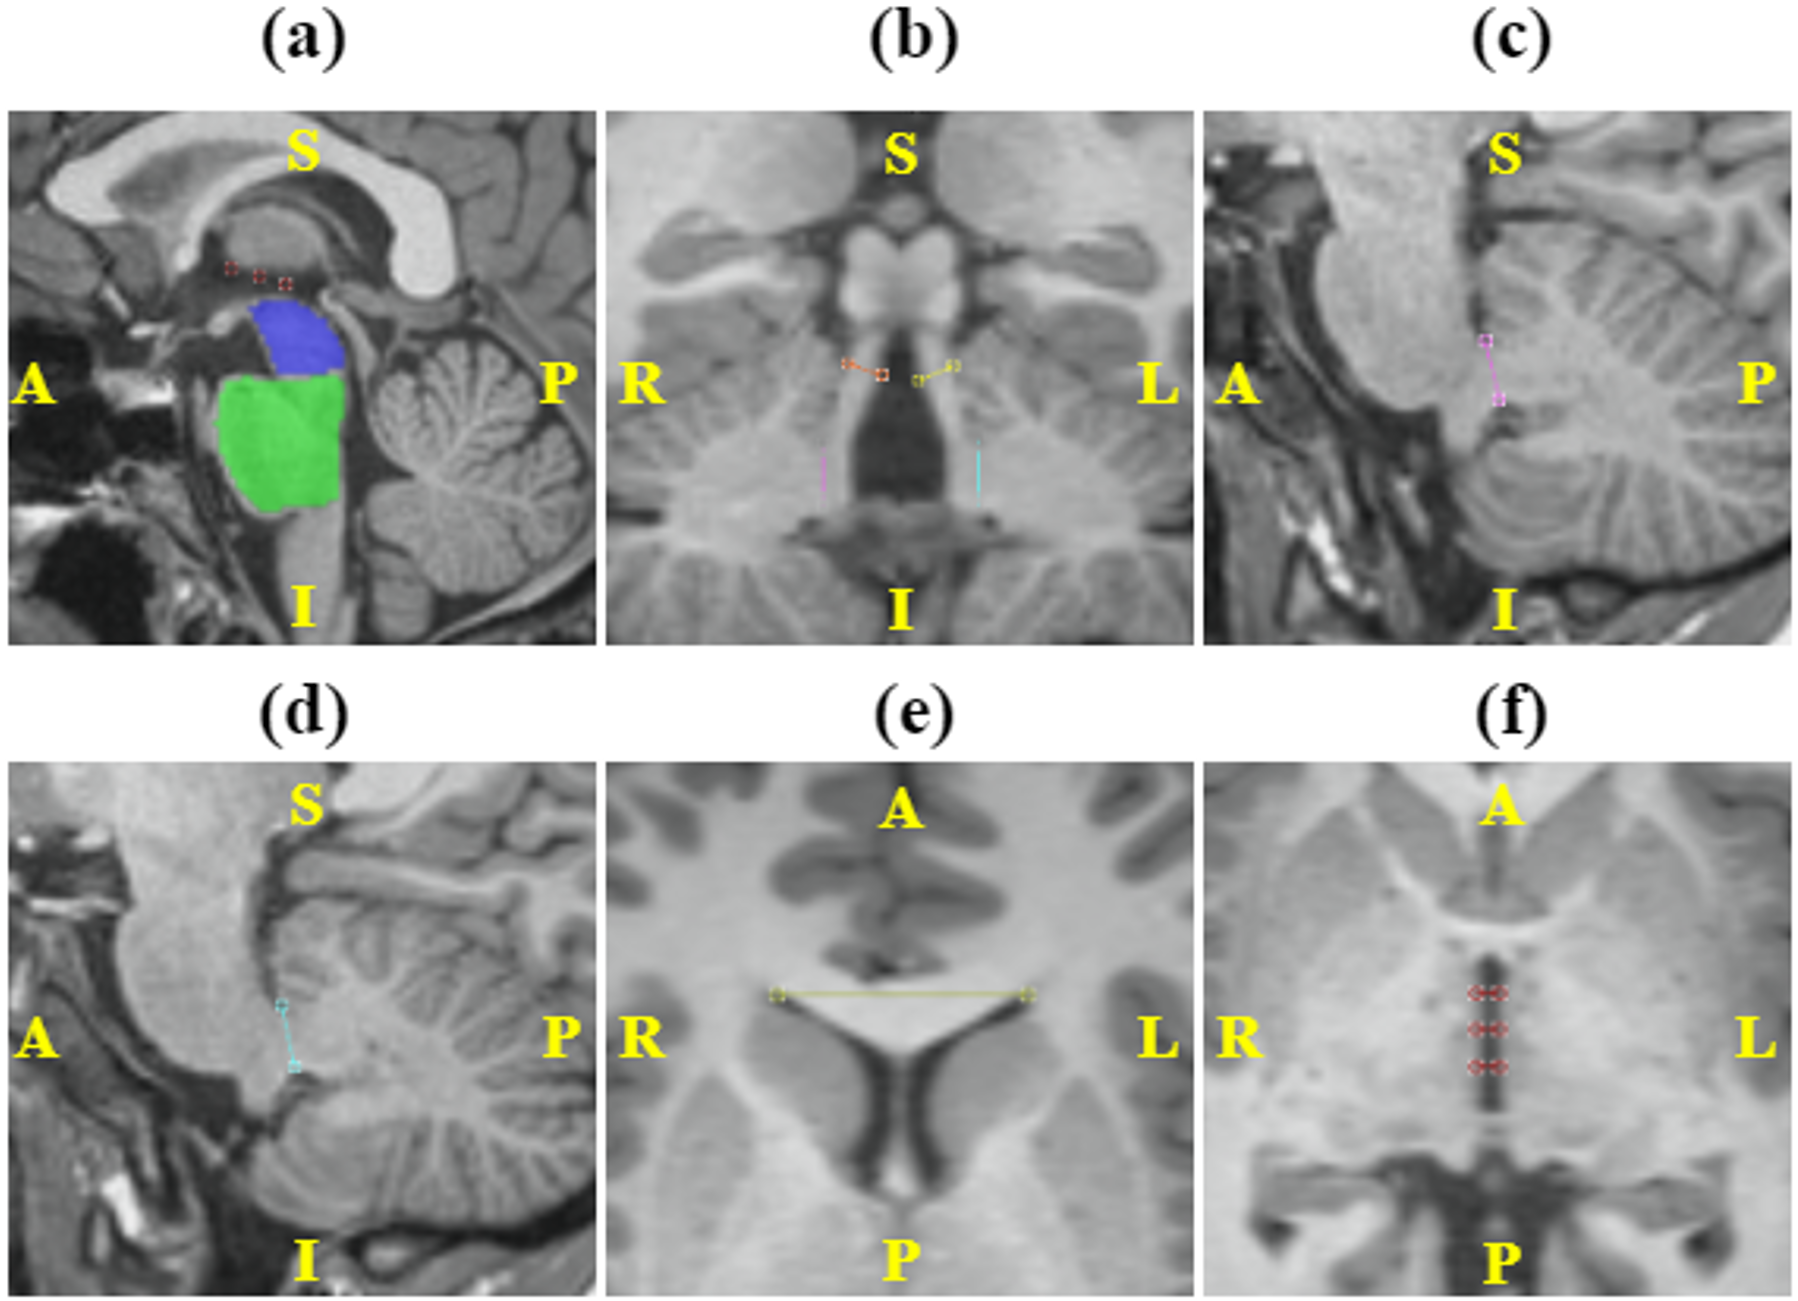
MRPI, MRPI 2.0, midbrain area, pons area, midbrain-to-pons ratio (M/P), mean middle cerebellar peduncles’ (MCP) width, mean superior cerebellar peduncles’ (SCP) width, lateral ventricles frontal horns’ (FH) width, and third ventricle width were automatically extracted with the Quantitative Brain Assessment Toolkit (QBAT, v2.1.0) research application [13] (Siemens Healthineers, Erlangen, Germany) for all subjects. Figure 2 exemplarily shows the main measurements of interest segmented with QBAT for a 23-year-old female patient. For all the above-mentioned measurements, we performed a regression on the healthy controls comparing a quadratic model ($$$y_{quadratic}=a*age^{2}+b*sex+c$$$) with a log-normal linear model ($$$y_{log-linear}=a*age+b*sex+c$$$) (i.e., linear regression applied on log-transformed measurements). For each measurement, we picked the model with lowest mean squared error (MSE). Using the best fitting model, we then extracted age-/sex- specific reference ranges and calculated the Z-scores (number of standard deviations away from the mean) on the 4RTNI patients. To compare the Z-scores distributions of PSP and CBS patients we ran, for each measurement, a two-tailed Mann-Whitney U-test [14] with significance level $$$\alpha=0.05$$$ and correcting with Bonferroni to $$$\alpha_{Bonf}=\alpha/9=0.005$$$ (since 9 measurements were compared). Last, we combined for every patient the Z-score of all measurements, we split patients in a 5-fold-cross-validation, and we assessed classification performances on the aggregated test sets with a logistic regressor.
Results
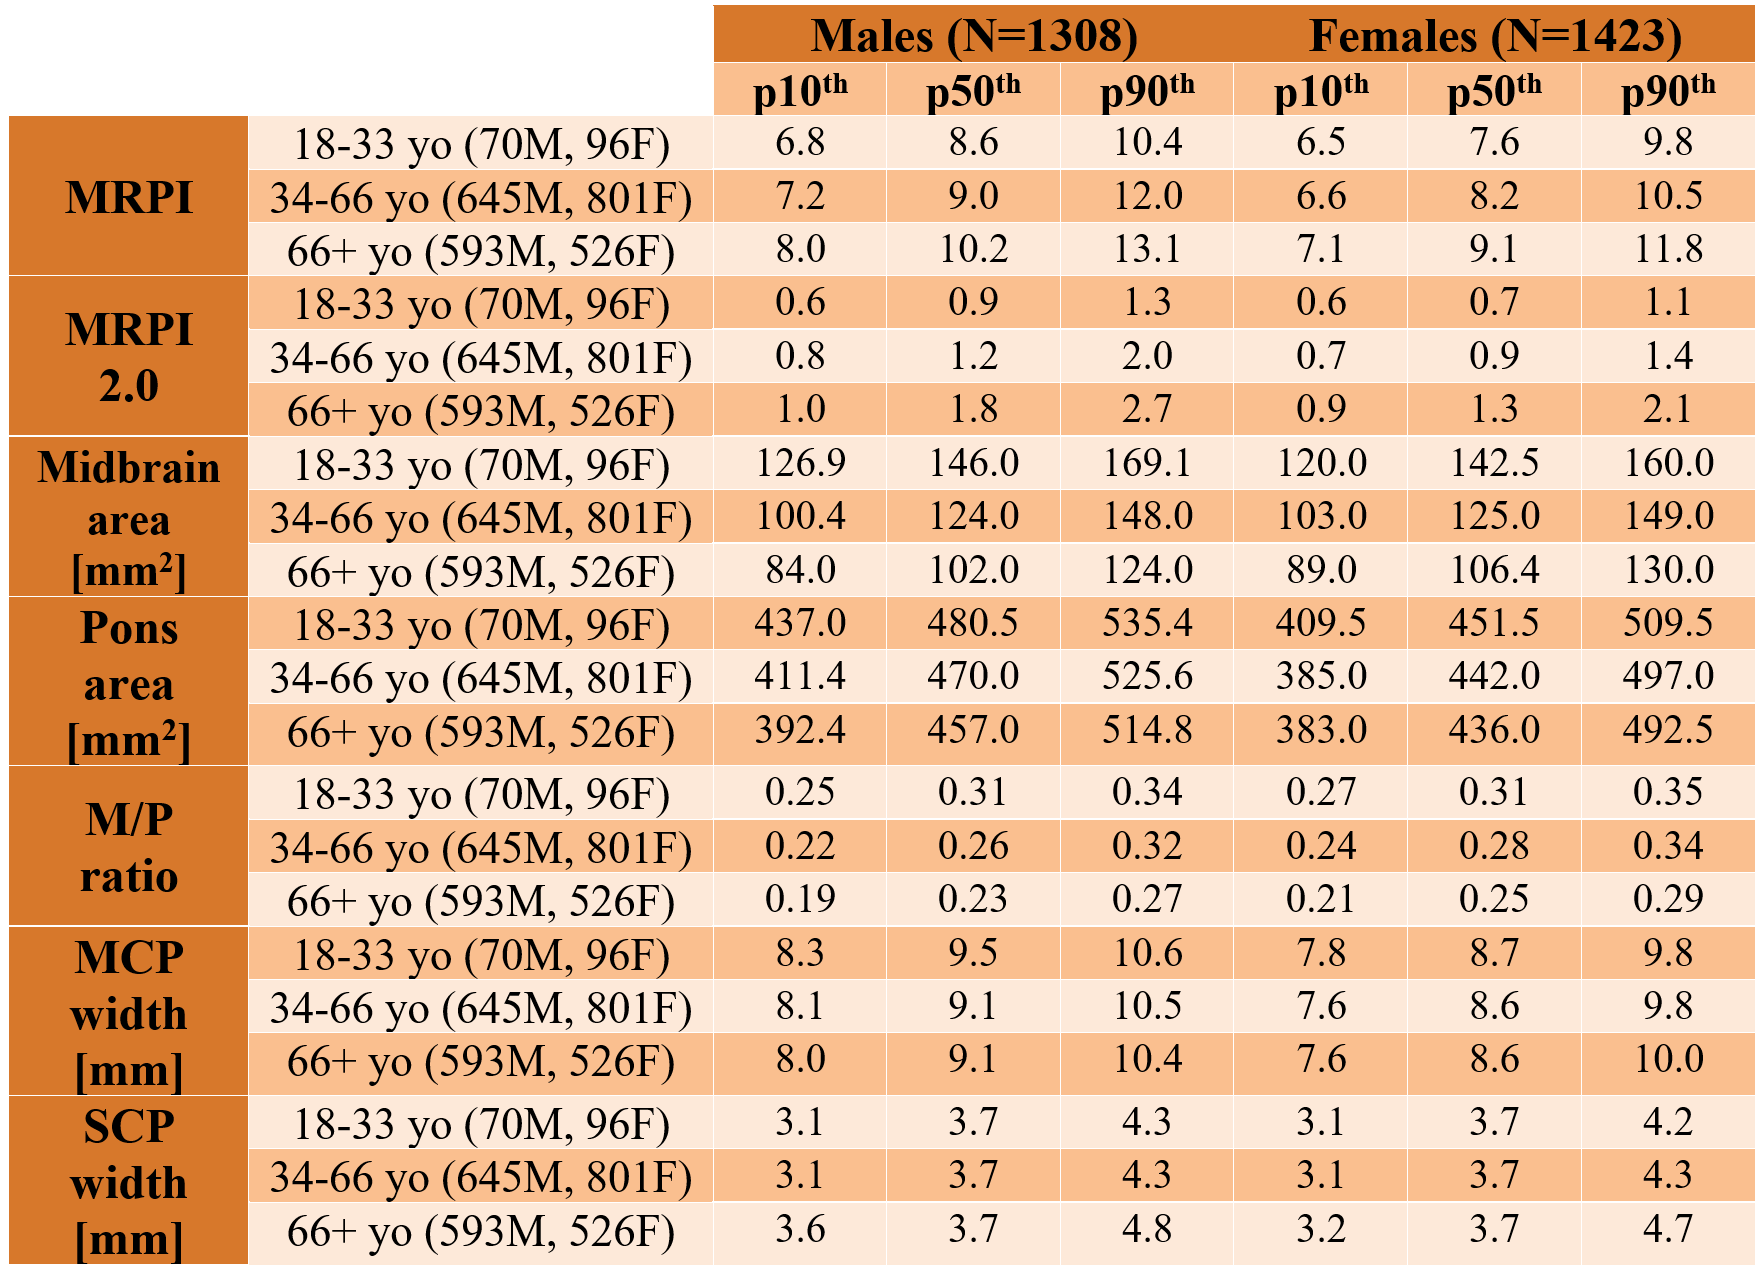
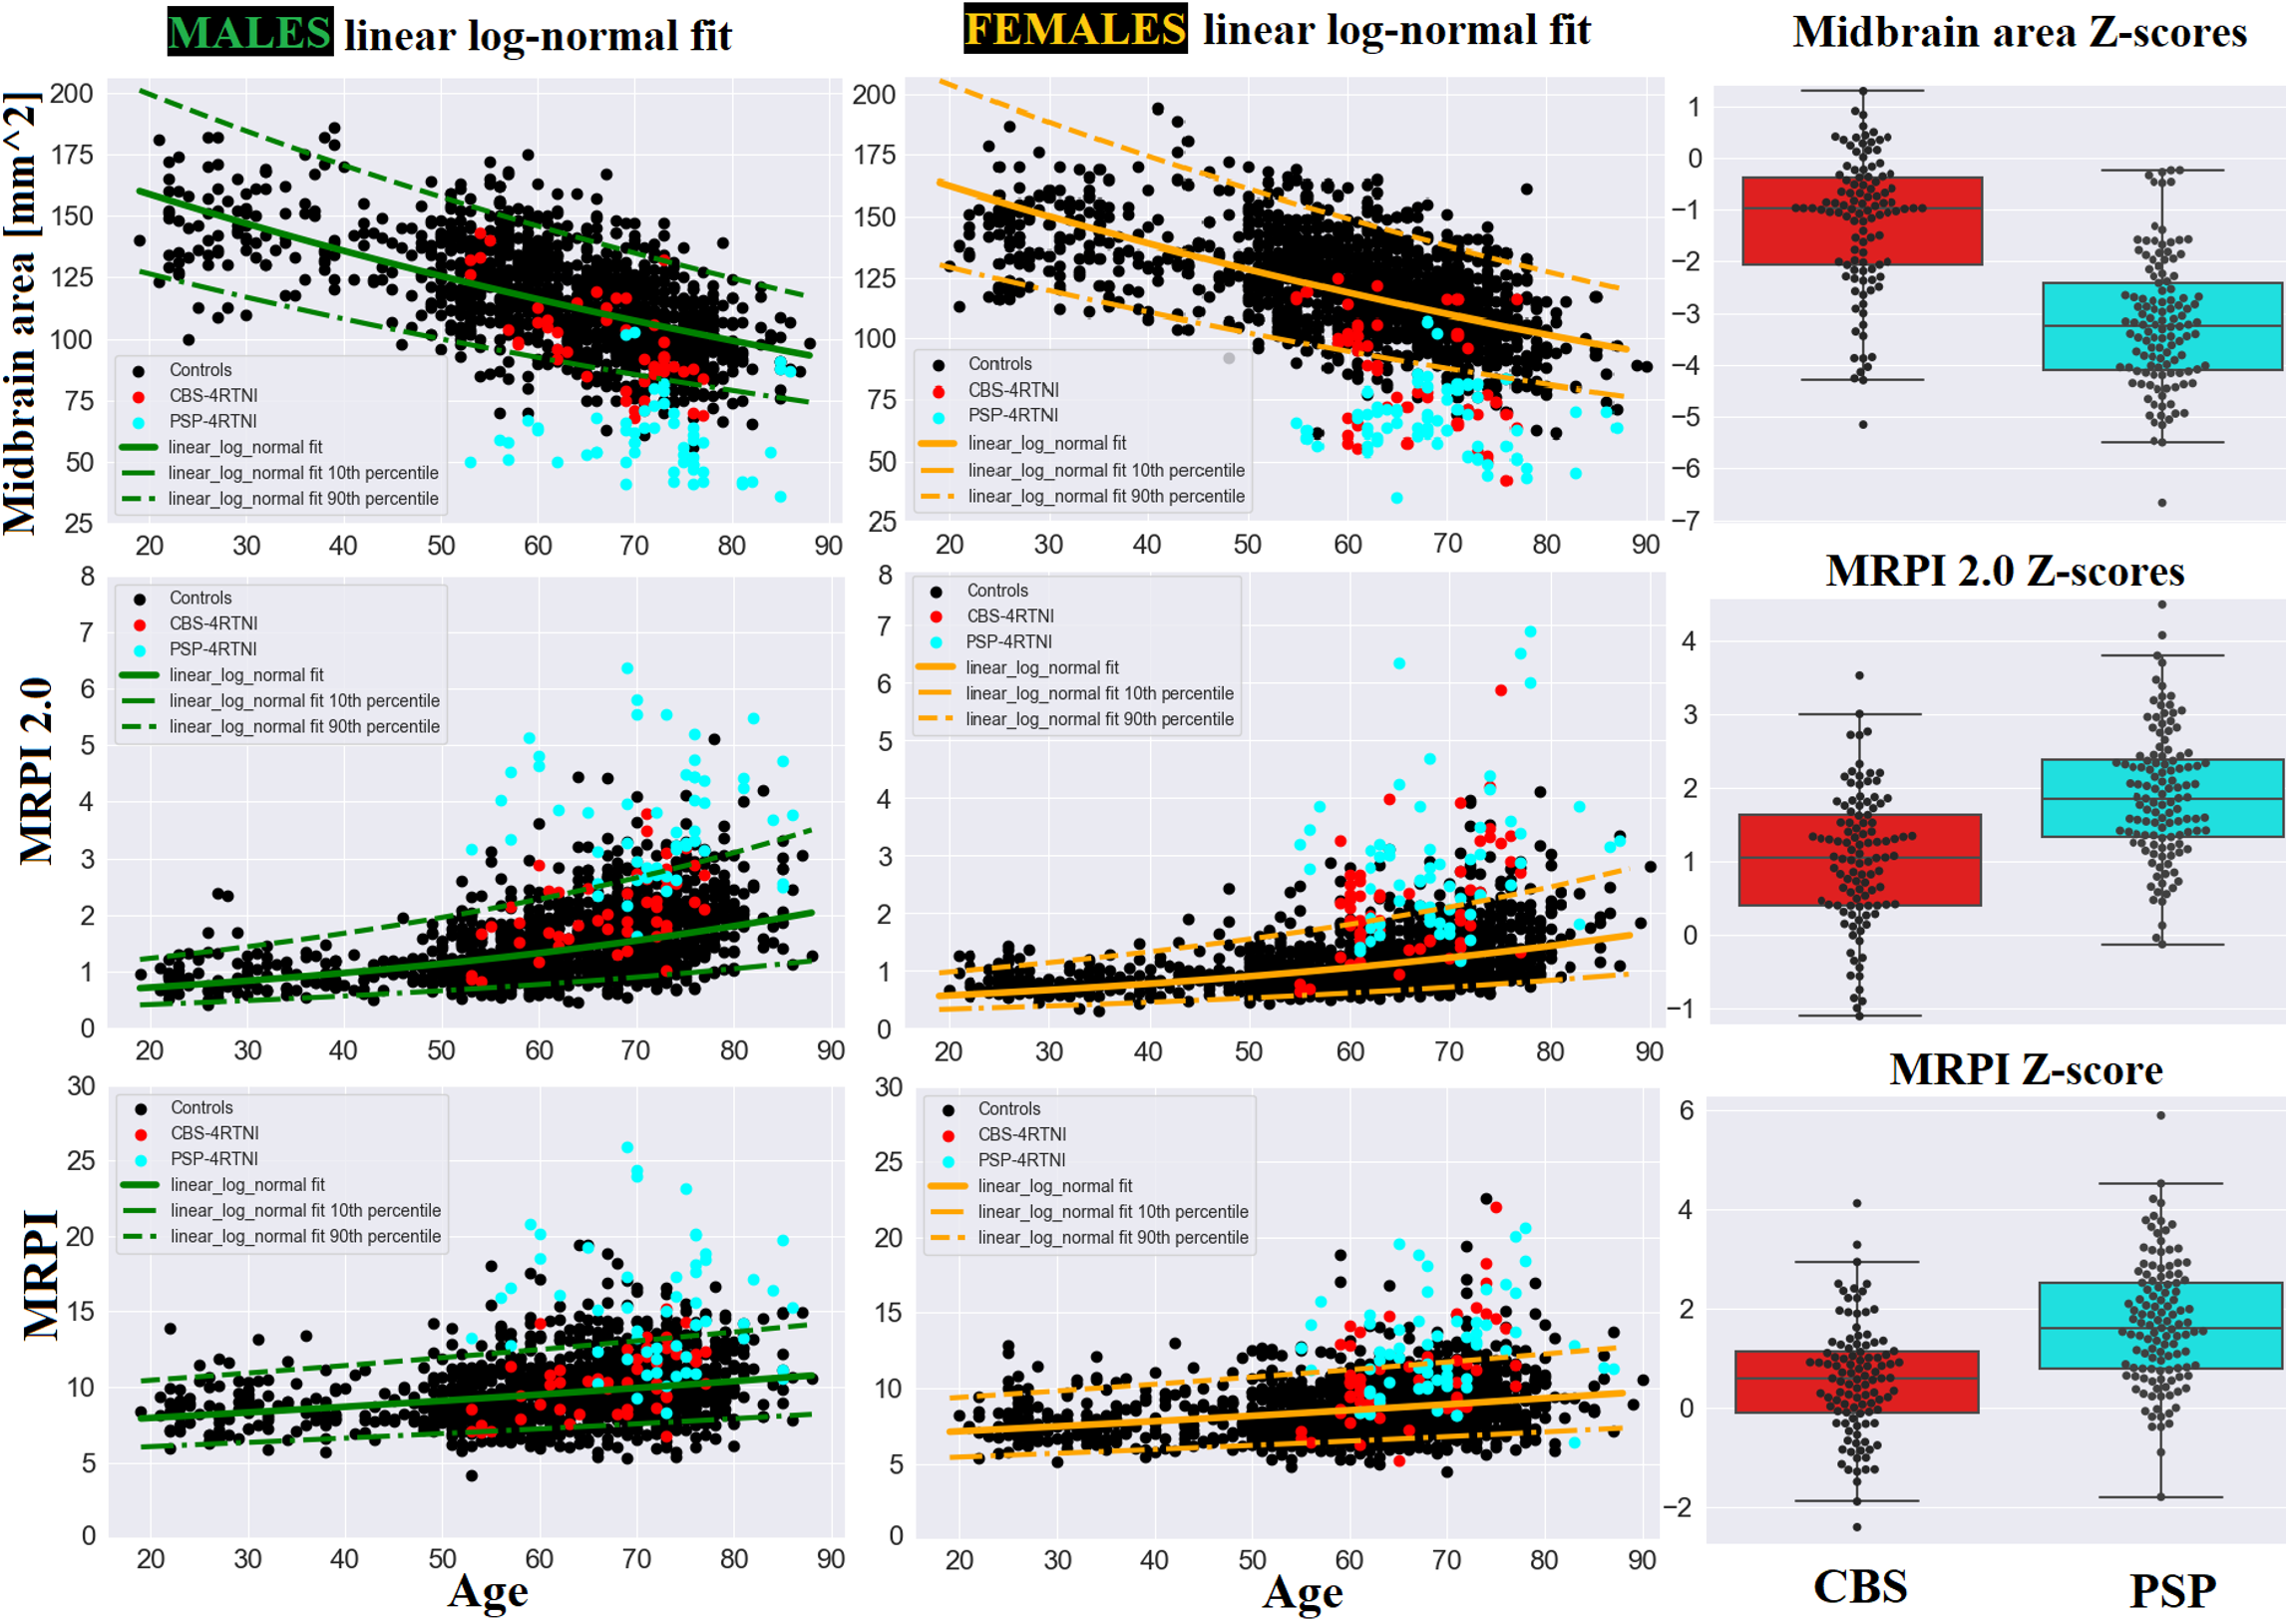
Reference ranges for the measurements of interest are provided in Figure 3 (split in age groups as in [3]). The log-normal regression model was the best fitting curve (i.e., lower MSE) for all measurements except the M/P ratio for which the quadratic fit was more accurate. When comparing Z-scores between PSP/CBS patients with the Mann-Whitney test, we found a significant difference for all measurements, except for FH distance ($$$p=0.47$$$). In particular, the Z-scores that better distinguished PSP/CBS were those of midbrain area ($$$p=10^{-19}$$$), M/P ratio ($$$p=10^{-15}$$$) and MRPI 2.0 ($$$p=10^{-11}$$$). Figure 4 shows three examples (midbrain area, MRPI 2.0, MRPI) of reference ranges and corresponding Z-score distributions for the 4RTNI patients (M/P ratio not reported since highly correlated with midbrain area). When combining multiple Z-scores, the logistic regressor attained mean AUC=.87. Figure 5 depicts ROC curves for the five test folds, the corresponding confusion matrix, and two exemplary cases of CBS/PSP patients.Discussion
This work presented extended age-/sex- specific reference ranges for MRPI-related measurements. These ranges demonstrate how diagnostic thresholds vary considerably with age/sex, and could be used by radiologists to better distinguish Parkinsonian syndromes. Both single Z-scores and a combination of multiple Z-scores proved effective to differentiate PSP/CBS patients. Future work could include additional atrophy-related metrics and broaden the classification to PSP vs. CBD (instead of CBS) which is more clinically relevant. Also, the distinction CBS vs. healthy controls needs further investigation as most CBS patients lie within 10th-90th percentiles.Acknowledgements
Data used in preparation of this article were obtained from the 4-Repeat Tauopathy Neuroimaging Initiative (4RTNI) database (http://4rtni-ftldni.ini.usc.edu). The investigators at 4RTNI contributed to the design and implementation of 4RTNI and/or provided data, but did not participate in analysis or writing of this abstract. 4RTNI data are disseminated by the Laboratory for Neuro Imaging at the University of Southern California.References
[1] Chougar, Lydia, et al. "The role of magnetic resonance imaging for the diagnosis of atypical parkinsonism." Frontiers in Neurology 11 (2020): 665.
[2] Illán-Gala, Ignacio, et al. "Diagnostic accuracy of magnetic resonance imaging measures of brain atrophy across the spectrum of progressive supranuclear palsy and corticobasal degeneration." JAMA network open 5.4 (2022): e229588-e229588.
[3] Ruiz, Sofia Tønnessen, et al. "Normative data for brainstem structures, the midbrain-to-pons ratio, and the magnetic resonance parkinsonism index." American Journal of Neuroradiology 43.5 (2022): 707-714.
[4] Quattrone, Aldo, et al. "Magnetic Resonance Parkinsonism Index for evaluating disease progression rate in progressive supranuclear palsy: A longitudinal 2-year study." Parkinsonism & Related Disorders 72 (2020): 1-6.
[5] Constantinides, Vasilios C., et al. "Corticobasal degeneration and corticobasal syndrome: A review." Clinical Parkinsonism & Related Disorders 1 (2019): 66-71.
[6] Ling, Helen, and Antonella Macerollo. "Is it useful to classify PSP and CBD as different disorders? Yes." Movement disorders clinical practice 5.2 (2018): 145.
[7] Quattrone, Aldo, et al. "MR imaging index for differentiation of progressive supranuclear palsy from Parkinson disease and the Parkinson variant of multiple system atrophy." Radiology 246.1 (2008): 214-221.
[8] Quattrone, Aldo, et al. "A new MR imaging index for differentiation of progressive supranuclear palsy-parkinsonism from Parkinson's disease." Parkinsonism & related disorders 54 (2018): 3-8.
[9] Littlejohns, Thomas J., et al. "The UK Biobank imaging enhancement of 100,000 participants: rationale, data collection, management and future directions." Nature communications 11.1 (2020): 2624.
[10] Wyman, Bradley T., et al. "Standardization of analysis sets for reporting results from ADNI MRI data." Alzheimer's & Dementia 9.3 (2013): 332-337. Alzheimer’s Disease Neuroimaging Initiative, https://adni.loni.usc.edu/about/
[11] Four Repeat Tauopathy Neuroimaging Initiative, https://ida.loni.usc.edu/login.jsp
[12] Dutt, Shubir, et al. "Progression of brain atrophy in PSP and CBS over 6 months and 1 year." Neurology 87.19 (2016).
[13] Venkategowda, Di Noto, et al., “CNN-based Automated Pipeline for Accurate Computation of Magnetic Resonance Parkinsonism’s Index Measurements”, Submitted in parallel, ISMRM 2024
[14] Mann, Henry B., and Donald R. Whitney. "On a test of whether one of two random variables is stochastically larger than the other." The annals of mathematical statistics (1947): 50-60.
Figures