0313
Multi-parametric radiomics of T1and susceptibility-weighted imaging for differentiating Parkinson’s disease and multiple system atrophy.1the First hospital of China Medical University, Shenyang,Liaoning, China, 2MR Research Collaboration, Siemens Healthineers, Beijing China, Beijing, China, 3the First hospital of China Medical University, Shenyang, China
Synopsis
Keywords: Radiomics, Neurodegeneration
Motivation: Aim to differentiate PD from MSA in the early stage.
Goal(s): To build a radiomic model based on features derived from basal ganglia regions by using commonly applied sequences in clinical settings, to distinguish between PD and MSA.
Approach: This study constructed three machine learning models- logistic regression, support vector machine and light gradient boosting method to differentiate PD motor subtypes.
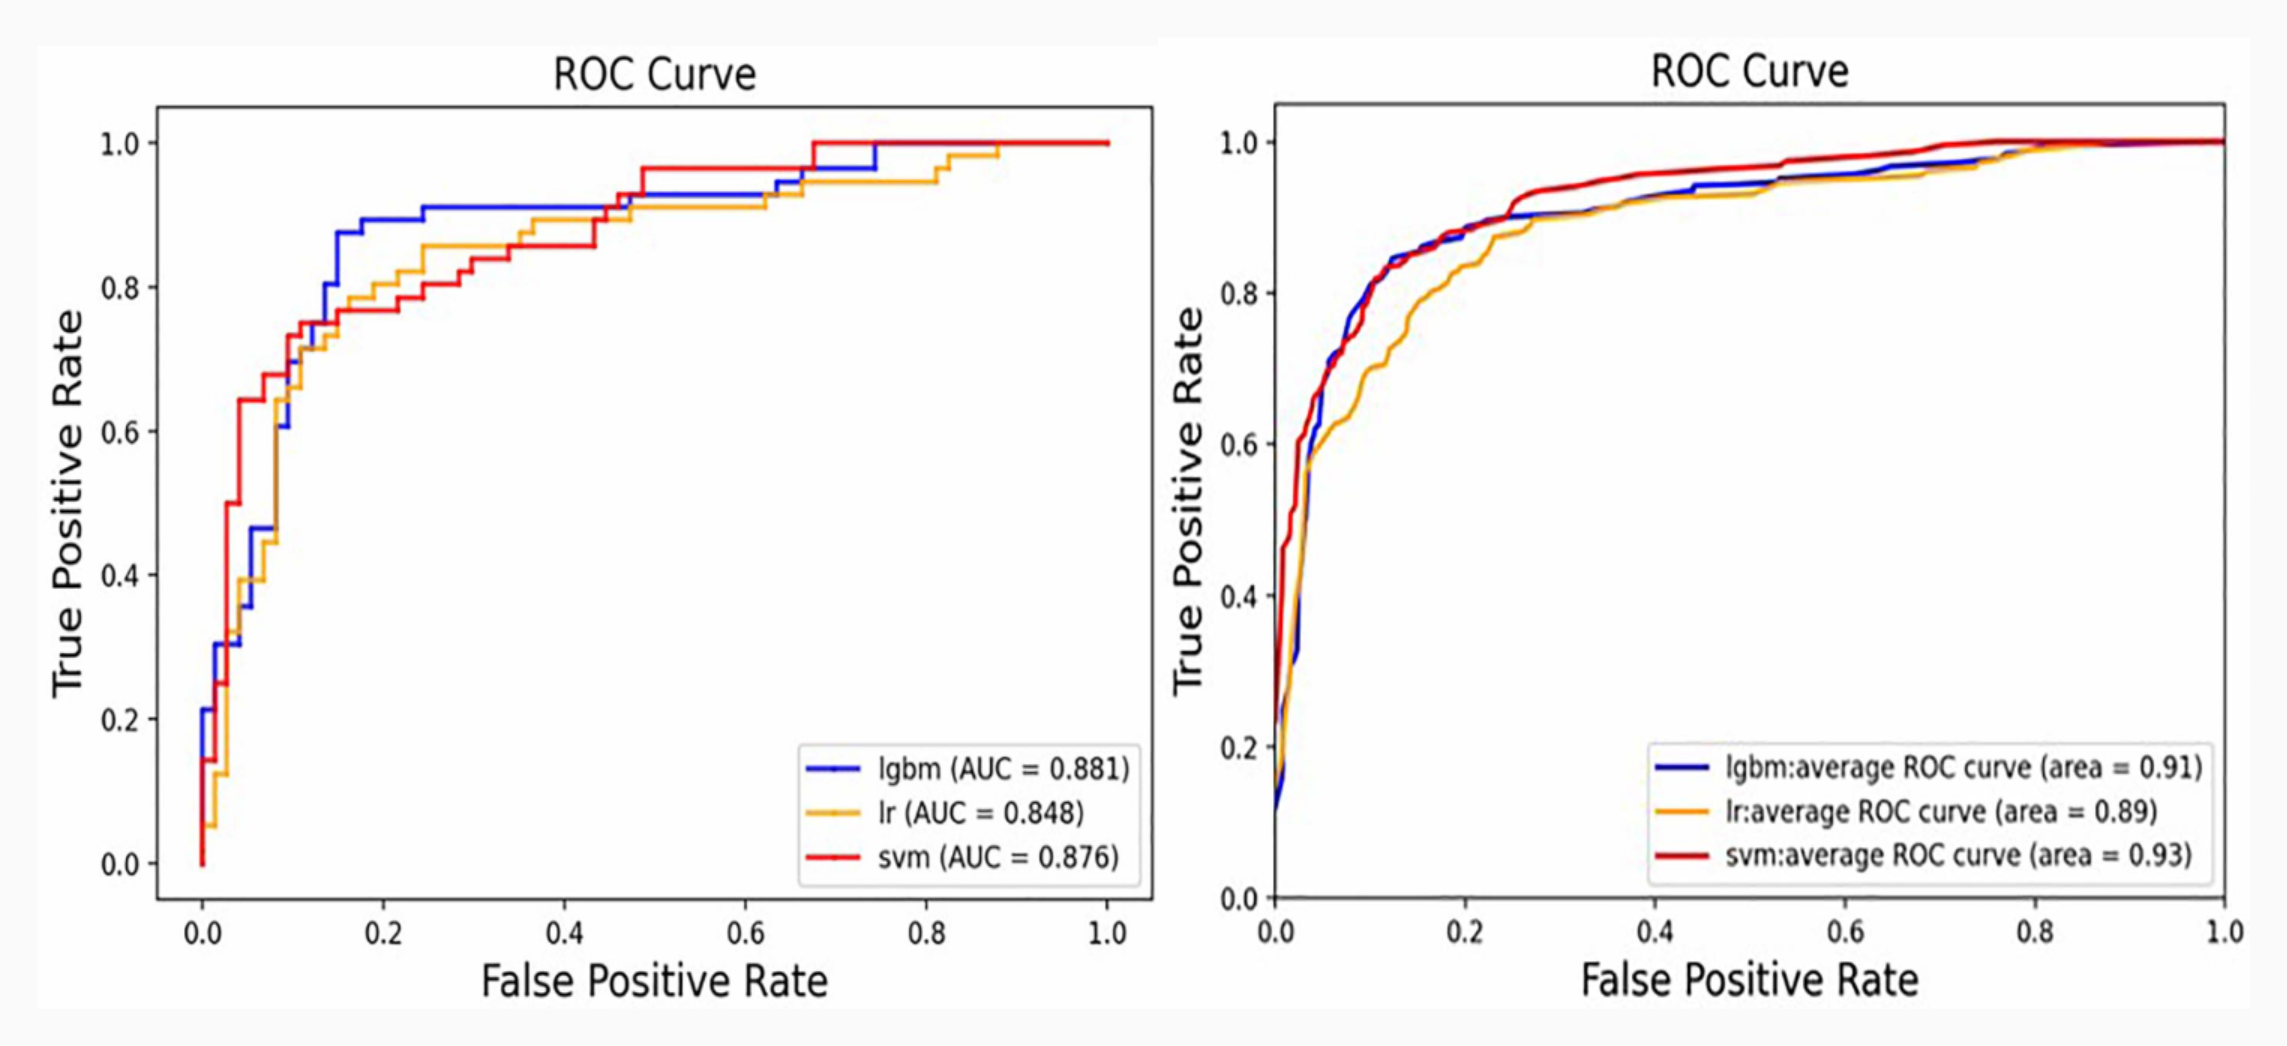
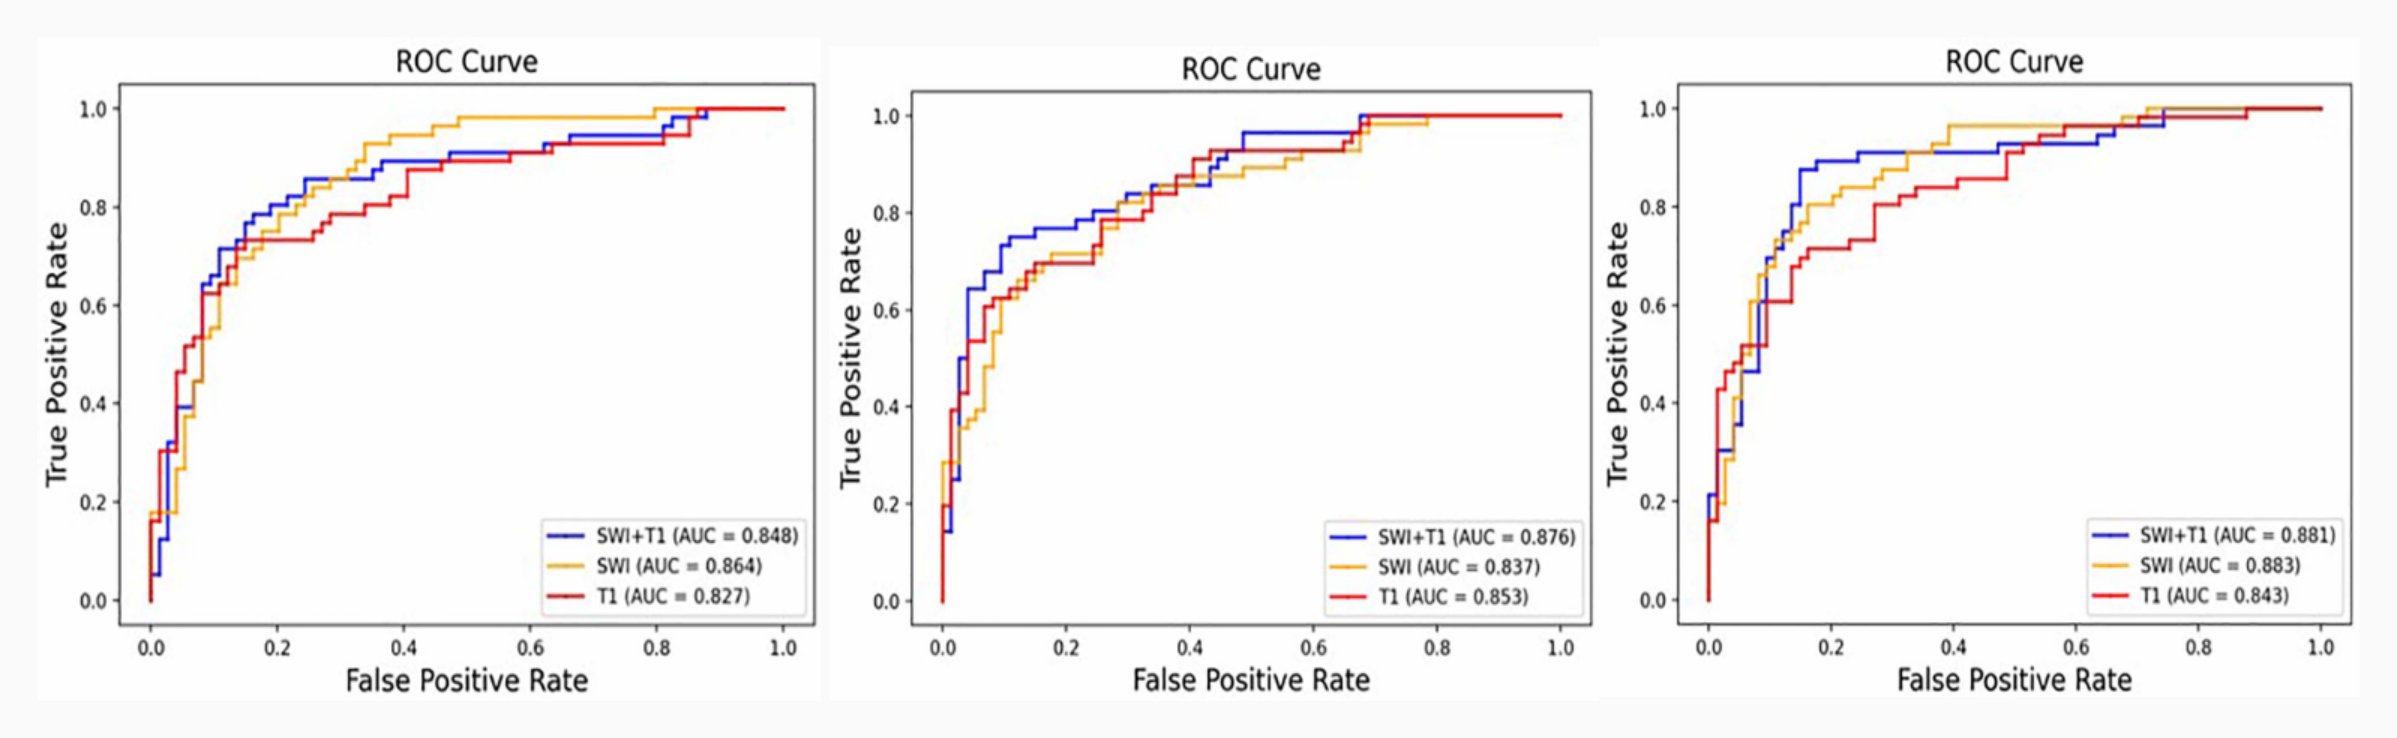
Results: The light gradient boosting machine trained by features extracted from SWI and T1 sequences achieved a great classification performance between PD and MSA (AUC=0.881).
Impact: This study has developed an effective classification model using commonly utilized clinical MRI sequences, which provides a valuable tool for distinguishing between PD and MSA in clinical practice.
Introduction
Idiopathic Parkinson’s disease (PD) and multiple system atrophy (MSA) are two common neurodegenerative conditions, which share overlapping Parkinson’s motor symptoms, particularly in the early stages [1]. Clinicians often face a major challenge in differentiating between PD and MSA patients due to the reliance on subjective factors such as symptoms, physical examination, and the expertise of the neurologist for clinical diagnosis. These subjective assessments may be susceptible to personal bias, leading to diagnostic uncertainty. Compared with PD, MSA is characterized by a more rapid progression and poorer prognosis. Therefore, the development of a practical and sensitive diagnostic tool is crucial for accurate distinguishing MSA from PD. [2]. This study aims to build a radiomic model based on features derived from basal ganglia regions, using commonly applied sequences in clinical settings, to distinguish between PD and MSA.Methods
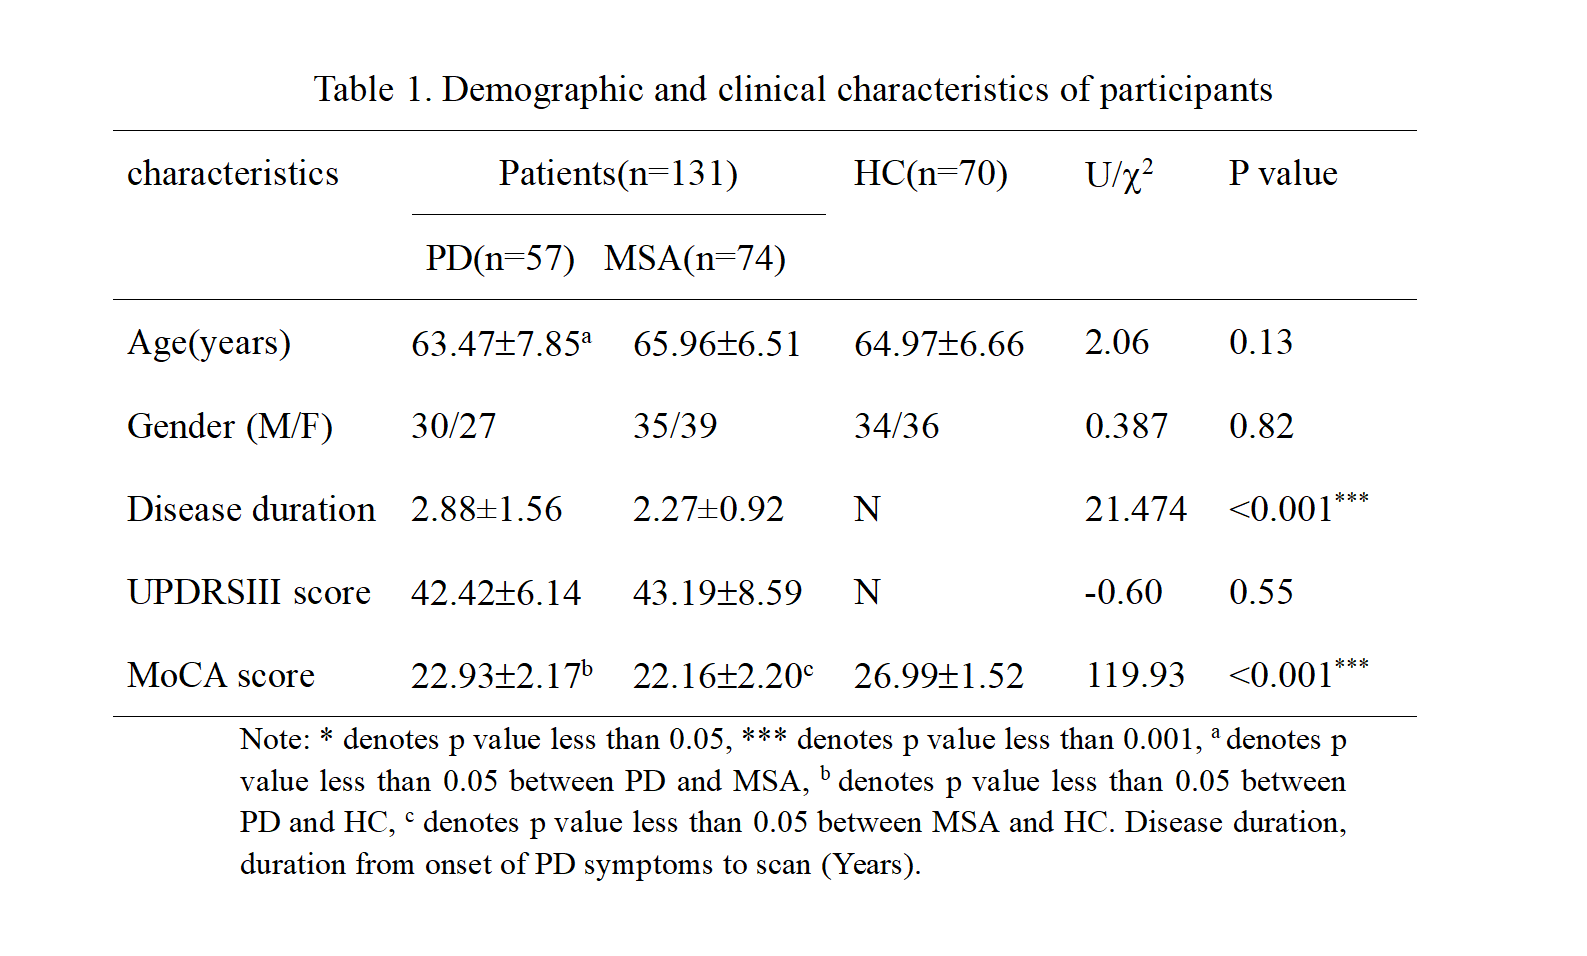
A total of 201 participants, including 57 patients with PD, 74 with MSA, and 70 healthy control (HCs), underwent T1WI and SWI scans on a 3T MRI system. From the 12 subcortical nuclei (e.g. red nucleus, substantia nigra, subthalamic nucleus, putamen, globus pallidus, and caudate nucleus), 2640 radiomic features were extracted from both T1WI and SWI scans. Three classification models - logistic regression (LR), support vector machine (SVM), and light gradient boosting machine (LGBM) - were used to distinguish between MSA and IPD, and MSA, IPD, and HC, respectively, based on T1WI features, SWI features, and a combination of T1WI and SWI features. Five-fold cross-validation was used to evaluate the performance of the models with metrics such as sensitivity, specificity, accuracy, and area under the receiver operating curve (AUC). During each fold, the ANOVA and least absolute shrinkage and selection operator (LASSO) methods were used to identify the most relevant subset of features for the model training process.Results
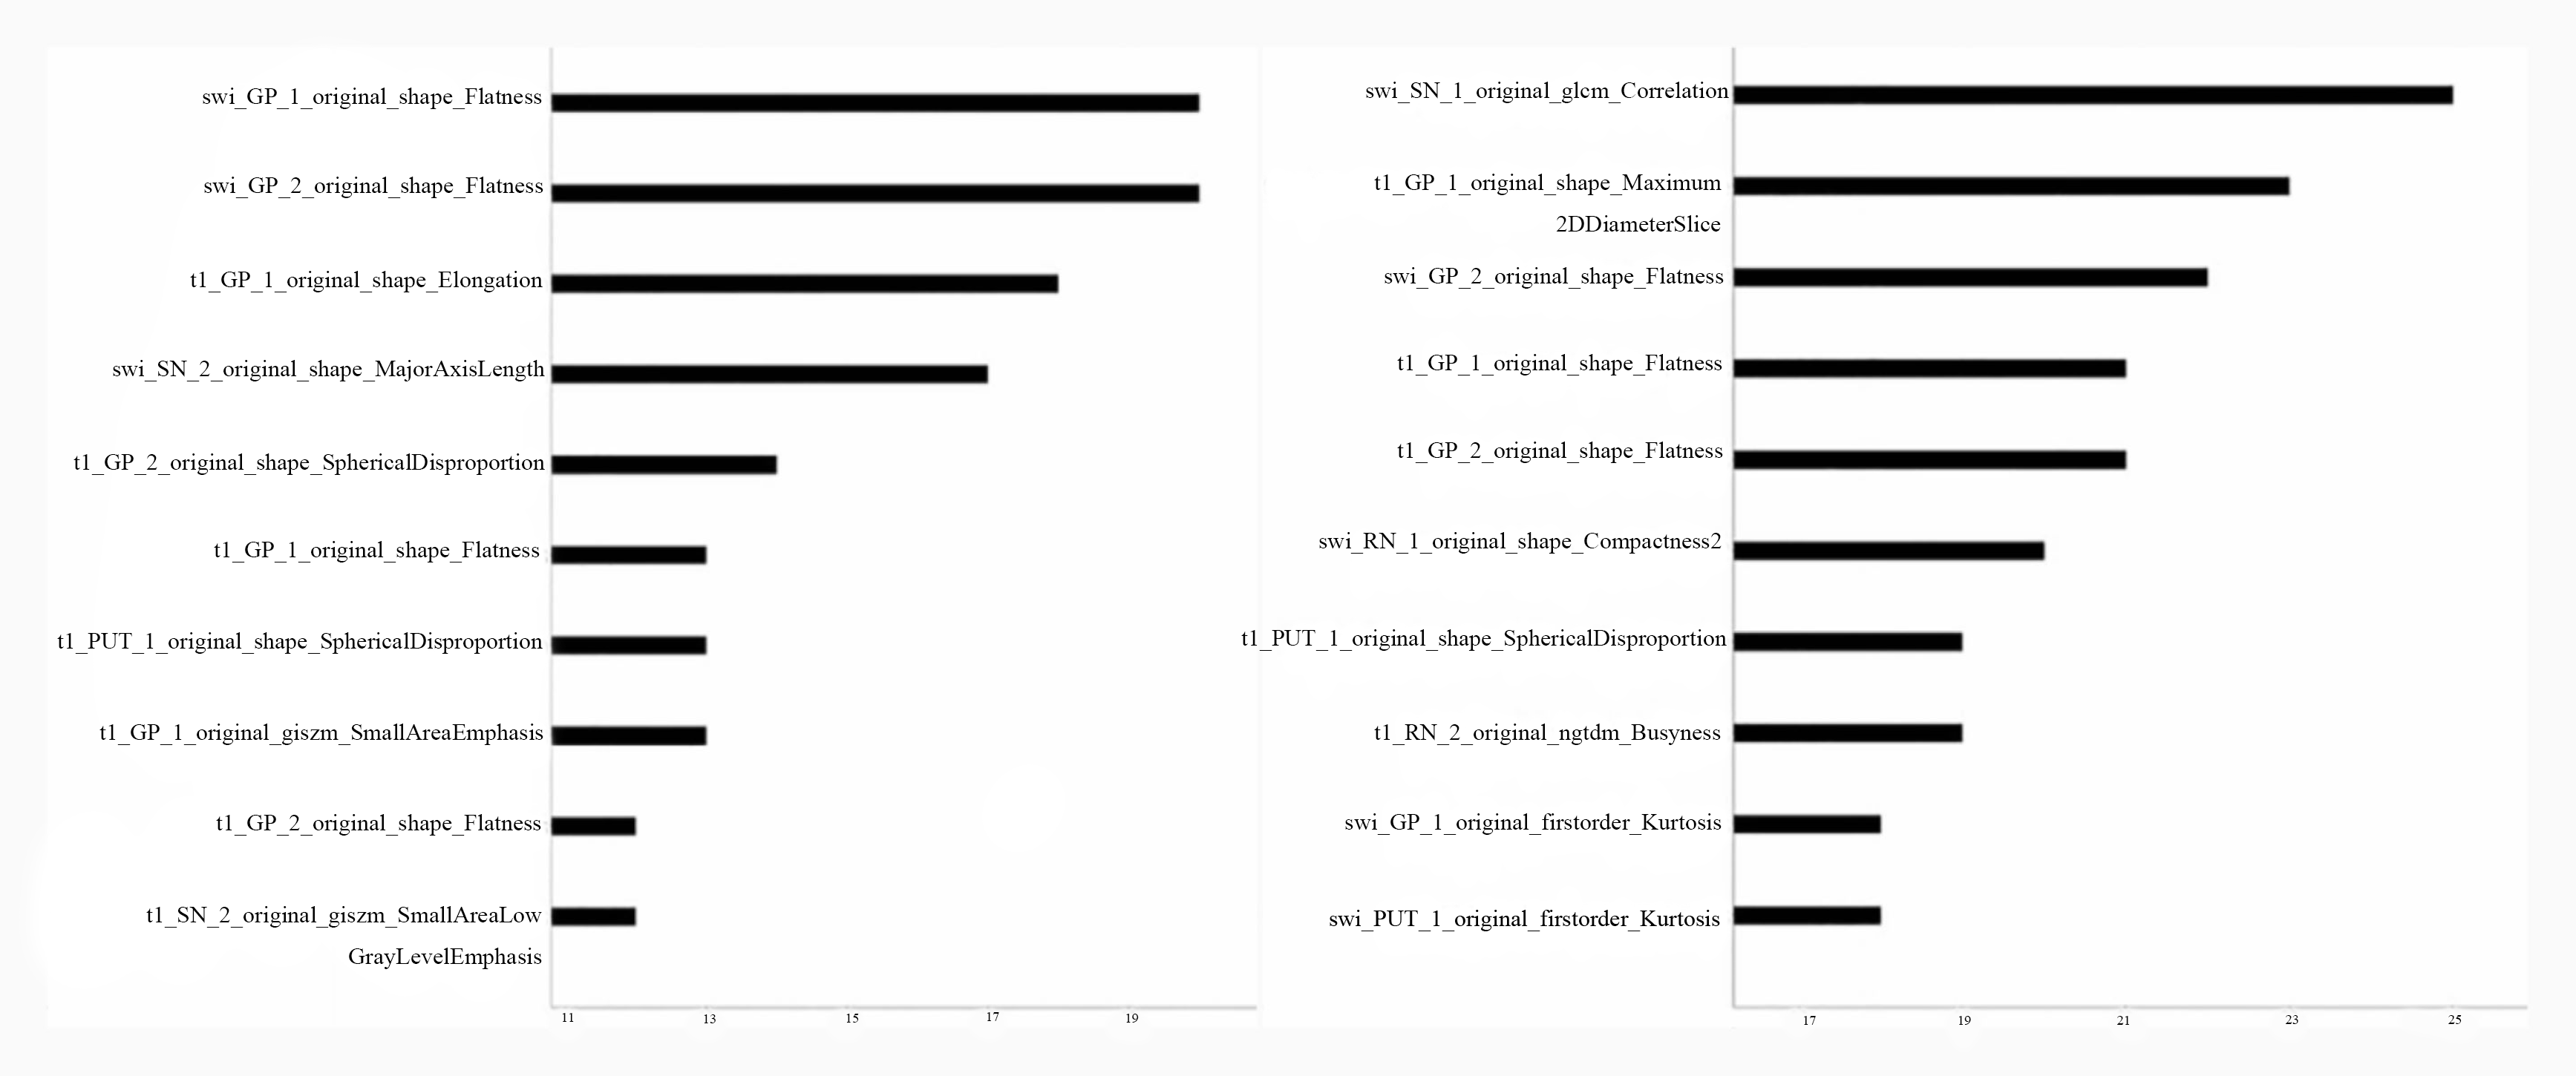
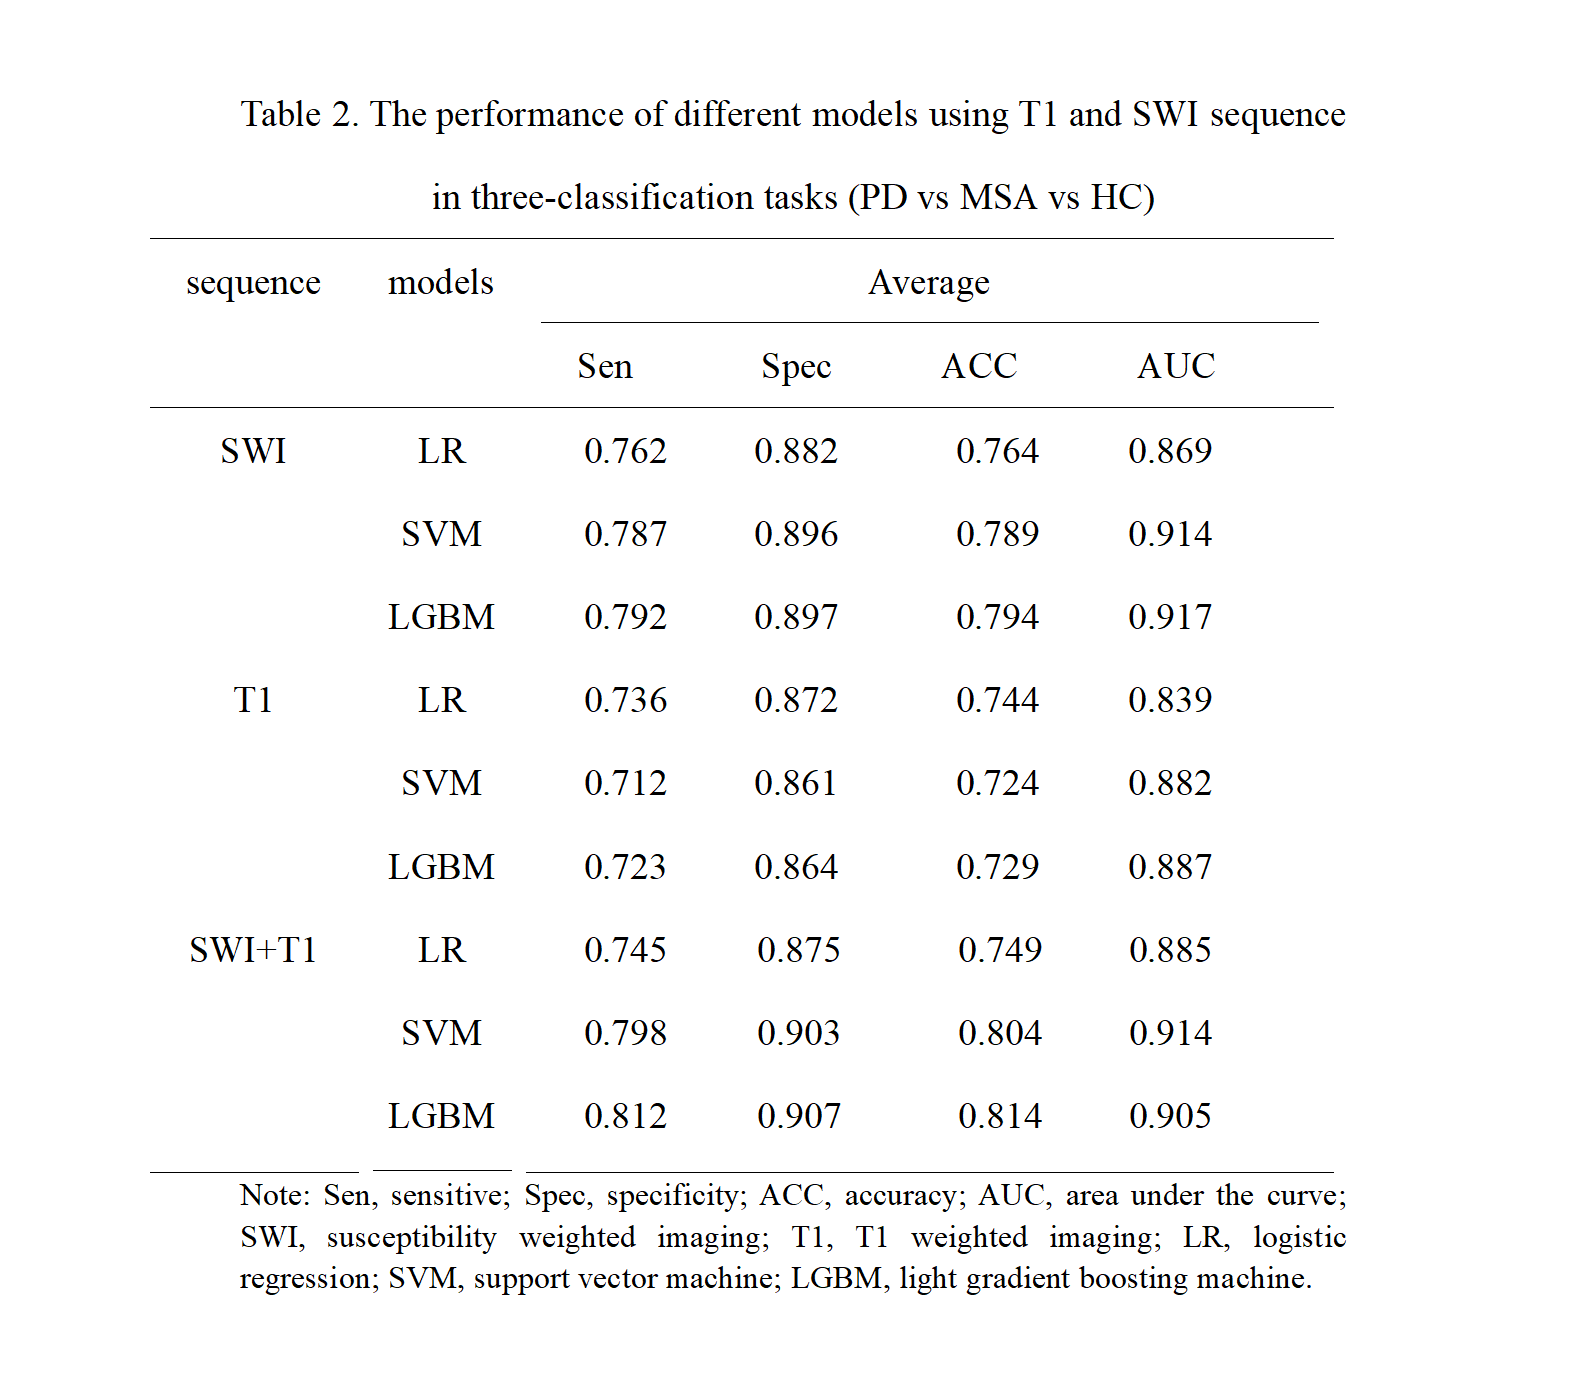
The LGBM model trained by the features combination of T1WI and SWI exhibited the most outstanding differential performance in both the three-class classification task of MSA vs. PD vs. HC and the binary classification task of MSA vs. PD, with an accuracy of 0.814 and 0.854, and an AUC of 0.904 and 0.881, respectively. The texture-based differences (GLCM) of the SN and the shape-based differences of the GP were highly effective in discriminating between the three classes and two classes, respectively.Discussion
Conventional MRI techniques, like T1WI and SWI, are primary screening and diagnosis in PD and MSA cases [1][3]. However, due to the imaging similarities between patients with these two conditions, even experienced radiologists may struggle to distinguish between them based solely on these images[4]. Early detection and precise diagnosis play a vital role in enhancing the quality of life for individuals affected by these neurodegenerative diseases [2]. This study has developed a radiomic analysis based on radiomic features extracted from conventional MR images, with the aim of precisely identifying patients with PD and MSA. Studies have suggested that combining multiple sequences, which comprehensively evaluate the underlying pathophysiology, can result in a better understanding of the disease and a more accurate prediction [5]. In our study, we employed three models to differentiate PD from MSA and HCs, namely LR, SVM, and LGBM. Although the performance of these models may be similar, LGBM appears to be the most reliable and outperformed the other two models. LGBM is a novel decision tree algorithm based on a gradient boosting decision tree, which consists of multiple decision trees. Each tree divides the data into two groups based on features. LGBM has been demonstrated to be a powerful and effective model due to its limited depth of the tree to find the optimal split gain node, which ensures efficiency and prevents overfitting [6]. Additionally, in the three-classification task, the SWI_GLCM correlation of SN was consistently selected in each fold, indicating its significance in differentiating PD from MSA and HCs. It is generally accepted that the degeneration and depiction of neurons in the SN is the most important reason behind PD symptoms [7]. Except for the three-classification task, the shape_flatness of GP emerges as the most valuable feature in all the other tasks, regardless of single or combination sequence. The shape features represent the volume, area, or shape of the GP. And previous studies have shown that the iron deposition of GP in MSA and PD [8].Conclusion
Radiomic features combining T1WI and SWI can achieve a satisfactory differential diagnosis for PD, MSA, and HC groups, as well as for PD and MSA groups, thus providing a useful tool for clinical decision-making based on routine MRI sequences.Acknowledgements
This work was conducted at the First hospital of China Medical University. The authors thank all the participants for attending this study.References
[1]Koga, S., Aoki, N., Uitti, R. J., et al. (2015). When DLB, PD, and PSP masquerade as MSA: an autopsy study of 134 patients. Neurology, 85(5), 404–412. https://doi.org/10.1212/WNL.0000000000001807
[2]Low, P. A., Reich, S. G., Jankovic, J., et al. (2015). Natural history of multiple system atrophy in the USA: a prospective cohort study. The Lancet. Neurology, 14(7), 710–719. https://doi.org/10.1016/S1474-4422(15)00058-7
[3]Barbagallo, G., Sierra-Peña, M., Nemmi, F., et al. (2016). Multimodal MRI assessment of nigro-striatal pathway in multiple system atrophy and Parkinson disease. Movement disorders : official journal of the Movement Disorder Society, 31(3), 325–334. https://doi.org/10.1002/mds.26471
[4]Heim B, Krismer F, De Marzi R, Seppi K. (2017). Magnetic resonance imaging for the diagnosis of Parkinson's disease. Journal of neural transmission (Vienna, Austria : 1996), 124(8), 915–964. https://doi.org/10.1007/s00702-017-1717-8
[5]Wei, J., Yang, G., Hao, X., et al. (2019). A multi-sequence and habitat-based MRI radiomics signature for preoperative prediction of MGMT promoter methylation in astrocytomas with prognostic implication. European radiology, 29(2), 877–888. https://doi.org/10.1007/s00330-018-5575-z
[6]Zhang, H., & Li, Y. (2021). LightGBM Indoor Positioning Method Based on Merged Wi-Fi and Image Fingerprints. Sensors (Basel, Switzerland), 21(11), 3662. https://doi.org/10.3390/s21113662
[7]Kalia, L. V., & Lang, A. E. (2015). Parkinson's disease. Lancet (London, England), 386(9996), 896–912. https://doi.org/10.1016/S0140-6736(14)61393-3
[8]Lee, J. H., Han, Y. H., Kang, B. M., et al. (2013). Quantitative assessment of subcortical atrophy and iron content in progressive supranuclear palsy and parkinsonian variant of multiple system atrophy. Journal of neurology, 260(8), 2094–2101. https://doi.org/10.1007/s00415-013-6951-x
Figures