0309
Characterizing iron deposits in subcortical grey matter from in vivo gradient-echo data1Laboratory for Research in Neuroimaging, Department of Clinical Neuroscience, Lausanne University Hospital and University of Lausanne, Lausanne, Switzerland, 2Medical Physics, Department of Radiology, Faculty of Medicine, University of Freiburg, Freiburg, Germany, 3Department of Radiology, Lausanne University Hospital (CHUV) and University of Lausanne, Lausanne, Switzerland
Synopsis
Keywords: Gray Matter, Brain
Motivation: Transverse relaxation rate and magnetic susceptibility are MRI measures of iron concentration in subcortical grey matter. However, their relation to the microscopic distribution of iron deposits within the tissue remains elusive.
Goal(s): Our goal is to characterize the distribution of iron deposits in subcortical grey matter from in vivo gradient-echo data.
Approach: We characterize iron-rich deposits from the combination of transverse relaxation parameters of the magnitude and phase of gradient-echo data, under two limiting regimes.
Results: The estimates of iron distribution are consistent with ex vivo studies. Data suggest that an intermediate regime might be applicable in subcortical tissue.
Impact: The characterization of the microscopic distribution of iron deposits in subcortical grey matter, from in vivo gradient-echo data, brings the opportunity to study iron-related brain changes in neurodegenerative diseases with improved specificity.
Introduction
The MRI transverse relaxation rate and magnetic susceptibility are measures of bulk iron concentration within subcortical grey matter. However their relation to the spatial distribution of iron deposits within the tissue remains elusive. Recent experimental evidence of non-exponential decay of the magnitude of the gradient-echo signal1,2 is an opportunity to leverage an additional parameter to characterize the distribution of these deposits.The biophysics of transverse relaxation in the presence of magnetic material is understood under two limiting regimes. In the static dephasing regime (SDR), relaxation is driven by field inhomogeneities caused by the magnetic deposits. In the diffusion narrowing regime (DNR), water diffusion dominates relaxation. Experimental evidence exists in support of either regime as the mechanism that underlies transverse relaxation in subcortical grey matter3–5. Further investigation is therefore necessary to enable unambiguous characterization of the distribution of iron deposits within the tissue, achieved by employing the appropriate theoretical framework.
This study combines non-exponential decay of the signal magnitude with magnetic susceptibility estimates computed from the signal phase to characterize iron-rich deposits in subcortical grey matter and to identify the limiting regime that underlies transverse relaxation.
Theory
Decay of the signal magnitude was described using a model-free Padé approximation of the crossover from Gaussian behaviour at short echo times to exponential decay at long echo times2:$$S=exp \left[ -\frac{⟨Ω^2⟩T_E^2}{2\left( 1+\frac{⟨Ω^2⟩}{2R_{2,micro}^*}T_E \right)} \right] [1] $$
$$$⟨Ω^2⟩$$$is the mean square frequency deviation due to the field inhomogeneities induced by the magnetic deposits and $$$R_{2,micro}^*$$$ is the transverse relaxation rate at long echo times $$$T_E$$$.
Assuming deposits of spherical geometry, the parameter $$$⟨Ω^2⟩$$$ can be linked to the volume fraction $$$ \zeta $$$ and the magnetic susceptibility $$$\mathrm{\Delta\chi}$$$ (SI units) of the iron-rich deposits:
$$⟨Ω^2⟩≈\frac{4}{45} \zeta⋅(\gamma B_0 \Delta\chi)^2 [2]$$
The parameter $$$R_{2,micro}^*$$$ can be described, in the SDR6 and DNR7–9, as
$$R_{2,micro}^*=\lambda_{SDR} \zeta\gamma B_0 \Delta\chi, \lambda_{SDR}=\frac{2\pi}{9 \sqrt(3)} [3a]$$
$$R_{2,micro}^*=\lambda_{DNR} \zeta\gamma^2\ B_0^2 \mathrm{\Delta\chi}^2 \tau, \lambda_{DNR}=\frac{16}{75} [3b]$$
Where $$$\tau=\frac{r^2}{6D}$$$ is the time scale for water molecules to diffuse away from the deposits of radius $$$r$$$. The parameter $$$\alpha=\delta\omega\tau=\ \frac{1}{3} \gamma B_0\ \mathrm{\Delta\chi} \tau $$$ represents the dephasing due to the field inhomogeneities during $$$\tau$$$. A value of $$$\alpha\gg 1$$$ or $$$\alpha\ll 1$$$ is is a requirement of the SDR or DNR regimes, respectively10.
Additionally, the MRI measure of magnetic susceptibility can be written as5:
$$\chi_{MRI}=\zeta\Delta\chi [4]$$
Methods
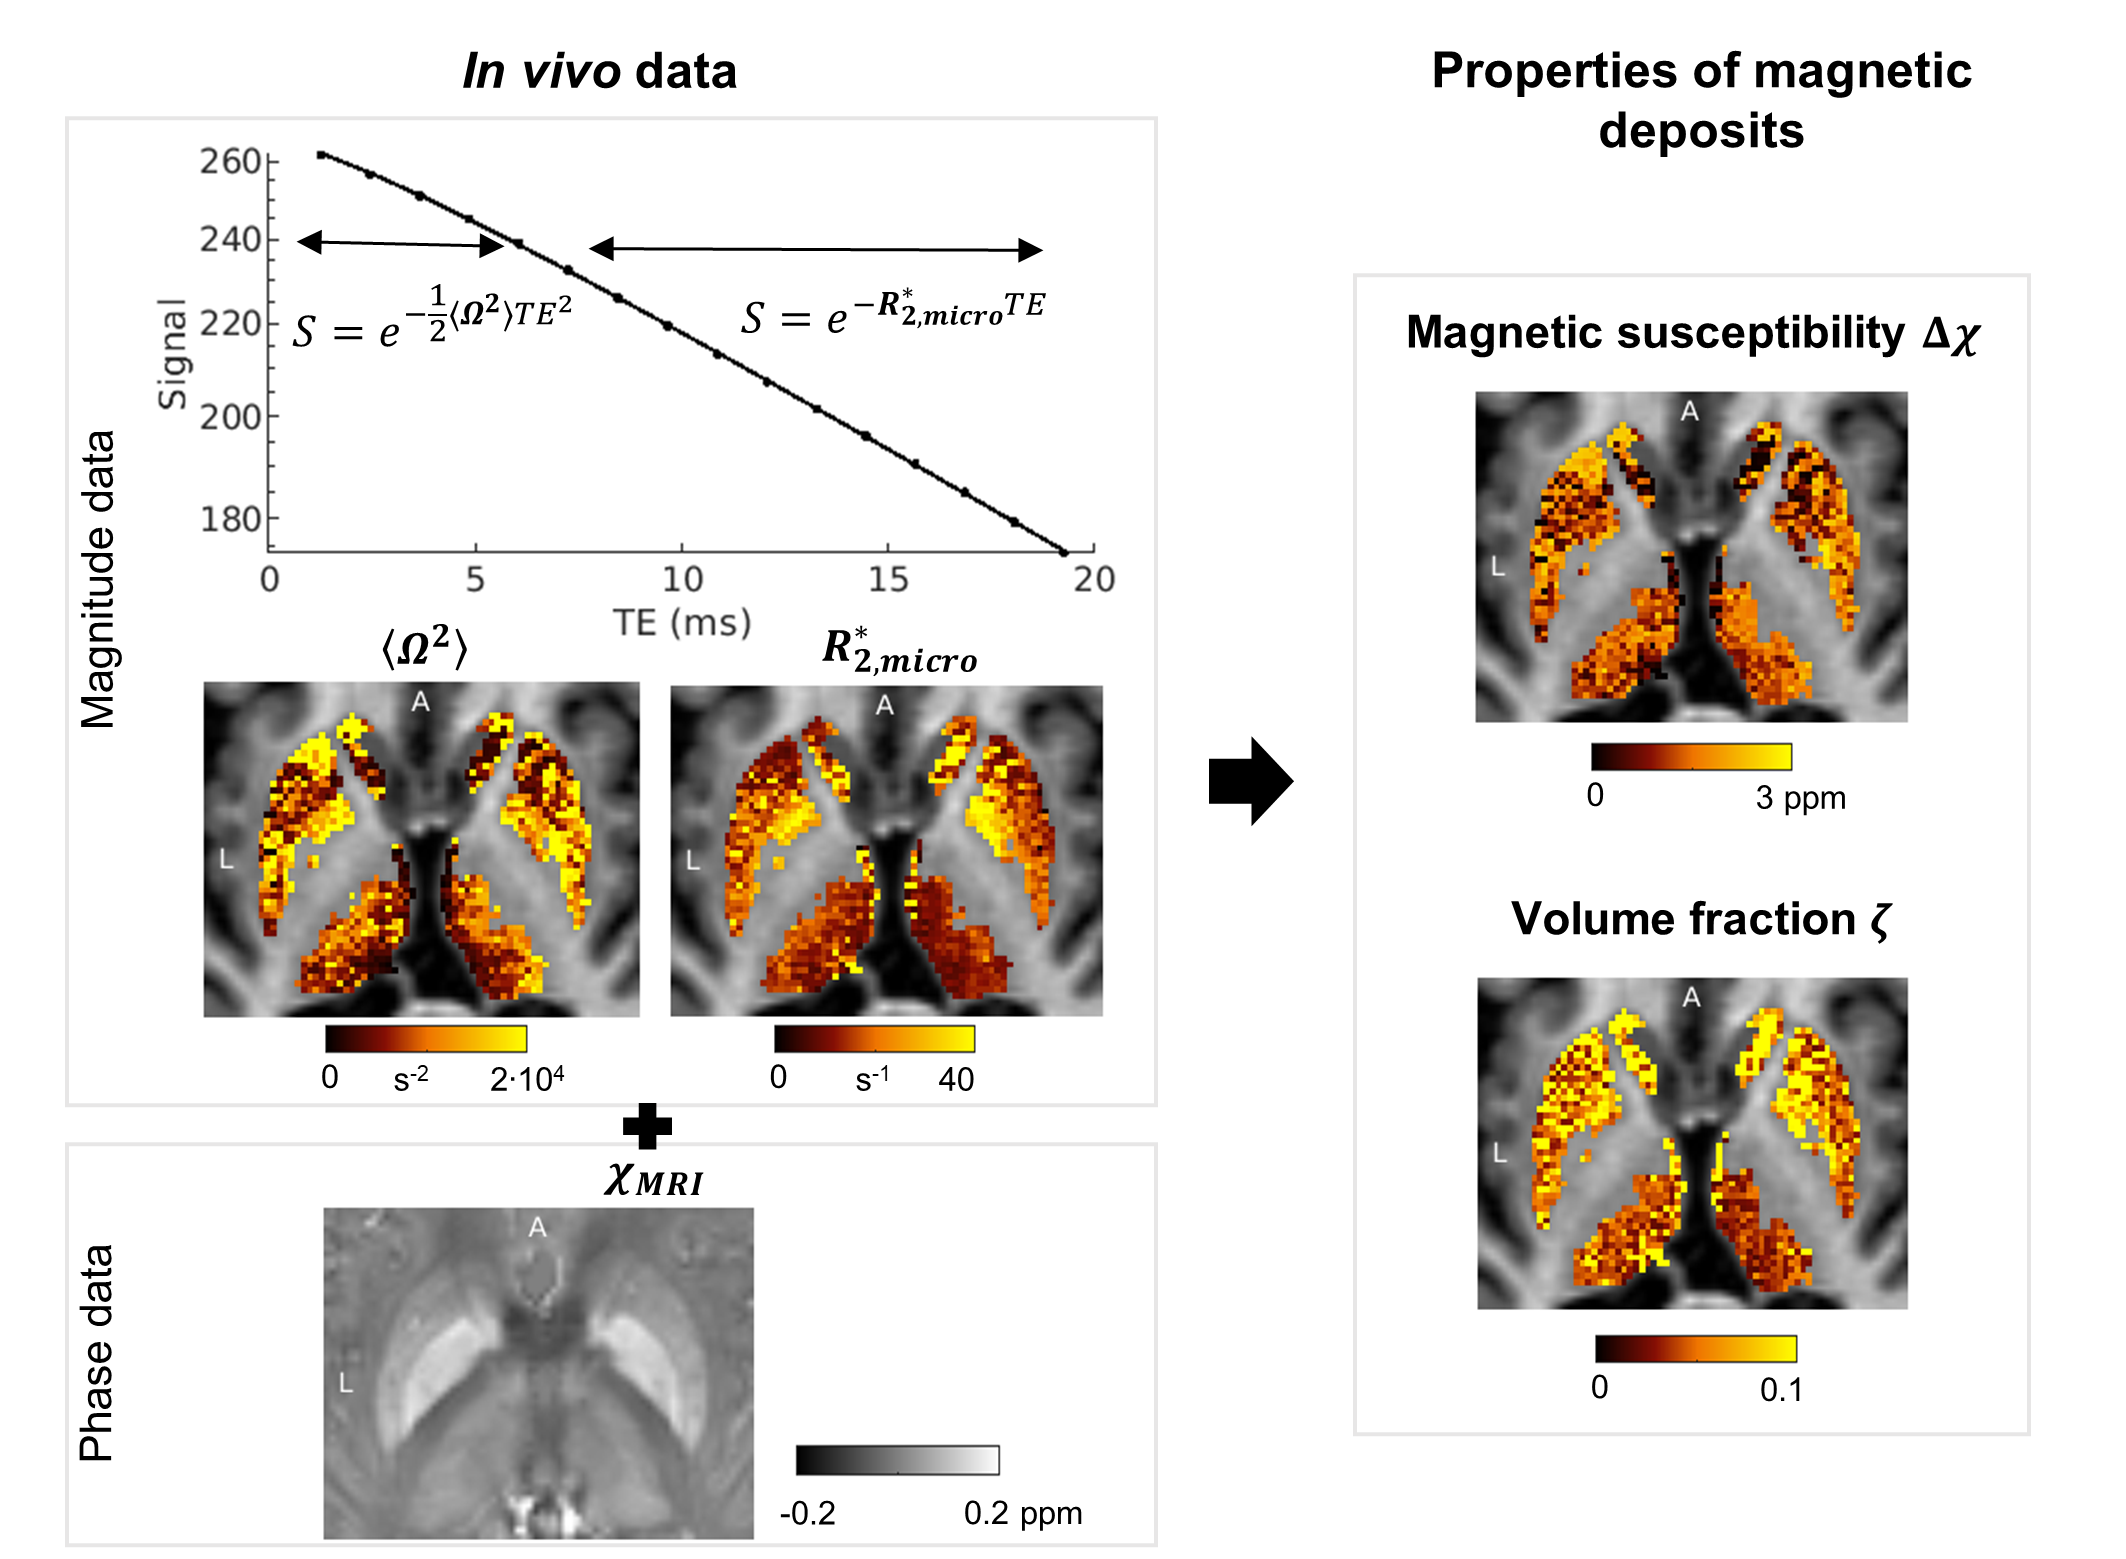
Two male subjects (29 and 43 years old) were scanned in a 3T Prisma Siemens MRI scanner. A total of 16 gradient-echo images (1.2 mm isotropic resolution) were collected with a custom-made 3D FLASH sequence, with bipolar readouts and echo times ranging from 1.25 to 19.25 ms. Computation of $$$\chi_{MRI}$$$ involved background field removal with the PDF algorithm11 and dipole inversion with STAR-QSM12. The MRI parameters $$$⟨Ω^2⟩$$$ and $$$R_{2,micro}^*$$$ were estimated from the fitting of the signal magnitude with Eq. 1 using bespoke analysis scripts written in Matlab. From the estimates of $$$⟨Ω^2⟩$$$, $$$R_{2,micro}^*$$$ and $$$\chi_{MRI}$$$, we used Eqs. 2-4 to estimate the volume fraction ($$$\zeta$$$) and magnetic susceptibility ($$$\Delta\chi$$$) of the iron-rich deposits (Fig. 1).Results
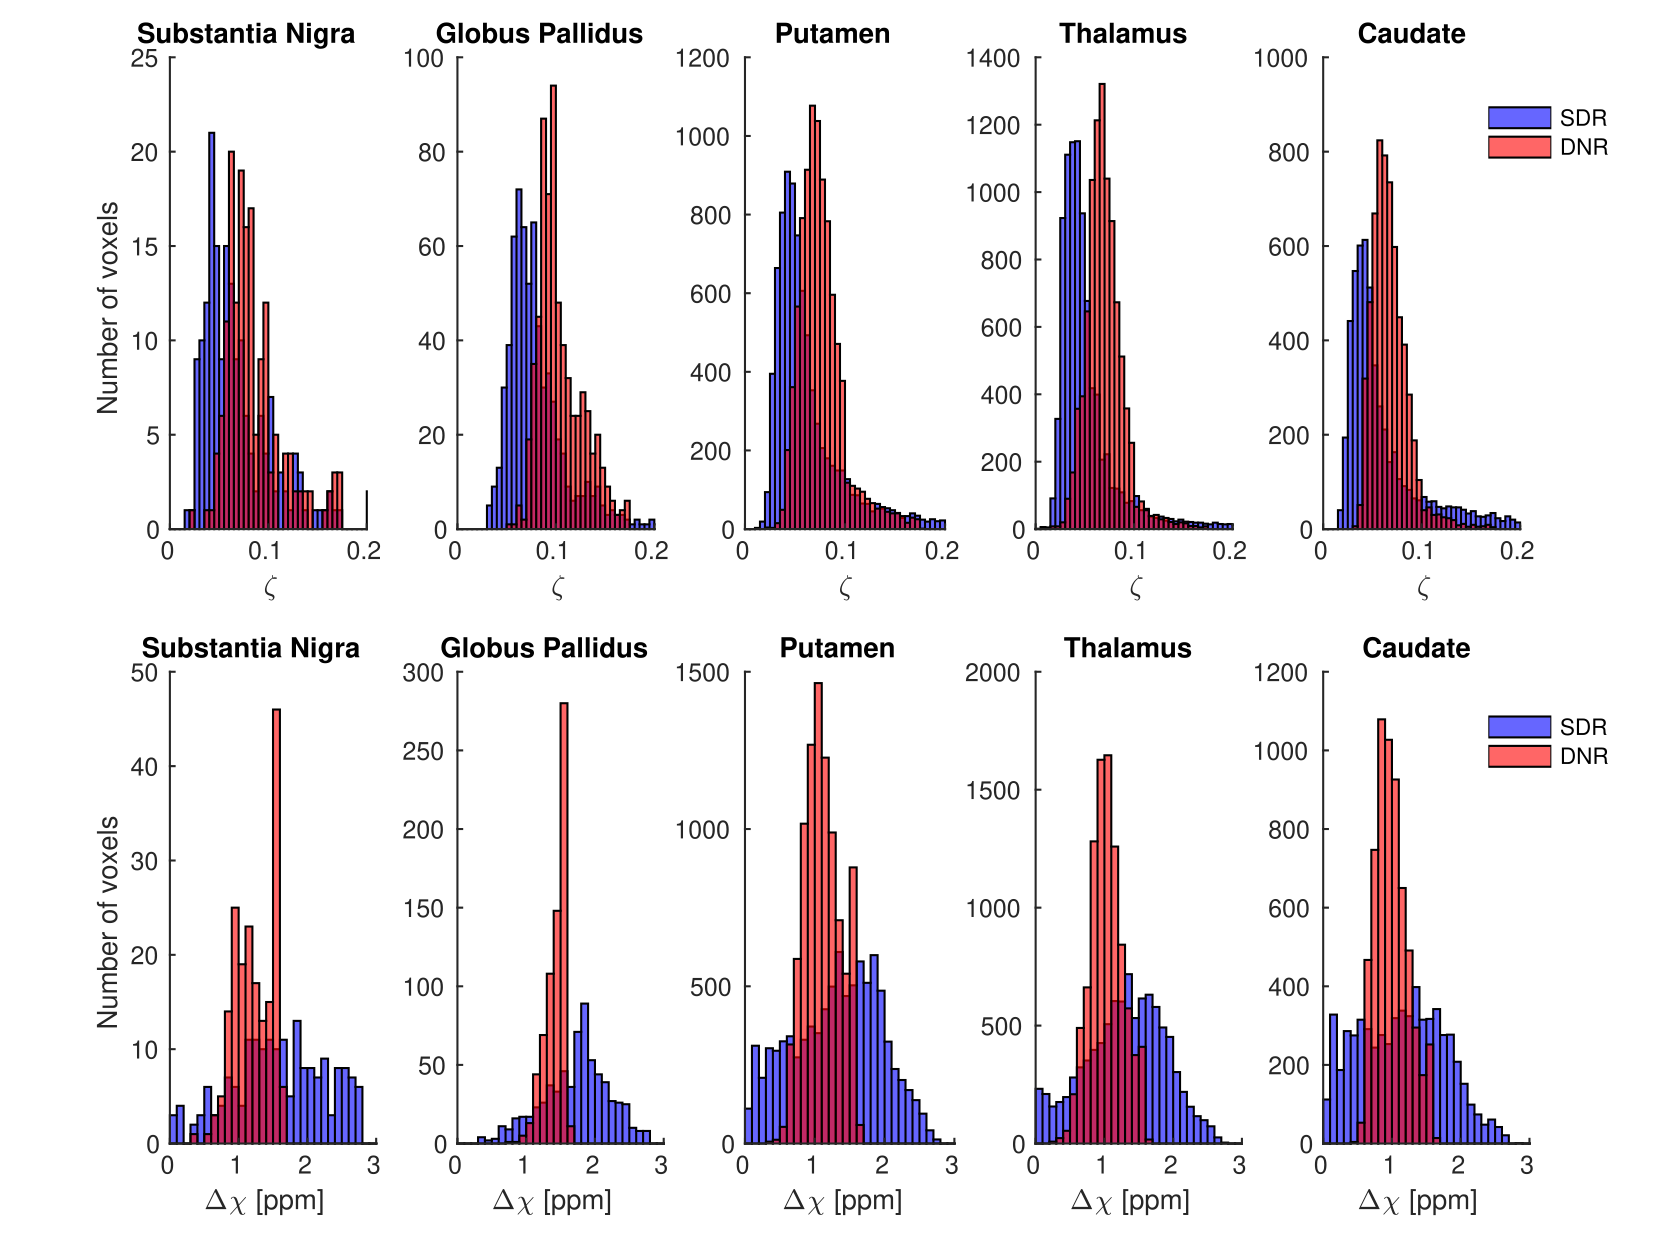
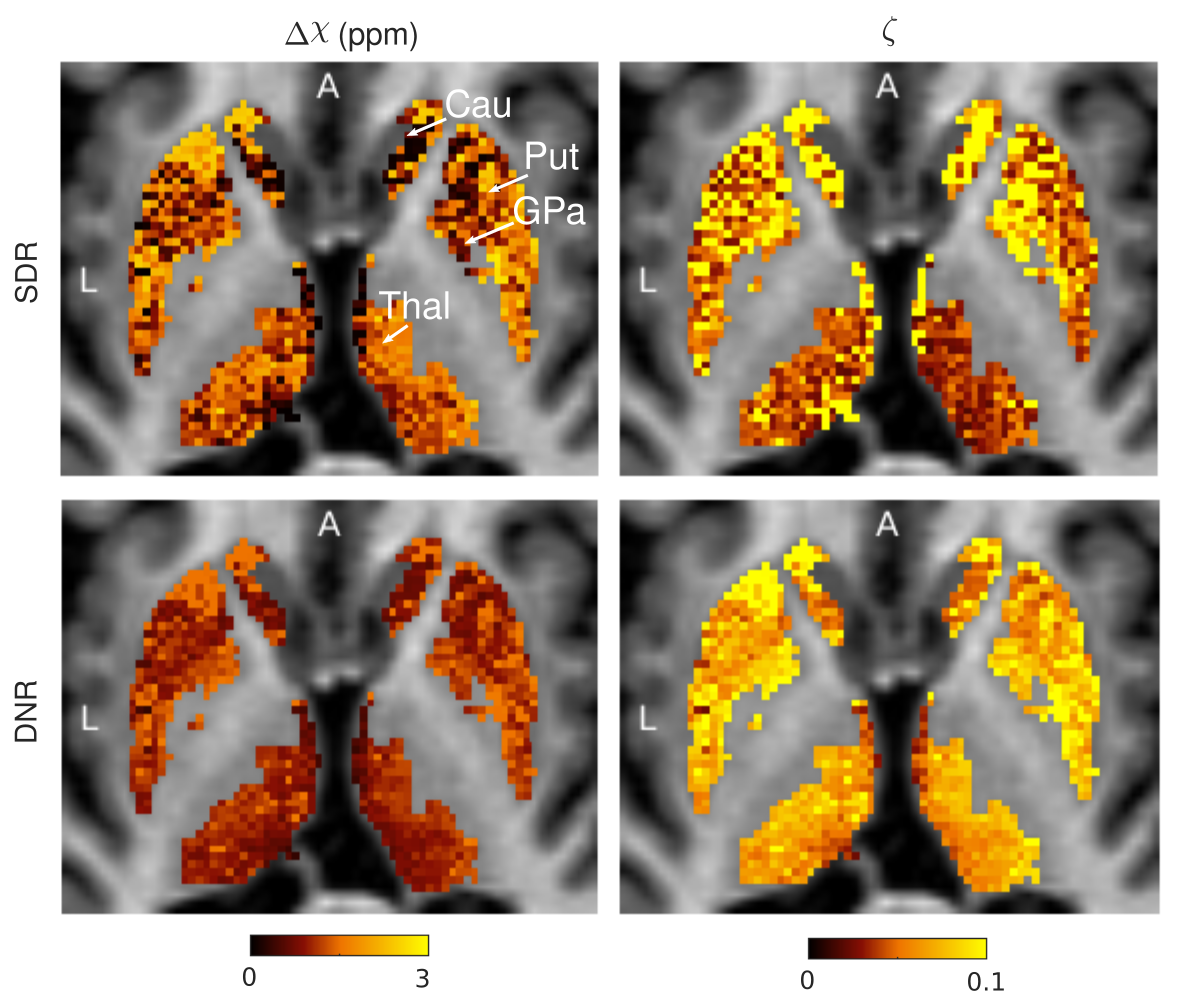
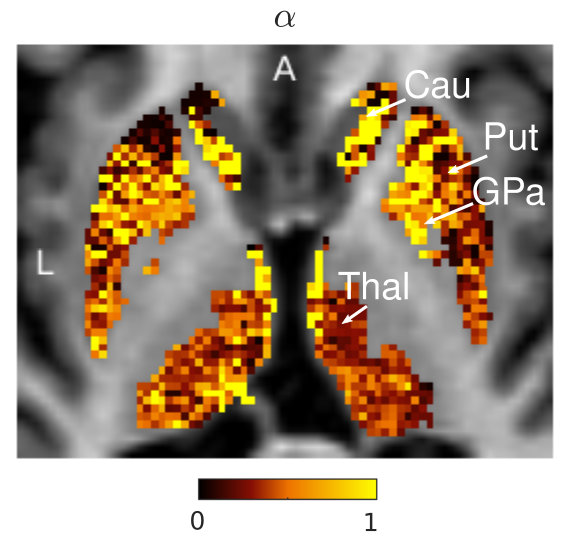
Under the DNR, estimates of $$$\zeta$$$ are 40% higher than under the SDR. Conversely, estimates of $$$\Delta\chi$$$ are 20% lower (Fig. 2). Nevertheless under both regimes, the values of $$$\Delta\chi$$$ and $$$\zeta$$$ are in good agreement with the magnetic susceptibility and volume fractions of iron-rich neuromelanin aggregates in the substantia nigra4. Under the assumption that ferritin is the only magnetic material within the tissue, a value of $$$\Delta\chi$$$ of ~1ppm indicates iron concentrations of ~0.8 mg/g within the deposits, consistent with intracellular iron levels observed ex vivo13. The smooth spatial distribution of the $$$\Delta\chi$$$ and $$$\zeta $$$ maps in the DNR arises from the maps of $$$\chi_{MRI} $$$ (Fig. 3). The $$$\alpha$$$ values exhibit an average of ~0.4 (Fig. 4), which is inconsistent with the assumptions of the DNR and SDR.Discussion
The estimates of the volume fraction $$$\zeta$$$ and magnetic susceptibility $$$\Delta\chi$$$ of iron deposits are consistent with histological studies of iron distribution within brain tissue and confirm the predominant effect of iron-rich cells in both the limiting cases of DNR and SDR. However, the distribution of the values of $$$\alpha$$$ (~1) is inconsistent with the assumptions of the DNR or SDR, suggesting an intermediate regime.Conclusions
We combined parameters of transverse relaxation obtained from the magnitude and phase of in vivo gradient-echo data to characterize the distribution of iron deposits within subcortical grey matter. The estimates are consistent with intracellular iron levels observed ex vivo. Additionally, our results suggest that an intermediate regime may be applicable for iron-induced transverse relaxation in subcortical grey matter.Acknowledgements
No acknowledgement found.References
1. Oliveira R, Raynaud Q, Kiselev V, Jelescu I, Lutti A. Non-exponential transverse relaxation in the brain’s basal ganglia. 32nd Annu Meet Int Soc Magn Reson Med Toronto, Canada. 2023;168(2018):2598.
2. Oliveira R, Raynaud Q, Kiselev V, Jelescu I, Lutti A. Non-exponential transverse relaxation decay in subcortical grey matter. bioRxiv [Preprint]. 2023.
3. Sedlacik J, Boelmans K, Löbel U, Holst B, Siemonsen S, Fiehler J. Reversible, irreversible and effective transverse relaxation rates in normal aging brain at 3T. Neuroimage. 2014;84:1032-1041. doi:10.1016/j.neuroimage.2013.08.051
4. Brammerloh M, Morawski M, Friedrich I, et al. Measuring the iron content of dopaminergic neurons in substantia nigra with MRI relaxometry. Neuroimage. 2021;239(June). doi:10.1016/j.neuroimage.2021.118255
5. Yablonskiy DA, Wen J, Kothapalli SVVN, Sukstanskii AL. In vivo evaluation of heme and non-heme iron content and neuronal density in human basal ganglia. Neuroimage. 2021;235(April):118012. doi:10.1016/j.neuroimage.2021.118012
6. Yablonskiy DA, Haacke EM. Theory of NMR signal behavior in magnetically inhomogeneous tissues: The static dephasing regime. Magn Reson Med. 1994;32(6):749-763. doi:10.1002/mrm.1910320610
7. Jensen JH, Chandra R. NMR relaxation in tissues with weak magnetic inhomogeneities. Magn Reson Med. 2000;44(1):144-156. doi:10.1002/1522-2594(200007)44:1<144::AID-MRM21>3.0.CO;2-O
8. Sukstanskii AL, Yablonskiy DA. Gaussian approximation in the theory of MR signal formation in the presence of structure-specific magnetic field inhomogeneities. J Magn Reson. 2003;163(2):236-247. doi:10.1016/S1090-7807(03)00131-9
9. Kiselev VG, Novikov DS. Transverse NMR Relaxation as a Probe of Mesoscopic Structure. Phys Rev Lett. 2002;89(27):2-5. doi:10.1103/PhysRevLett.89.278101
10. Kiselev VG, Novikov DS. Transverse NMR relaxation in biological tissues. Neuroimage. 2018;182(June):149-168. doi:10.1016/j.neuroimage.2018.06.002
11. Liu T, Khalidov I, de Rochefort L, et al. A novel background field removal method for MRI using projection onto dipole fields (PDF). NMR Biomed. 2011;24(9):1129-1136. doi:10.1002/nbm.1670
12. Wei H, Dibb R, Zhou Y, et al. Streaking artifact reduction for quantitative susceptibility mapping of sources with large dynamic range. NMR Biomed. 2015;28(10):1294-1303. doi:10.1002/nbm.3383
13. Friedrich I, Reimann K, Jankuhn S, et al. Cell specific quantitative iron mapping on brain slices by immuno-µPIXE in healthy elderly and Parkinson’s disease. Acta Neuropathol Commun. 2021;9(1):1-17. doi:10.1186/s40478-021-01145-2
Figures