0308
Brain iron accumulation kinetics in Parkinson’s disease revealed by relaxometry network and susceptibility-weighted imaging1Xuanwu Hospital, Capital Medical University, Beijing, China, 2Xuanwu Hospital Capital Medical University, Beijing, China
Synopsis
Keywords: Parkinson's Disease, Parkinson's Disease, susceptibility-weighted imaging; kinetics; iron accumulation; relaxometry covariance network; substantia nigra
Motivation: Iron deposition is implicated in the pathogenesis of Parkinson's disease (PD). However, most of the previous studies failed to report progressive iron accumulation with disease progression.
Goal(s): This study aimed to explore the kinetics of iron accumulation in the PD brain using a novel relaxometry covariance network (RCN) approach.
Approach: The RCN approach consisted of three steps, the identification of brain regions as propagators of iron, construction of causal RCN and individual differential RCN.
Results: The left substantia nigra pars reticulata, left substantia nigra pars compacta, and lobule VII of cerebellum vermis were identified as propagators of iron.
Impact: The application of our novel relaxometry covariance network on susceptibility-weighted imaging revealed iron accumulation kinetics in Parkinson's disease, which were closely related to the pathophysiological aspects of the disease. The current findings deserved further exploration to elucidate the underlying mechanisms.
Introduction
Iron deposition is implicated in the pathogenesis of Parkinson's disease (PD) 1. Via iron-sensitive magnetic resonance imaging (MRI) technique such as susceptibility-weighted imaging (SWI), researchers have revealed increased iron deposition in the substantia nigra (SN), red nucleus, frontal, posterior parietal and insular cortices, and decreased iron levels in the occipital lobes in patients with PD 2-6. However, most of the previous studies failed to report progressive iron accumulation across the brain with disease progression 3-6. In this study, it was hypothesized that PD was associated with progressive iron accumulation as the disease progressed. A novel relaxometry covariance network (RCN) approach was used to identify the kinetics of iron accumulation between brain regions.Methods
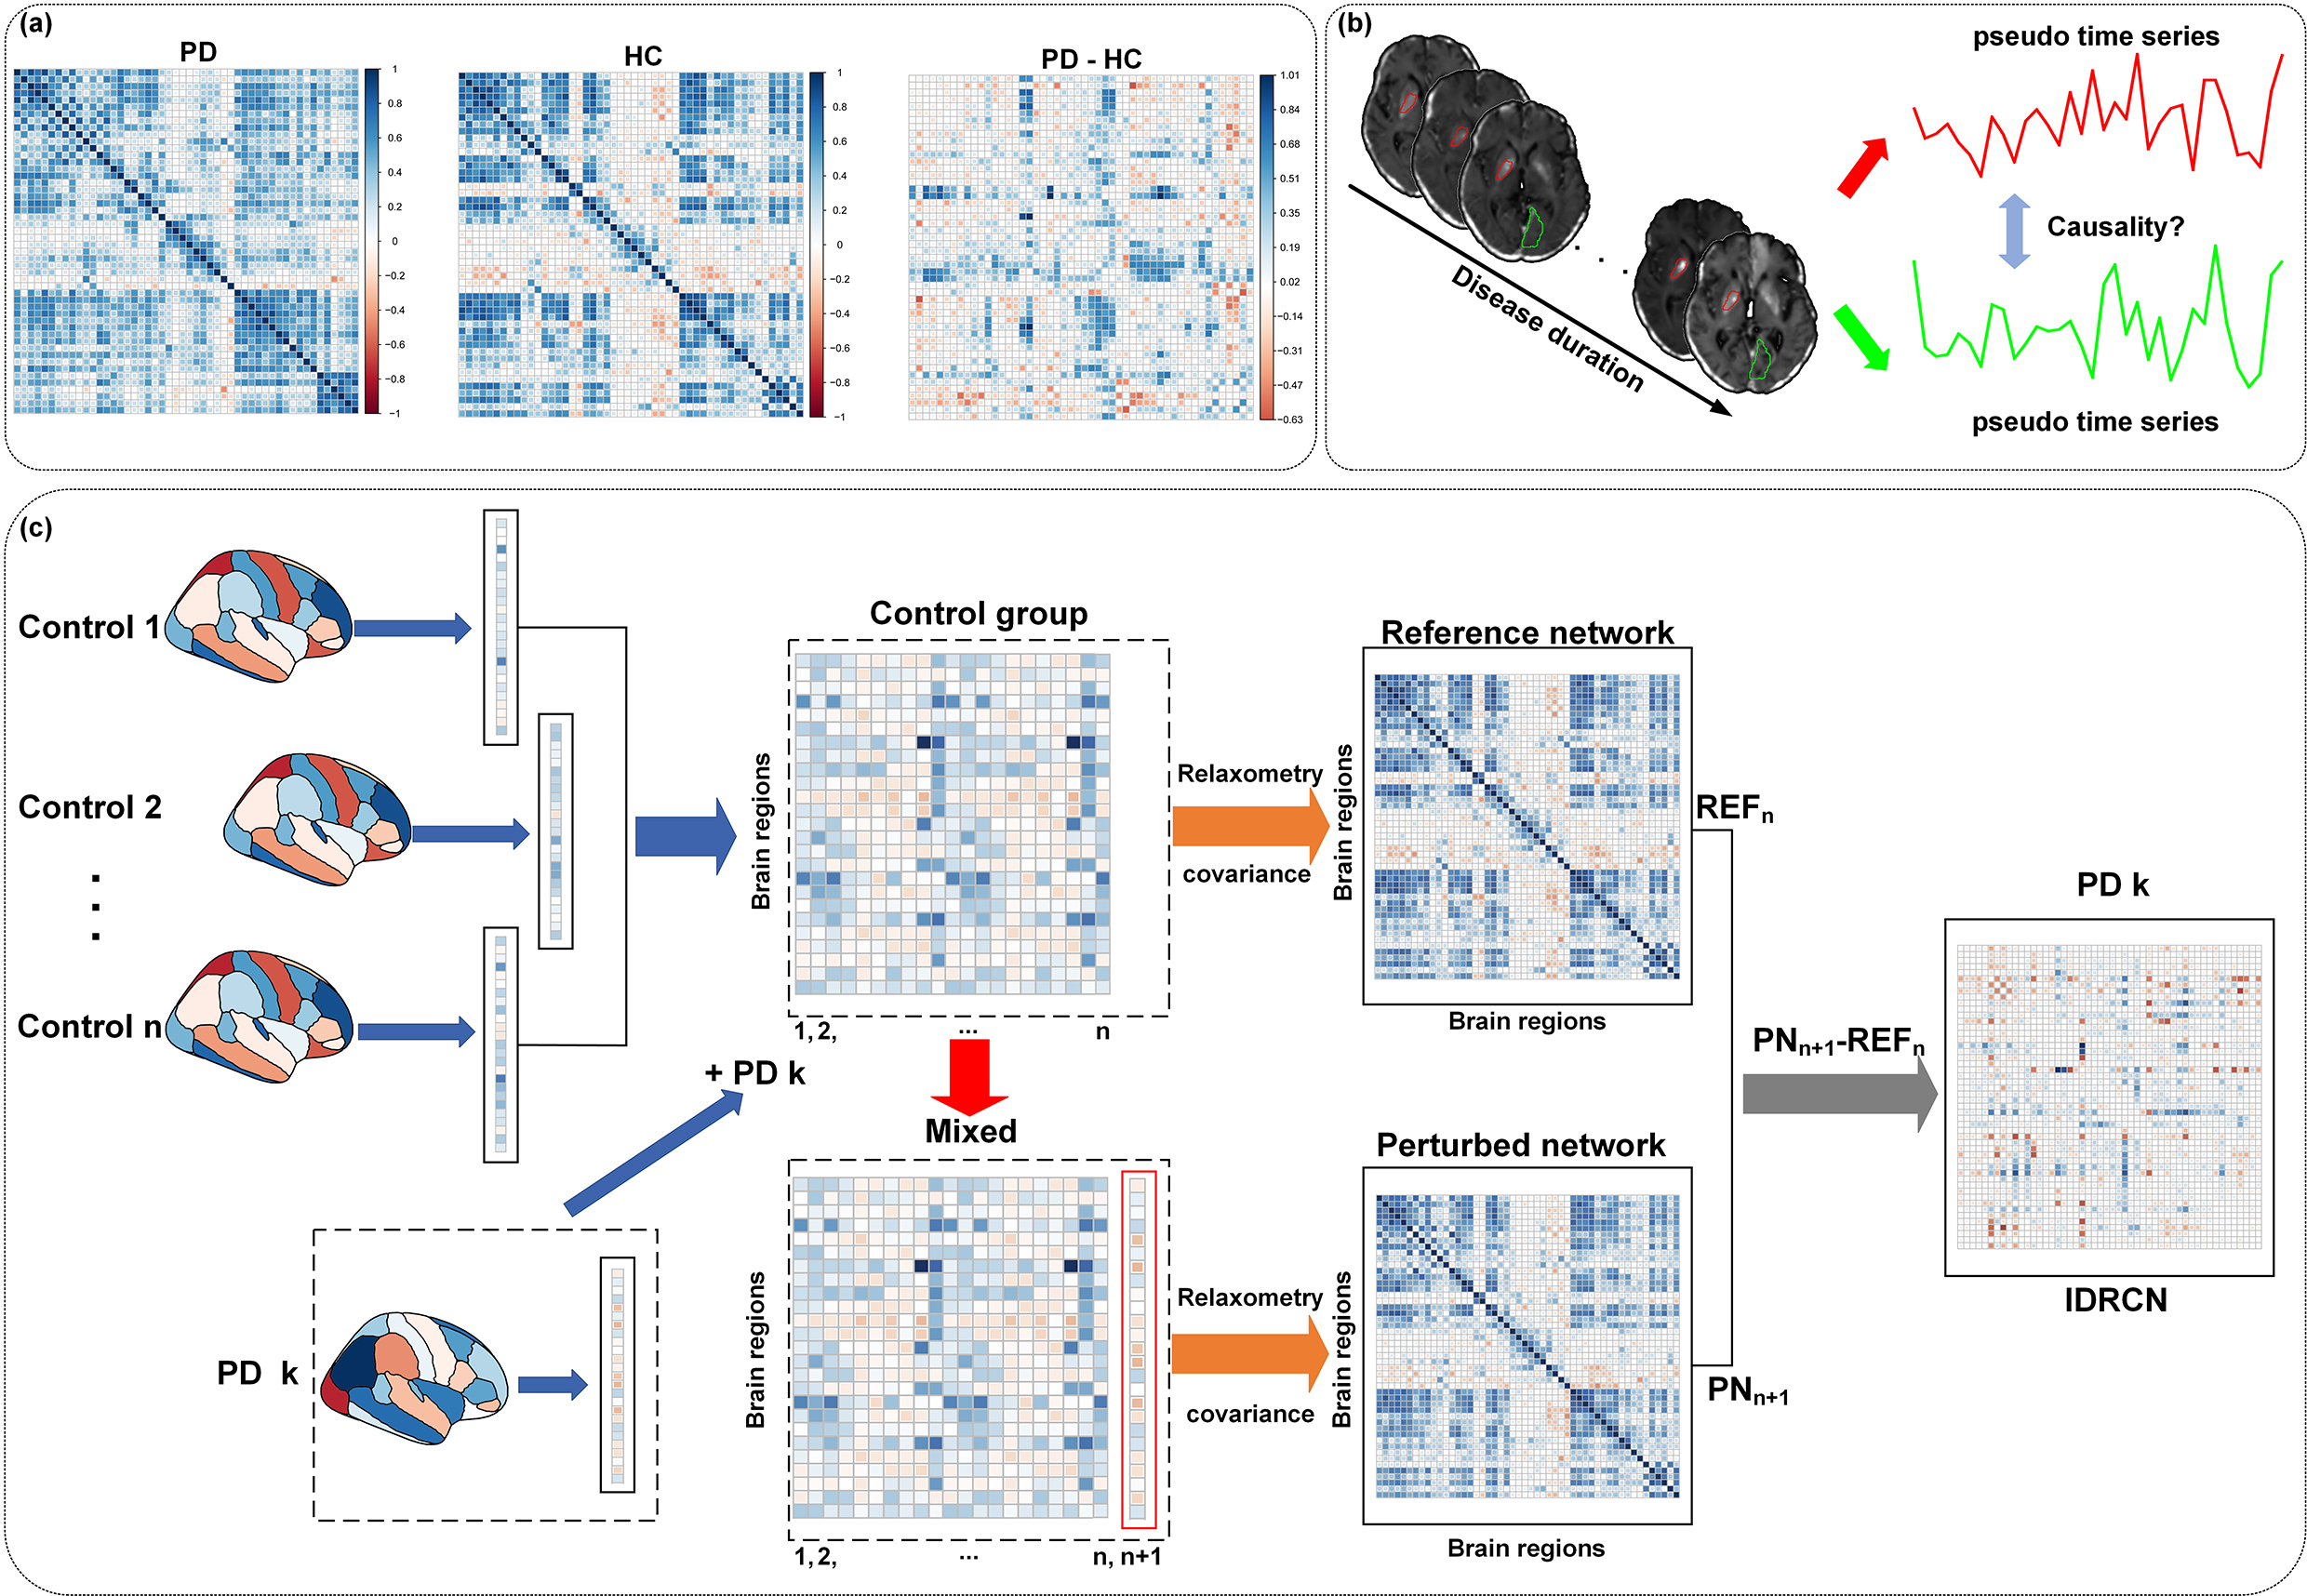
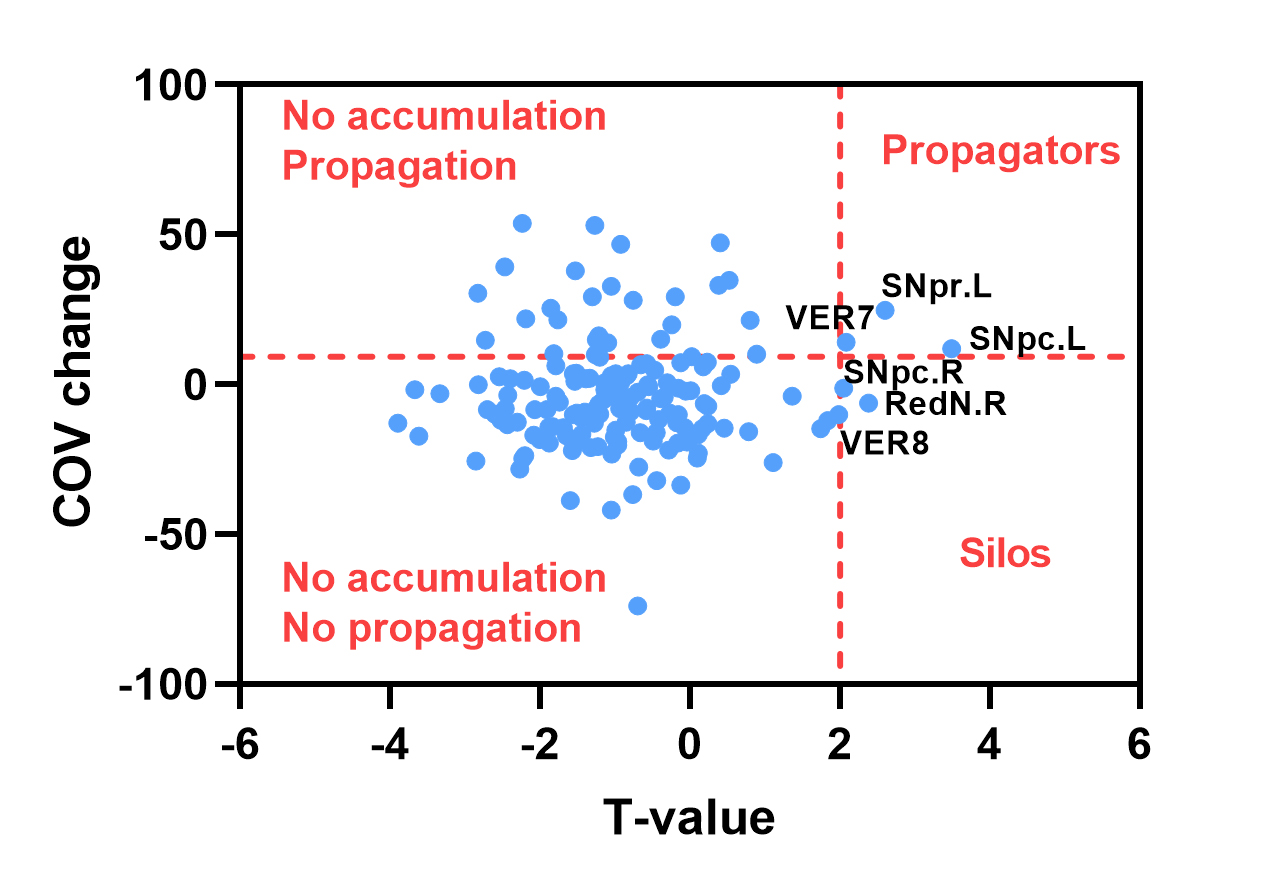
PD patients and age- and sex-matched healthy controls (HCs) underwent SWI-MRI scan. Voxel-wise R2* maps were calculated from the SWI data. We then constructed group-level RCNs for the two groups based on the R2* values using the covariance network approach (Figure 1a). We subtracted the RCN matrix of HC from that of PD group, and obtained the subtraction matrix (PD - HC). We summed the per column of the subtraction matrix to estimate for each brain region, the covariance difference with respect to the rest of the brain in iron accumulation. Propagator was defined when the certain brain region (1) had a significant increase in iron accumulation in PD patients with respect to HCs, and (2) had a high covariance change. We treated the propagators as region of interests (ROIs). The R2* maps of all patients with PD were sequenced according to disease duration from short to long to form a pseudo-time series of R2* maps from all patients with PD. To further investigate the iron propagation directions from the ROIs to the rest of the brain, we conducted ROI-wise causal relaxometry covariance network analysis using signed-path Granger causality method. To explore the association between iron propagation pathways from the propagators and clinical information of PD, we constructed individual differential RCN network for each PD patient using a recently-proposed approach (as demonstrated in Figure 1c) 7. Pearson’s correlation analysis was performed between Z-score values of edges with significant causal effect and clinical variables in PD group. Additionally, Pearson’s correlation analysis was also performed between mean R2* values of nodes which received significant causal projections from the propagators and clinical variables. P > 0.05 was considered statistically significant.Results
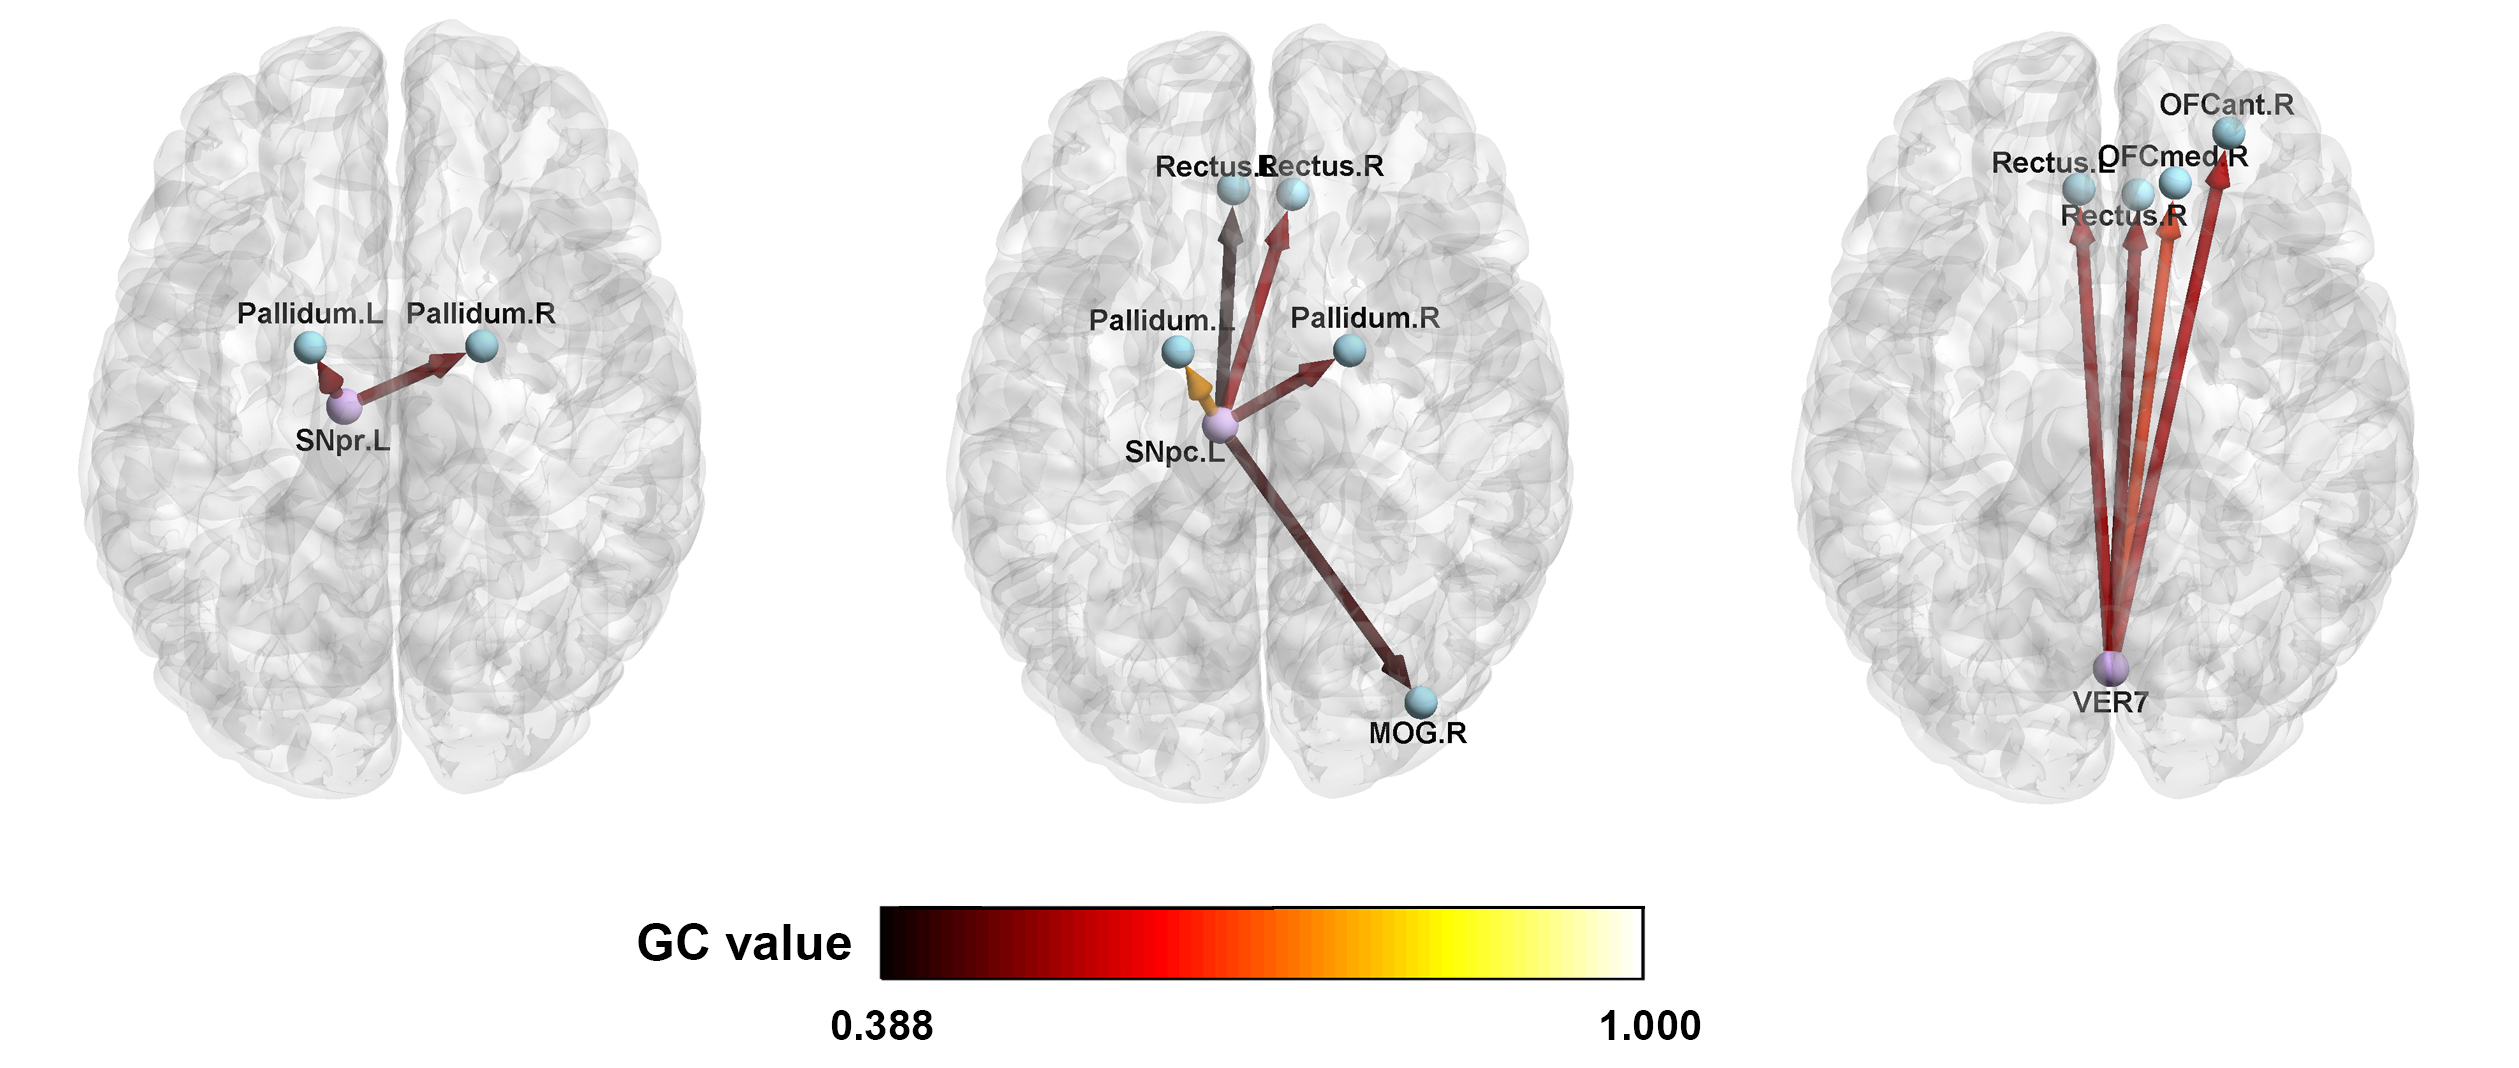
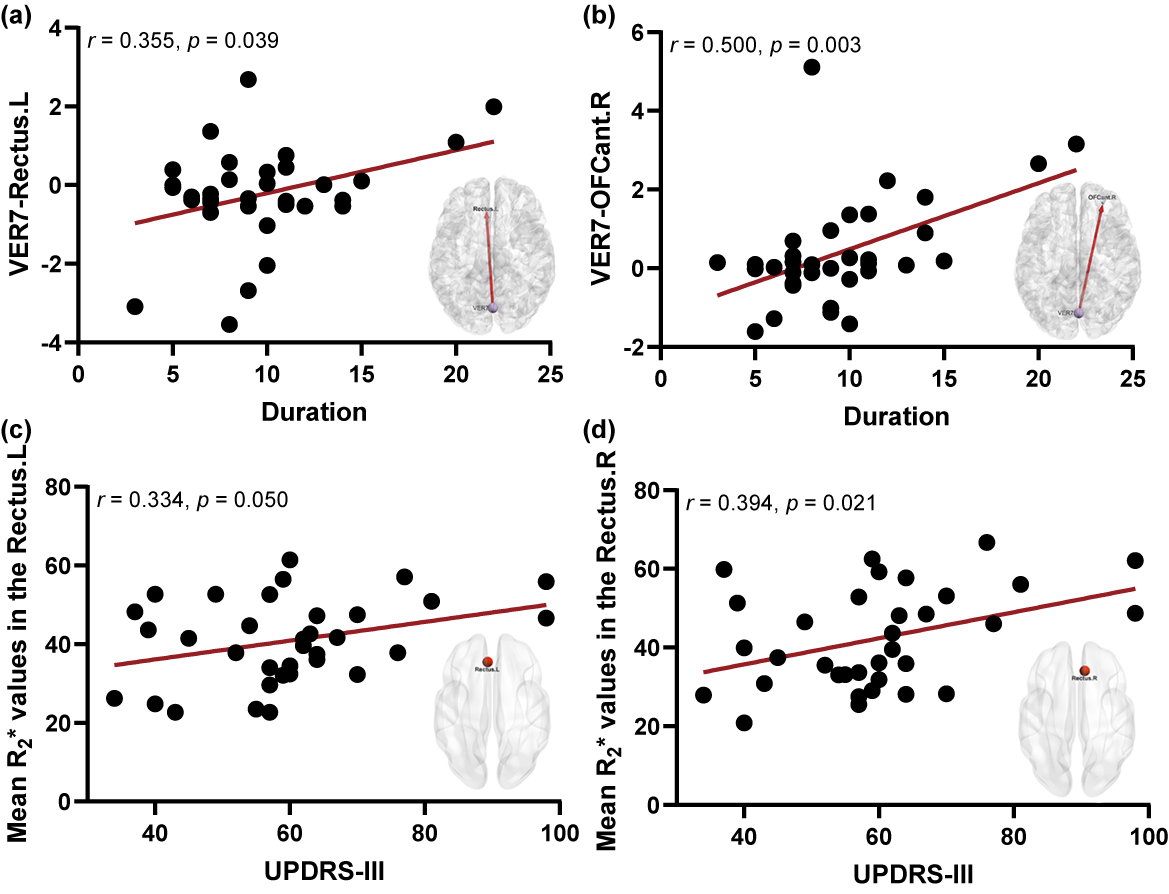
There were 25 HCs and 34 patients with PD in this study. In PD group, the left SN pars reticulata (SNpr), left SN pars compacta (SNpc), and lobule VII of cerebellum vermis 7 (VER7) were identified as propagators of iron (Figure 2). The left SNpr exhibited causal effects of irons on the bilateral pallidum, the left SNpc showed significant causal projections of irons to the bilateral pallidum, gyrus rectus and middle frontal gyrus, while the VER7 demonstrated causal projections of irons to the gyrus rectus and orbitofrontal cortex (OFC) (p < 0.05) (Figure 3). Disease duration was positively correlated with the connection between the VER7 and left gyrus rectus (r = 0.355, p = 0.039), as well as the connection between the VER7 and right anterior OFC (r = 0.500, p = 0.003). In addition, Unified Parkinson’s Disease Rating Scale-part III score was positively correlated with the mean R2* values in the left gyrus rectus (r = 0.333, p = 0.050) and right gyrus rectus (r = 0.394, p = 0.021) (Figure 4).Discussion
The SNpr and pallidum are both part of the motor circuit according to the parallel circuit model of the basal ganglia in PD 8. The gyrus rectus within the prefrontal cortex is the main projection target of midbrain dopaminergic neurons located in the SN 9. Previous findings have revealed that the cerebellar vermis and frontal cortex circuit are involved in the motor imagery and execution of postural balance in PD 10,11. In line with previous findings, the current significant projections from the SN to the pallidum and gyrus rectus, and from the cerebellum vermis to the frontal cortex may be related to the pathophysiological changes of PD. A recent study demonstrated the interaction between excessive iron deposition in the SN and visual network in the PD brain 12, which was consistent with the current findings of iron causal projections from the SNpc to the middle occipital gyrus.Conclusion
The current findings enhance our understanding of pathophysiology of PD, and suggest future research directions to further explore the underlying mechanisms of iron kinetics in patients with PD.Acknowledgements
We thank Dr. Zhenxiang Zang for the helpful discussion when writing the abstract. We thank all the staffs at the Department of Radiology and Nuclear Medicine, Xuanwu Hospital for their help.References
1. Mochizuki H, Choong CJ, Baba K. Parkinson's disease and iron. J Neural Transm (Vienna). 2020;127(2):181-187.
2. Lehéricy S, Roze E, Goizet C, Mochel F. MRI of neurodegeneration with brain iron accumulation. Curr Opin Neurol. 2020;33(4):462-473.
3. Biondetti E, Santin MD, Valabrègue R, Mangone G, Gaurav R, Pyatigorskaya N, Hutchison M, Yahia-Cherif L, Villain N, Habert MO, Arnulf I, Leu-Semenescu S, Dodet P, Vila M, Corvol JC, Vidailhet M, Lehéricy S. The spatiotemporal changes in dopamine, neuromelanin and iron characterizing Parkinson's disease. Brain. 2021;144(10):3114-3125.
4. Guan X, Guo T, Zhou C, Wu J, Zeng Q, Li K, Luo X, Bai X, Wu H, Gao T, Gu L, Liu X, Cao Z, Wen J, Chen J, Wei H, Zhang Y, Liu C, Song Z, Yan Y, Pu J, Zhang B, Xu X, Zhang M. Altered brain iron depositions from aging to Parkinson's disease and Alzheimer's disease: A quantitative susceptibility mapping study. Neuroimage. 2022;264:119683.
5. Thomas GEC, Leyland LA, Schrag AE, Lees AJ, Acosta-Cabronero J, Weil RS. Brain iron deposition is linked with cognitive severity in Parkinson's disease. J Neurol Neurosurg Psychiatry. 2020;91(4):418-425.
6. Thomas GEC, Zarkali A, Ryten M, Shmueli K, Gil-Martinez AL, Leyland LA, McColgan P, Acosta-Cabronero J, Lees AJ, Weil RS. Regional brain iron and gene expression provide insights into neurodegeneration in Parkinson's disease. Brain. 2021;144(6):1787-1798.
7. Liu X, Wang Y, Ji H, Aihara K, Chen L. Personalized characterization of diseases using sample-specific networks. Nucleic Acids Res. 2016;44(22):e164.
8. McGregor MM, Nelson AB. Circuit Mechanisms of Parkinson's Disease. Neuron. 2019;101(6):1042-1056.
9. Islam KUS, Meli N, Blaess S. The Development of the Mesoprefrontal Dopaminergic System in Health and Disease. Front Neural Circuits. 2021;15:746582.
10. Mori Y, Yoshikawa E, Futatsubashi M, Ouchi Y. Neural correlates of standing imagery and execution in Parkinsonian patients: The relevance to striatal dopamine dysfunction. PLoS One. 2020;15(10):e0240998.
11. Martin JA, Zimmermann N, Scheef L, Jankowski J, Paus S, Schild HH, Klockgether T, Boecker H. Disentangling motor planning and motor execution in unmedicated de novo Parkinson's disease patients: An fMRI study. Neuroimage Clin. 2019;22:101784.
12. Wen J, Guo T, Wu J, Bai X, Zhou C, Wu H, Liu X, Chen J, Cao Z, Gu L, Pu J, Zhang B, Zhang M, Guan X, Xu X. Nigral Iron Deposition Influences Disease Severity by Modulating the Effect of Parkinson's Disease on Brain Networks. J Parkinsons Dis. 2022;12(8):2479-2492.
Figures