0307
Whole cord diffusion imaging of post-mortem human spinal cord injury reveals extent and potential timeline of axonal swelling and degeneration1International Collaboration on Repair Discoveries, Vancouver, BC, Canada, 2Physics and Astronomy, The University of British Columbia, Vancouver, BC, Canada, 3Radiology, The University of British Columbia, Vancouver, BC, Canada, 4Faculty of Medicine, UBC MRI Research Centre, Vancouver, BC, Canada, 5Pathology & Laboratory Medicine, The University of British Columbia, Vancouver, BC, Canada, 6Vancouver General Hospital, Vancouver, BC, Canada, 7Orthopaedics, The University of British Columbia, Vancouver, BC, Canada
Synopsis
Keywords: Microstructure, Spinal Cord, White Matter, Traumatic Injury, ActiveAx, Spinal Cord Injury, DTI, Myelin, Axons
Motivation: Following spinal cord injury (SCI) changes in tissue microstructure occur throughout the length of the cord which are not detectable with conventional MRI.
Goal(s): To characterize whole cord diffusion MRI metrics in human SCI post-mortem tissue, including the effect of injury-to-death interval on diffusion MRI metrics.
Approach: Two full-length spinal cords were imaged at 7T. DTI and ActiveAx metrics were extracted from white matter tracts.
Results: Changes in fractional anisotropy, axon density, and axon diameter were observed downstream of the injury epicentre in the case with a longer injury-to-death interval. Transience in diffusion metrics may indicate the extent of axonal degeneration and swelling.
Impact: Diffusion MRI may be a useful tool in understanding the extent and progression of spinal cord injury. Insight into axonal swelling and degeneration following spinal cord injury could aid clinicians in predicting patient prognosis.
Introduction
Spinal cord injury (SCI) affects ~20 million people worldwide. Clinical outcomes are highly heterogenous based on injury location, severity, and mechanism. After initial injury, secondary injury of white matter tracts radiating from the injury epicenter occurs over weeks to years and may affect long segments of the cord1.This “Wallerian degeneration” with disintegration of axons and myelin is due to disconnection of the axon from the neuronal cell body 2,3. Conventional MRI can detect Wallerian degeneration-associated non-specific T2 intensity changes as early as 4–7 weeks post-injury4,5.Diffusion MRI can potentially provide more specific information about Wallerian degeneration-related spinal cord tissue morphology changes2. Diffusion Tensor Imaging (DTI) fractional anisotropy (FA) and mean diffusivity (MD) can probe tissue integrity, however, DTI has limited correlation with specific tissue microstructure properties due to confounders like size, density, and orientation distribution of cells6,7. ActiveAx is a diffusion-weighted MRI biophysical model that provides estimations of axon density, axon diameter, and intracellular volume fraction (ICVF)7. ActiveAx accounts for the distribution of axon diameters within tissue and can extract metric estimations along pathways with varying orientations7,8,9, relevant in SCI where fibre orientations may be disrupted.
Objective: Characterize whole cord diffusion MRI metrics of tissue damage (FA, MD, axon density, axon diameter, ICVF) in human SCI post-mortem tissue, and investigate the effect of injury-to-death interval on these diffusion metrics.
Methods
Acquisition: Two full-length spinal cords from the International SCI Biobank (www.sci-biobank.org) from donors with injury-to-death interval of 17 and 112 days were studied (Fig.1). Formalin-fixed cords were imaged in 4.5cm segments (7T Bruker, 35mm inner-diameter quadrature volume coil, anatomical RARE (0.1x0.1x1mm3, slices=45), multi-shell 3D diffusion-weighted SE EPI (TR/TE=250/41.21ms, 0.15x0.15x1mm3, six b=0 scans, shells=5, b=500,1000,2000,3500,5000,7000s/mm, directions=6,15,24,42,60,80 respectively, uniformly distributed by Spherical Code optimization10).Analysis: Data was pre-processed using non-local mean denoising11. Diffusion images were susceptibility and Eddy current corrected9,12 and fit with DTI/ActiveAx models7 (Fig.2 shows representative axon density maps). White matter (WM) and grey matter manual masks from RARE images were registered slice-wise to a histology spinal cord atlas13,14 (Fig.3), and DTI/ActiveAx metrics were extracted from each WM tract per slice. Metrics were compared between the cord section immediately above the injury epicentre to the section of cord located ~90mm below the injury epicentre (chosen to avoid the injury site) and the furthest cord segment below the injury epicentre (~240mm or ~320mm for cases 1 and 2, respectively).
Results
CASE 1 (Fig.3, injury-to-death interval=17 days):Descending tracts displayed stable (<5%) change in FA, axon density, and axon diameter between ~90mm below injury-epicenter and the cord segment most caudal from injury-epicenter (~240mm) (Fig.5). MD and ICVF values were stable above and below the injury epicentre for all tracts.
CASE 2 (Fig.4, injury-to-death interval=112 days):
Descending tracts displayed large transience (>60%) in FA and axon density values between ~90mm below injury-epicenter and the cord segment most caudal from injury-epicenter (~320mm) (Fig.5). Considerable transience (<20%) was also seen for axon diameter values over the same region in descending tracts. MD and ICVF values were stable above and below the injury epicentre for all tracts.
Discussion
Tissue microstructure of traumatically injured human spinal cords were investigated along the entire length of the cord using DTI and ActiveAx. Decreased FA and axon density downstream of the injury-epicentre could be attributed to the effects of Wallerian degeneration on WM integrity, as seen in previous in-vivo SCI studies15. For descending tracts, the largest change in metric values was between the cord sections above and ~90mm below the injury-epicentre. Descending tracts also showed the largest transience in metric values below the injury-epicentre. The large transience in downstream metric values for descending tracts in the longer injury-to-death interval case may indicate axonal degeneration progression (FA, axon density) and persistent axonal swelling (axon diameter) along the length of the cord not apparent in the shorter injury-to-death interval case.Conclusion
Large changes in FA, axon density and axon diameter were observed along the spinal cord downstream of the injury-epicentre in the case with a 112 day injury-to-death interval but not in the case with a 17 day injury-to-death interval. Transience in FA and axon density along the spinal cord may indicate the extent of axonal degeneration, while axon diameter may indicate the extent of axonal swelling. Diffusion MRI may be useful for investigating the extent of axonal degeneration and swelling in traumatic SCI. Examining additional donor tissue with varying injury-to-death intervals is warranted and on-going to better characterize the timing of damage from secondary injury in SCI.Acknowledgements
We would like to thank the patients and families for donating their tissue to the International Spinal Cord Injury Biobank. Funding for this study and the Biobank was obtained from NSERC, Blusson Integrated Cures Partnership (BICP), VGH and UBC Hospital Foundation and the Rick Hansen Foundation, and an International Collaboration on Repair Discoveries (ICORD) seed grant. This work was conducted on the traditional, ancestral, and unceded territories of Coast Salish Peoples, including the territories of the xwməθkwəy̓əm (Musqueam), Skwxwú7mesh (Squamish), Stó:lō and Səl̓ílwətaʔ/Selilwitulh (Tsleil- Waututh) Nations.
References
[1] A. Alizadeh, S. M. Dyck and S. Karimi-Abdolrezaee, "Traumatic Spinal Cord Injury: An Overview of Pathophysiology, Models and Acute Injury Mechanisms," Frontiers in Neurology, vol. 19, 2019.[2] T. Fischer, C. Stern, P. Freund, M. Schubert and R. Sutter, "Wallerian degeneration in cervical spinal cord tracts is commonly seen in routine T2-weighted MRI after traumatic spinal cord injury and is associated with impairment in a retrospective study," European Radiology, vol. 31, no. 5, pp. 2923-2932, 2021.
[3] A. D. Gaudet, P. G. Popovich and M. S. Ramer, "Wallerian degeneration: Gaining perspective on inflammatory events after peripheral nerve injury," Journal of Neuroinflammation, vol. 8, p. 110, 2011.
[4] J. L. Becerra, W. R. Puckett, E. D. Hiester, R. M. Quencer, A. E. Marcillo, M. J. Post and R. P. Bunge, " MR-pathologic comparisons of wallerian degeneration in spinal cord injury," American Journal of neuroradiology, vol. 16, no. 1, pp. 125-133, 1995.
[5] M. J. Kuhn, D. J. Mikulis, D. M. Ayoub, B. E. Kosofsky, K. R. Davis and J. M. Taveras, "Wallerian degeneration after cerebral infarction: evaluation with sequential MR imaging," Radiology, vol. 172, p. 179, 1989.
[6] T. Duval, J. A. McNab, K. Setsompop, T. Witzel, T. Schneider, S. Y. Huang, B. Keil, E. C. Klawiter, L. L. Wald and J. Cohen-Adad, "In vivo mapping of human spinal cord microstructure at 300 mT/m," Neuroimage, vol. 118, pp. 494-507, 2016.
[7] D. C. Alexander, P. L. Hubbard, M. G. Hall, E. A. Moore, M. Ptito, G. J. M. Parker and T. B. Dyrby, "Orientationally invariant indices of axon diameter and density from diffusion MRI," NeuroImage, pp. 1374-1389, 2010.
[8] F. Sepehrband, D. C. Alexander, D. N. Kurniawan, D. C. Reutens and Z. Yang, "Towards higher sensitivity and stability of axon diameter estimation with diffusionweighted MRI," NRM in biomedicine, vol. 26, pp. 293-308, 2015.
[9] J. L. R. Andersson and S. N. Sotiropoulos, "An integrated approach to correction for off-resonance effects and subject movement in diffusion MR imaging," NeuroImage, vol. 125, pp. 1063-1078, 2016.
[10] J. Cheng, D. Shen, P. T. Yao and P. J. Basser, "Single- and Multiple-Shell Uniform Sampling Schemes for Diffusion MRI Using Spherical Codes," IEEE Transactions on Medical Imaging, vol. 37, pp. 185-199, 2018.
[11] P. Coup and Et. al., "An optomized blockwise nonlocal means denoising filter for 3-D magnetic resonance images," IEEE Transaction on Medical Imaging, vol. 27, pp. 425-441, 2008.
[12] J. L. R. Andersson, S. Skare and J. Ashburner, "How to correct susceptibility distortions in spin-echo echo-planar images: application to diffusion tensor imaging," NeuroImage, vol. 20, pp. 870-888, 2003.
[13] A. Myronenko and X. Song, "Point-Set Registration: Coherent Point Drift," IEEE Transaction on Pattern Analysis and Machine Intelligence, vol. 32, pp. 2262-2275, 2010.
[14] G. Sengul, C. Watson, I. Tanaka and G. Paxinos, "Atlas of the spinal cord: Mouse, rat, rhesus, marmoset and human," Elsevier, 2012.
[15] J. Cohen-Adad and et. al., "Demyelination and degeneration in the injured human spinal cord detected with diffusion and magnetization transfer MRI," NeuroImage, vol. 55, pp. 1024-1033, 2011.Figures
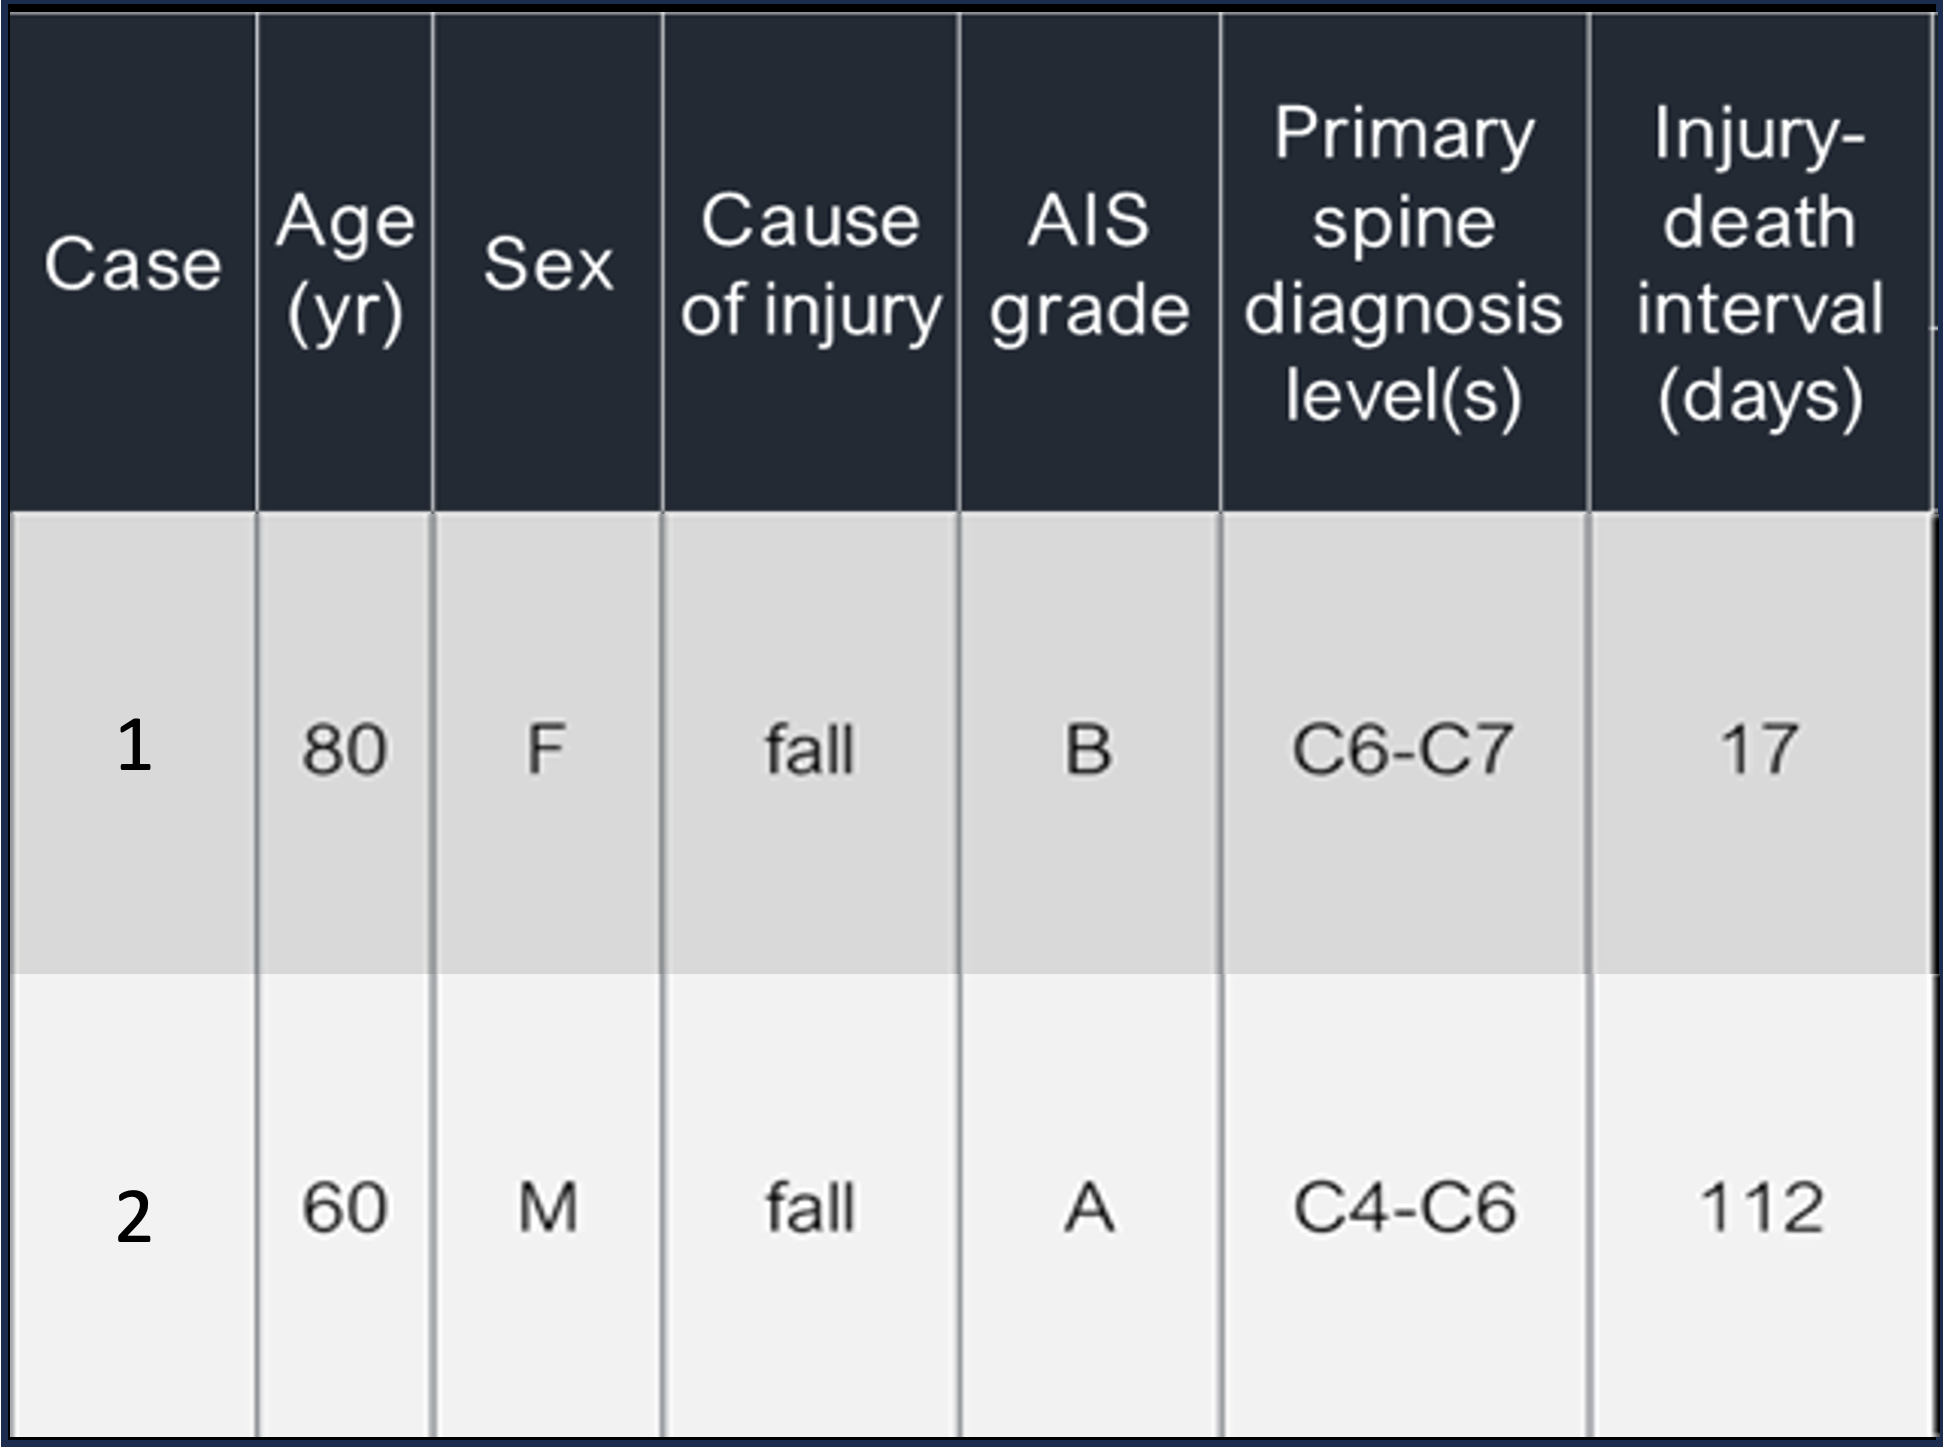
Fig.1: Patient donor information from the International Spinal Cord Injury Biobank. AIS grades: A= Complete loss of motor/sensory function below injury, B= sensory but no motor function below injury)
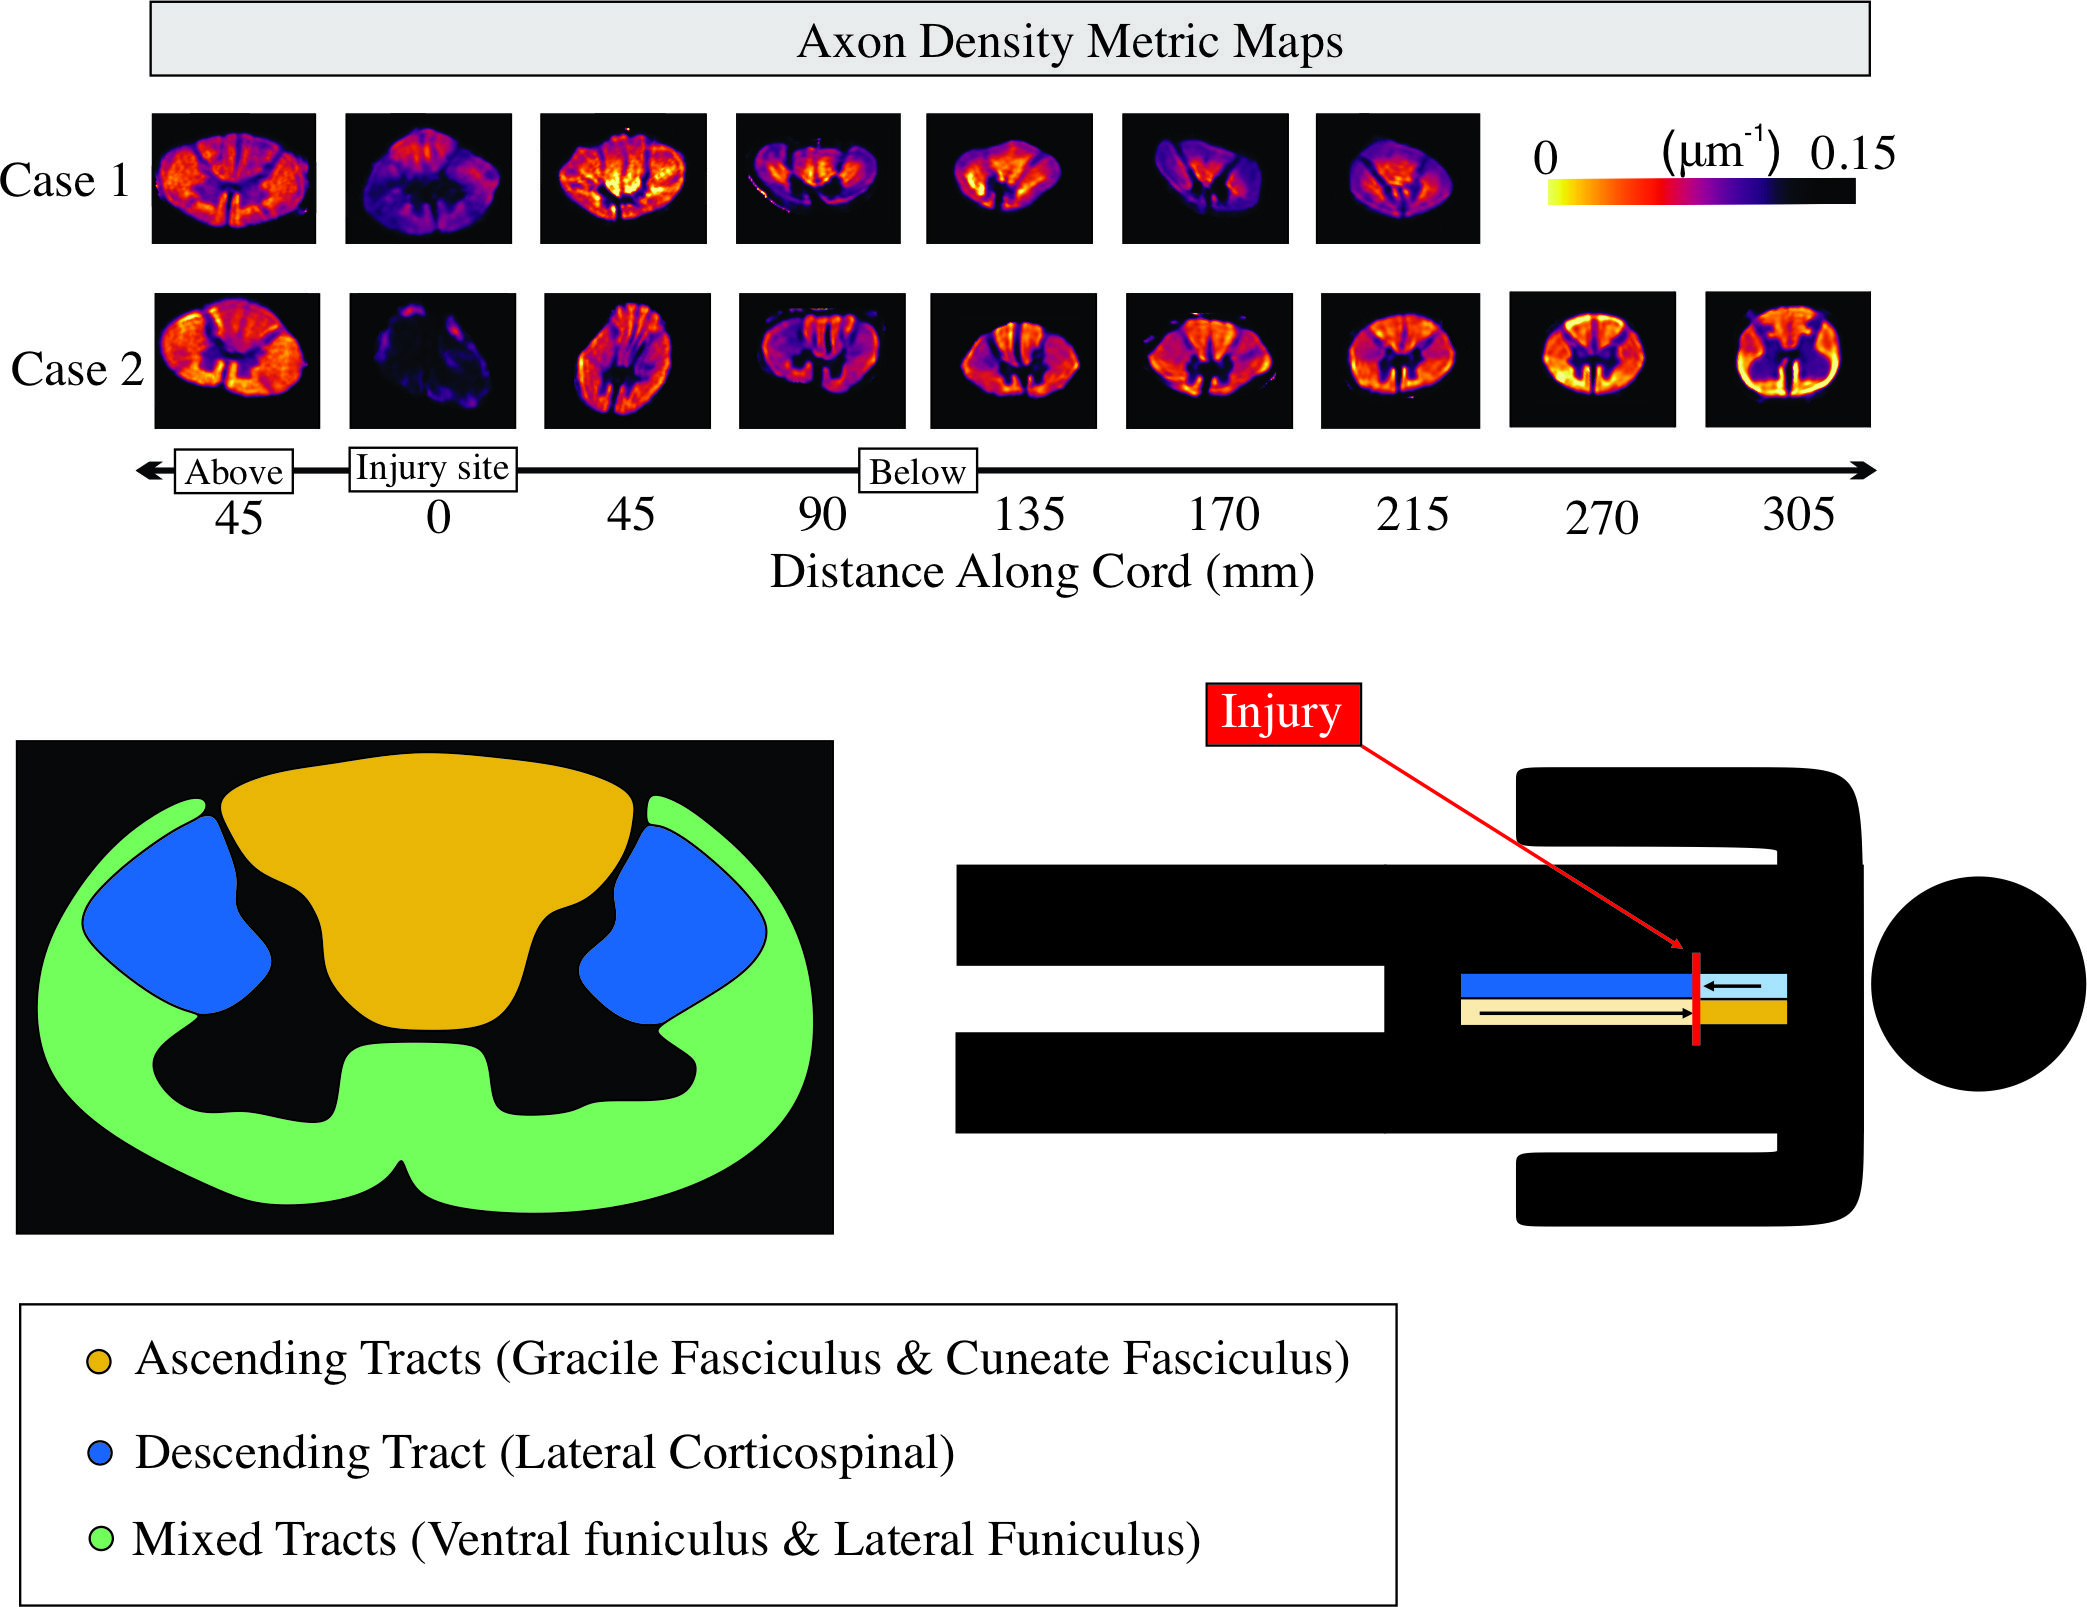
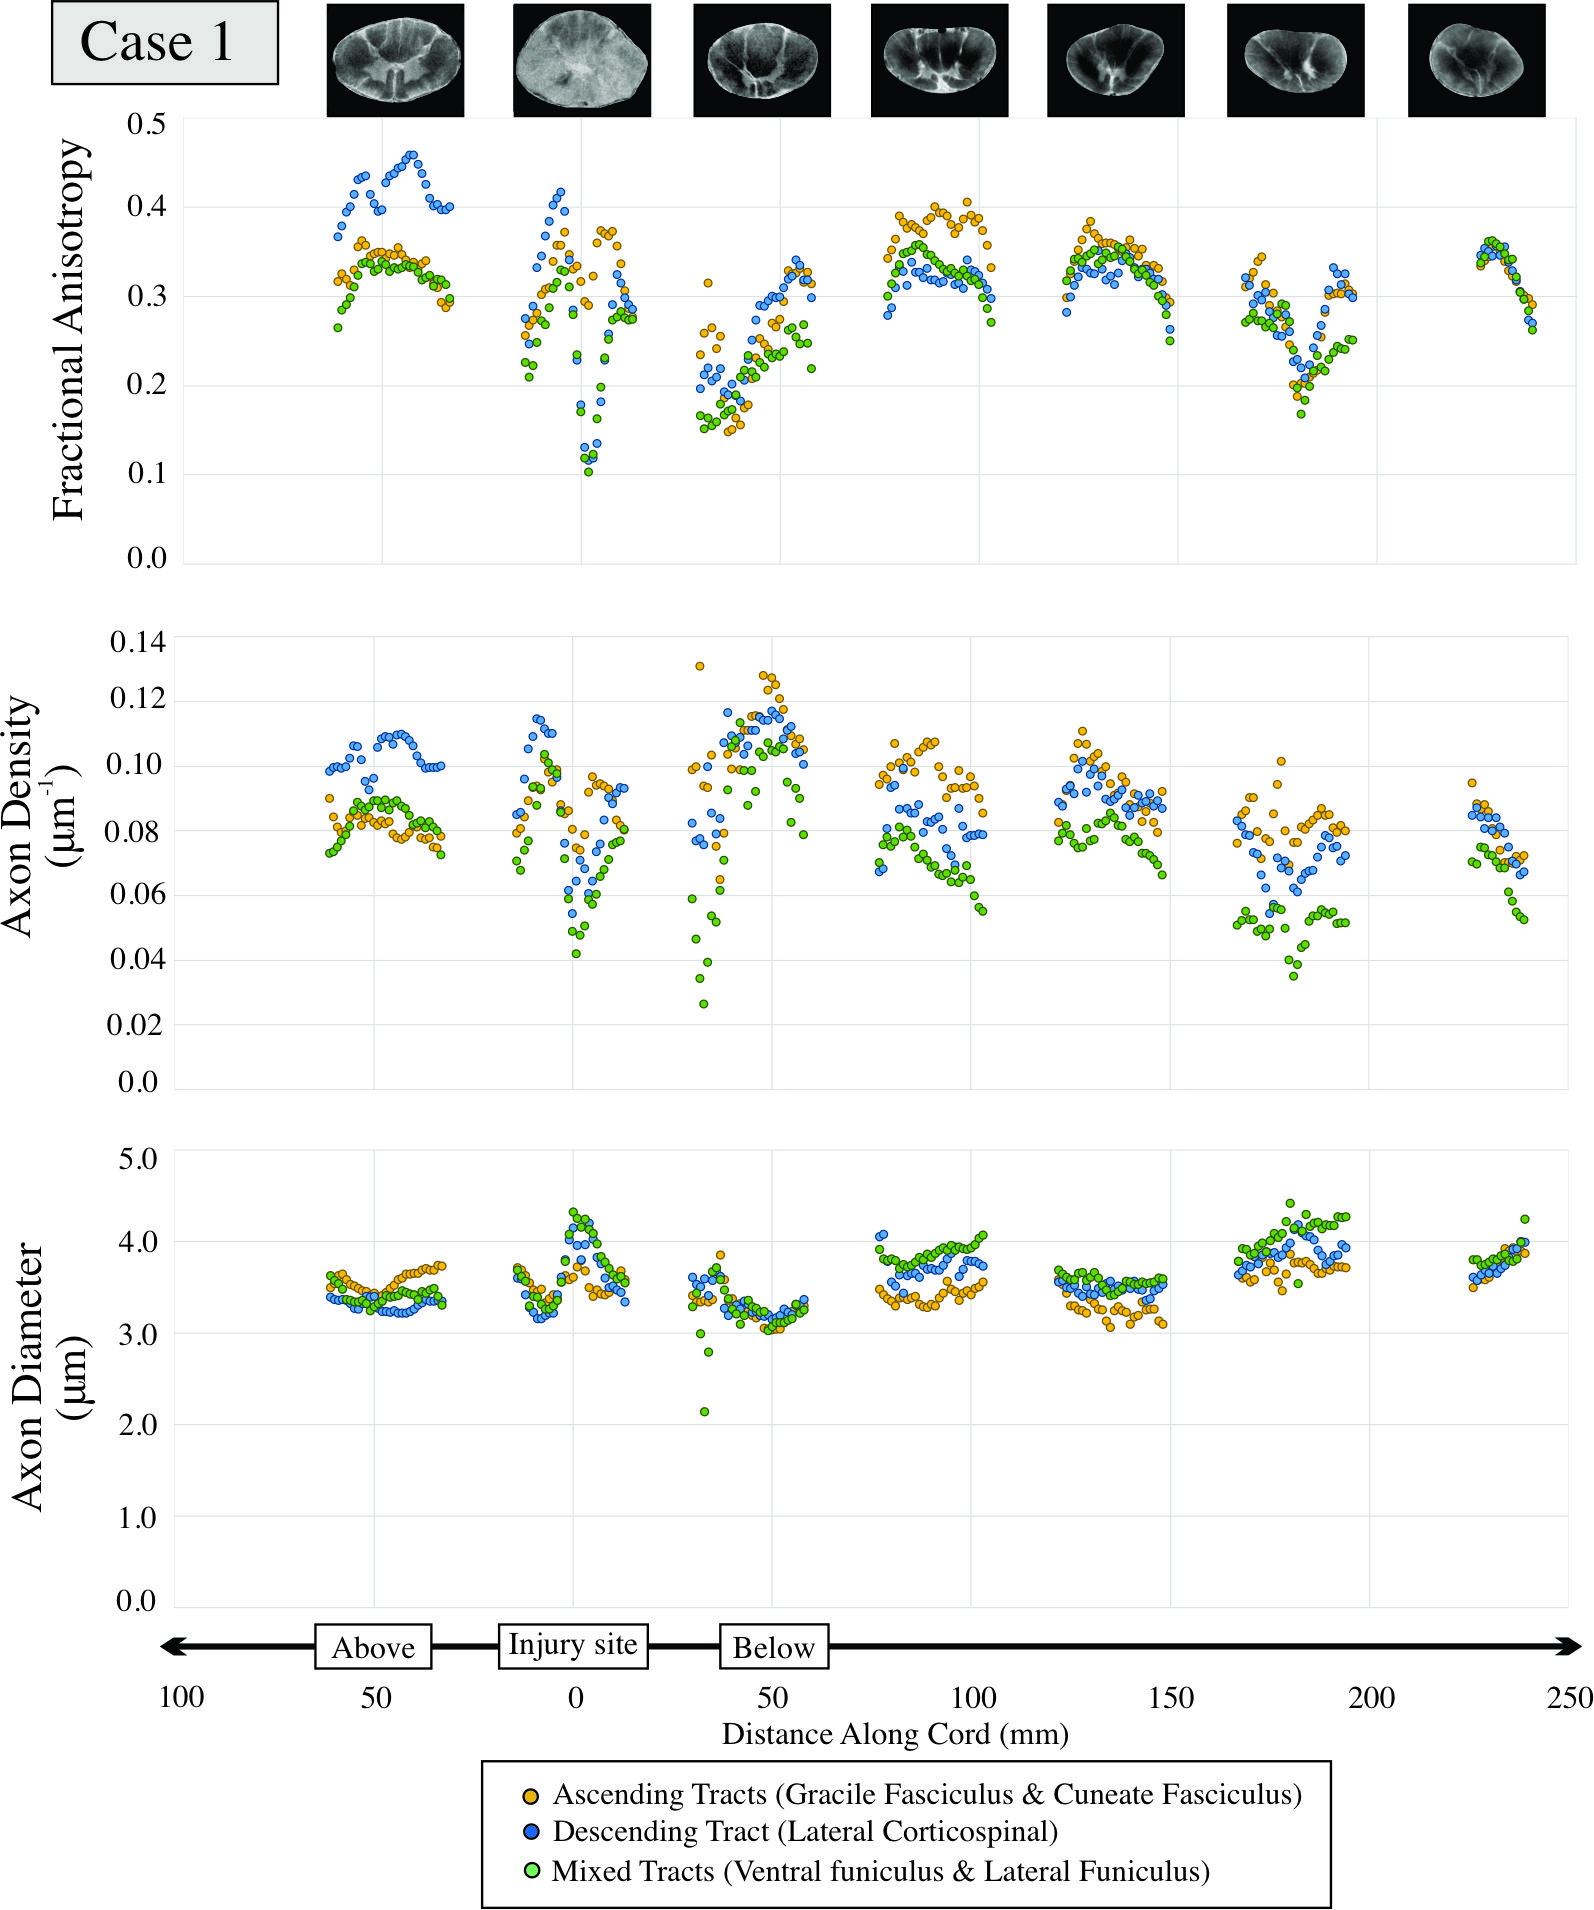
Fig.3: Diffusion imaging metrics for Case 1 with injury-to-death interval of 17 days are shown for a ~30 cm portion of spinal cord with injury epicenter located at 0mm. Representative T2 weighted images are given for each cord region.
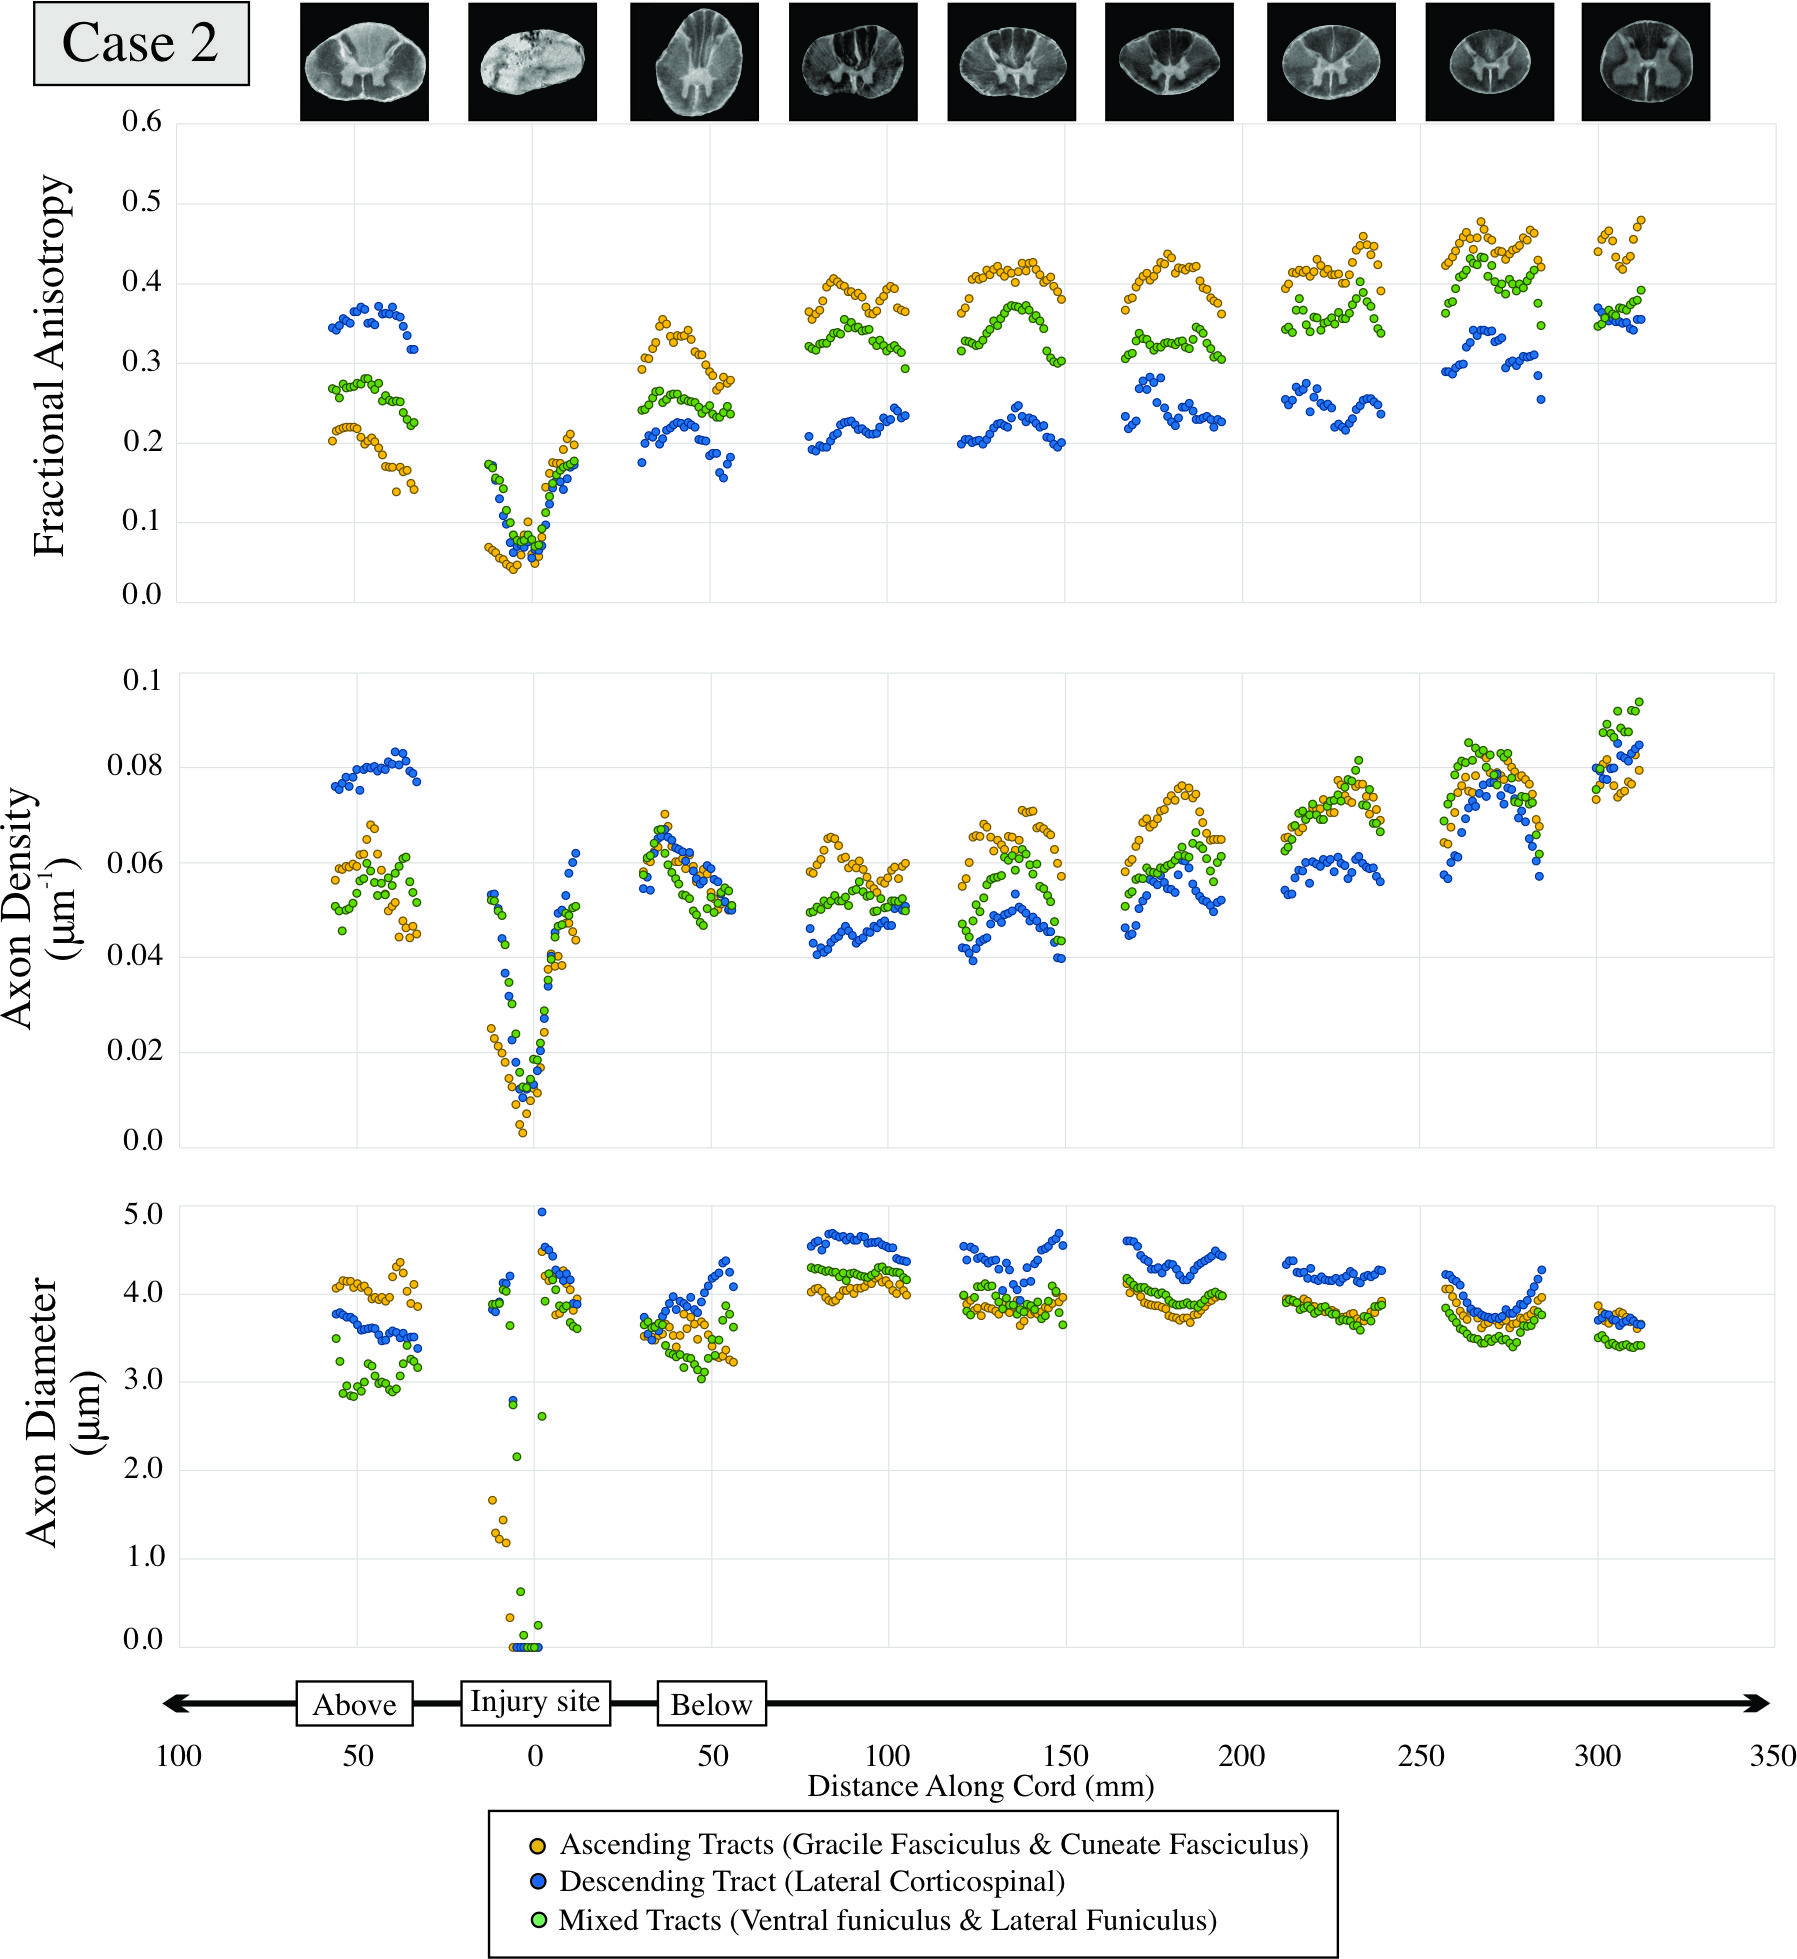
Fig.4: Diffusion imaging metrics for Case 2 with injury-to-death interval of 112 days are shown for a ~38 cm portion of spinal cord with injury epicenter located at 0mm. Representative T2 weighted images are given for each cord region.
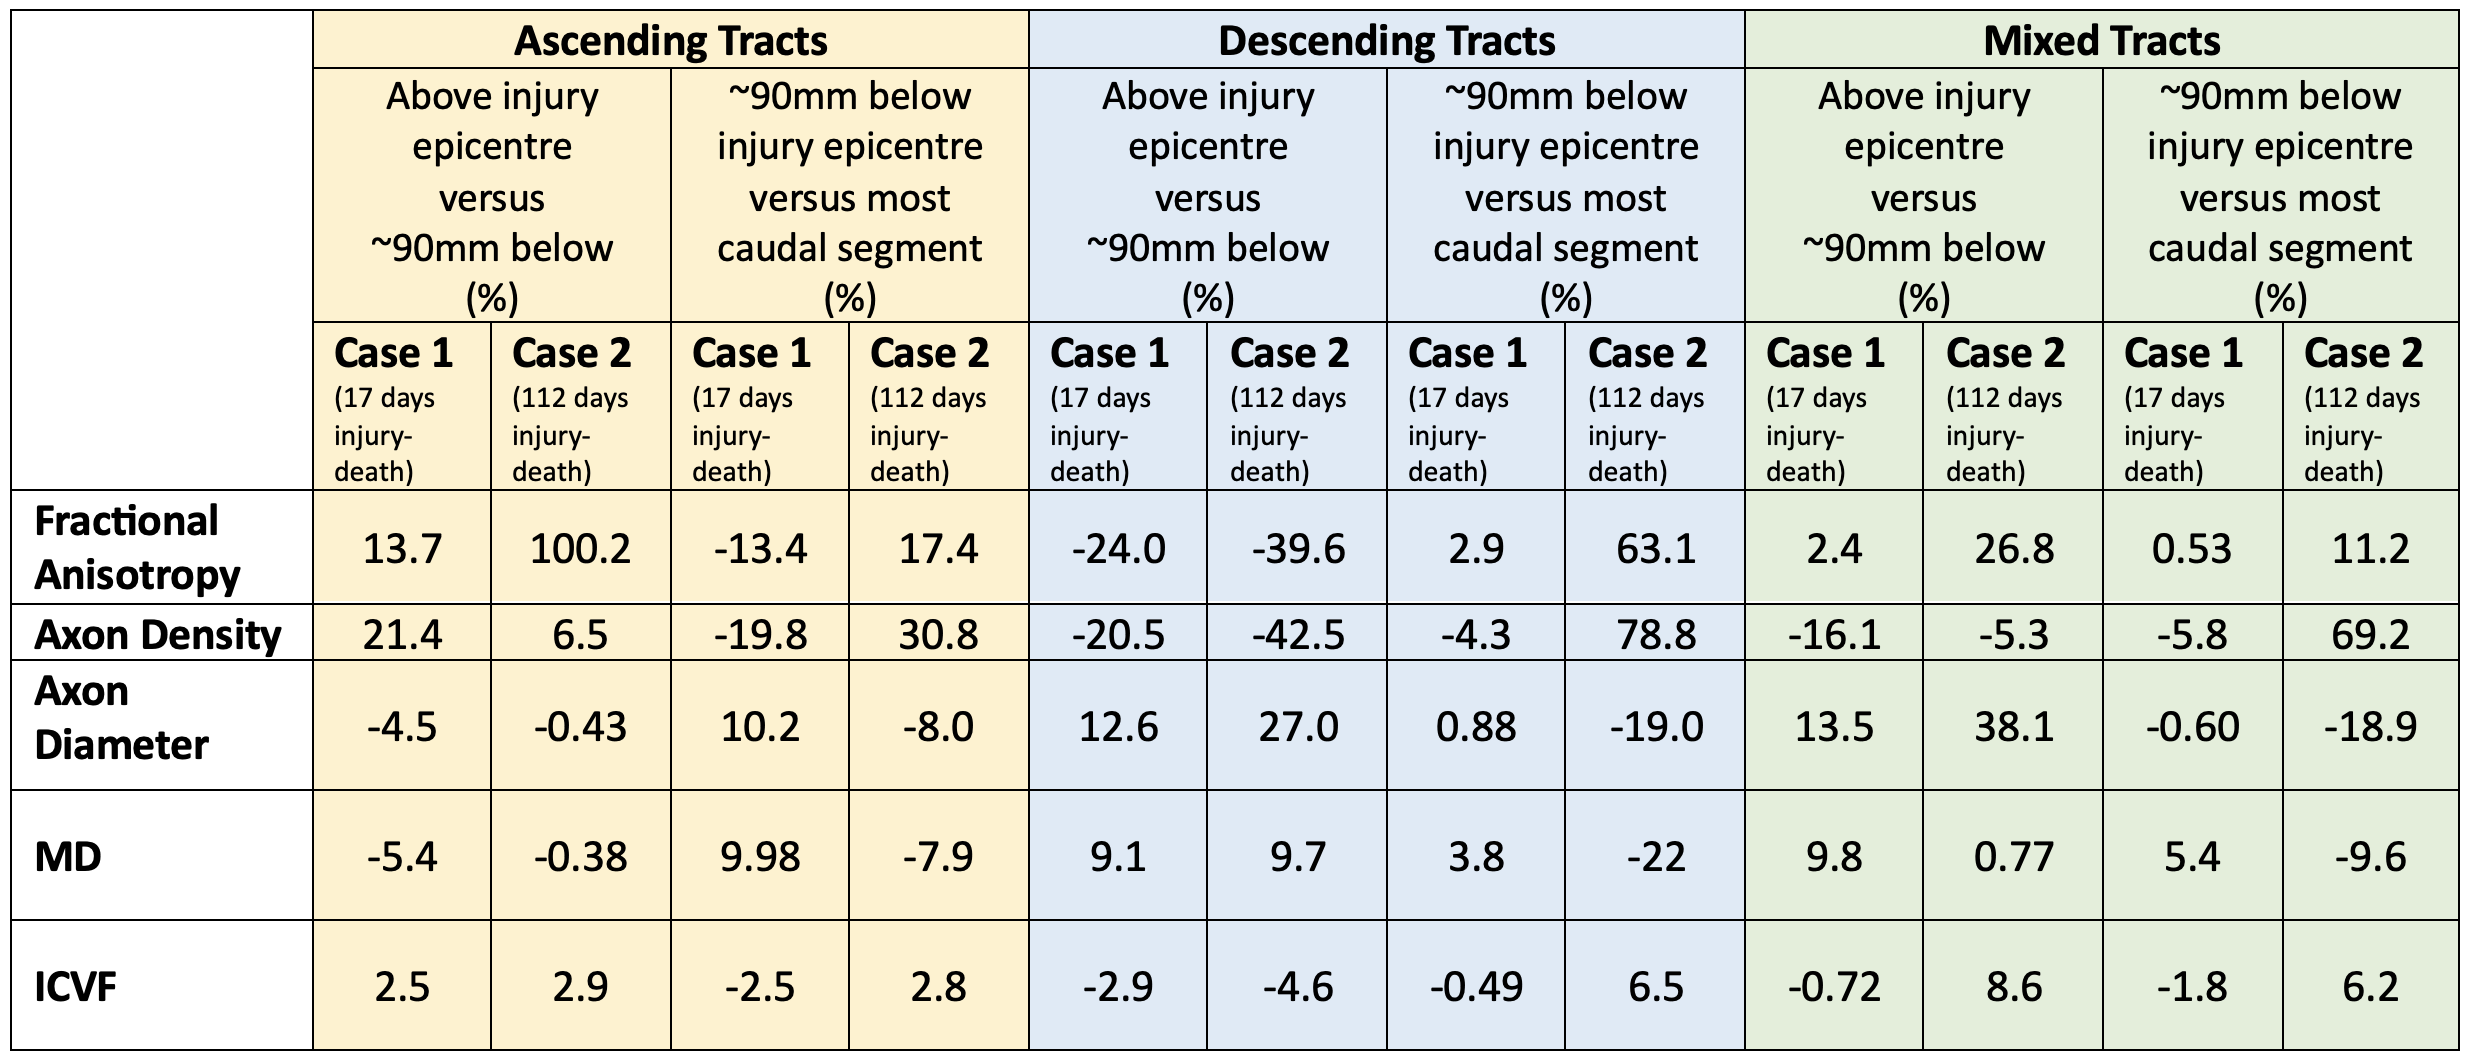
Fig 5. Table displaying changes in metric values for case 1 and case 2 in ascending, descending and mixed tracts for above injury epicentre relative to ~90mm below and ~90mm below injury epicentre relative to the most caudal section (~240mm for case 1 and ~320mm for case 2).