0306
Automatic segmentation of T2-weighted hyperintense lesions in spinal cord injury1NeuroPoly Lab, Institute of Biomedical Engineering, Polytechnique Montreal, Montreal, QC, Canada, 2Mila - Quebec AI Institute, Montreal, QC, Canada, 3Department of Neurosurgery, Faculty of Medicine and Dentistry, Palacký University Olomouc, Olomouc, Czech Republic, 4Department of Neurology, Faculty of Medicine and Dentistry, Palacký University Olomouc, Olomouc, Czech Republic, 5Centre Hospitalier de l’Université de Montréal, University of Montreal, Montreal, QC, Canada, 6Spinal Cord Injury Center, Balgrist University Hospital, University of Zürich, Zürich, Switzerland, 7Department of Anesthesiology, Perioperative and Pain Medicine, Stanford University School of Medicine, Standford, CA, United States, 8Department of Physical Medicine and Rehabilitation Physical Therapy Program, University of Colorado School of Medicine, Aurora, CO, United States, 9Department of Neurophysics, Max Planck Institute for Human Cognitive and Brain Sciences, Leipzig, Germany, 10Functional Neuroimaging Unit, CRIUGM, Université de Montréal, Montreal, QC, Canada, 11Centre de Recherche du CHU Sainte-Justine, Université de Montréal, Montreal, QC, Canada
Synopsis
Keywords: Analysis/Processing, Spinal Cord, Deep Learning; Spinal Cord Injury; Segmentation
Motivation: Morphometric analysis of the intramedullary lesion following spinal cord injury will assist in understanding the extent of the injury and choosing the best therapeutic strategy for rehabilitation.
Goal(s): Our objective was to develop a deep learning-based tool for the segmentation of T2-weighted hyperintense spinal cord injury lesions.
Approach: A nnUNet model was trained to segment both the spinal cord and lesions from two different datasets.
Results: Compared to existing methods, our model achieved the best segmentation performance for both cord and lesions. The code/model is available on GitHub and will soon be part of the Spinal Cord Toolbox.
Impact: Automatic segmentation of spinal cord injury lesions replaces the tedious process of manual annotation and enables the extraction of relevant lesion morphometrics in large cohorts. The proposed model generalizes across lesion etiologies (traumatic/ischemic), scanner manufacturers and heterogeneous image resolutions.
Introduction
Traumatic spinal cord injury (SCI) results from acute damage to the spinal cord (SC) due to external physical impact forces such as motor vehicle or sports-related injuries. The majority of traumatic SCI patients sustain permanent neurological deficits like sensorimotor and autonomic dysfunction. Conventional MRI is the reference imaging modality for assessing the severity of traumatic SCI and is a fundamental component in early diagnosis, surgical management and rehabilitation. MRI-derived biomarkers such as intramedullary lesion length or lesion volume have shown associations with the neurological prognosis of traumatic SCI patients1,2. However, due to the lack of automatic methods, these biomarkers are derived manually, which is a time-consuming process prone to inter-rater variability. In this work, we propose a deep learning model for the automatic segmentation of both the SC and T2-weighted (T2-w) hyperintense lesions in SCI images. This method could complement the clinical diagnostic workup and guide rehabilitation and therefore facilitate the management of traumatic SCI patients.Methods
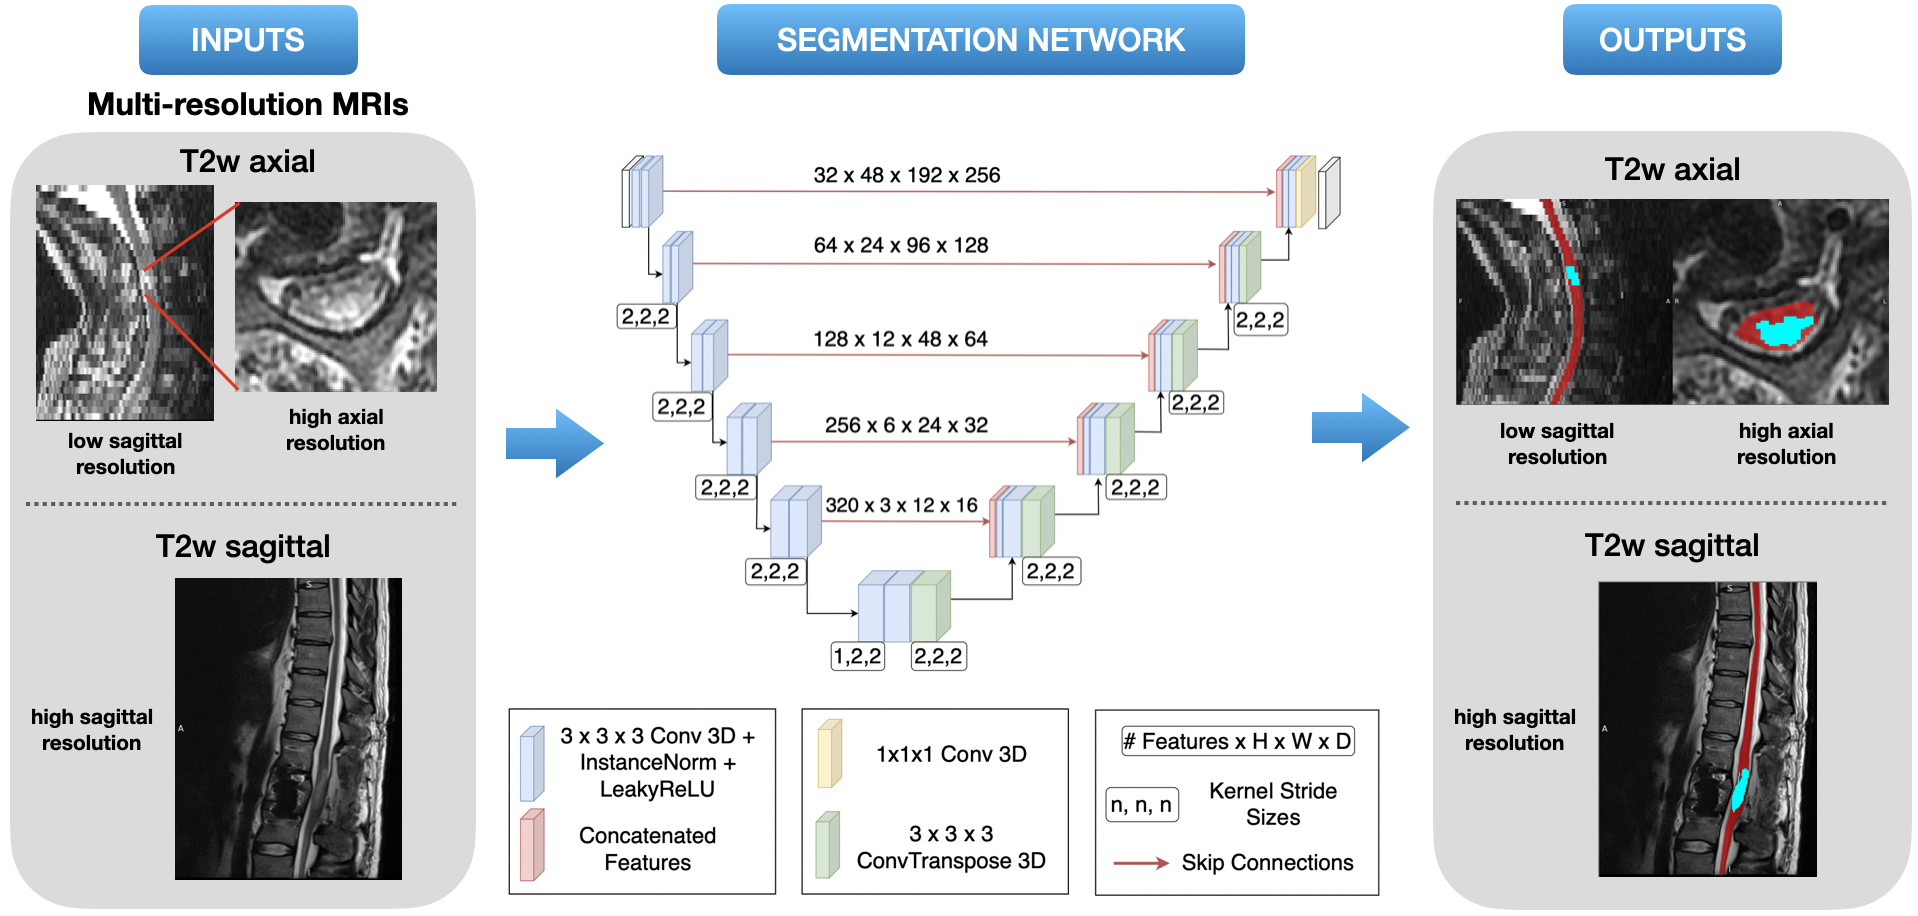
A bicentric retrospective cohort of operatively and non-operatively treated SCI patients (Zurich: N = 97, Colorado: N = 80) was used. The data consisted of T2-w MRI scans with heterogeneous lesion etiology (traumatic/ischemic), voxel sizes, fields of view, and orientations (sagittal/axial). Four expert raters segmented the SC and T2-w hyperintense lesions. The nnUNetv2 framework3 was used for training the model to simultaneously segment both the SC and the T2-w hyperintense lesions (Figure 1). The model initially segments the SC, using it as the localization for the subsequent lesion segmentation. Data augmentation was used to further diversify the images in the dataset and improve generalizability. To prevent the model from being biased towards a particular dataset split, we trained the model on five random seeds resulting in five different train/test splits of the dataset. The model’s performance was evaluated by a comparison with three other SC segmentation baselines: PropSeg4 and DeepSeg 2D/3D5. Due to the lack of an existing state-of-the-art method for SCI lesion segmentation, we compared our proposed 3D model with its 2D counterpart.Results
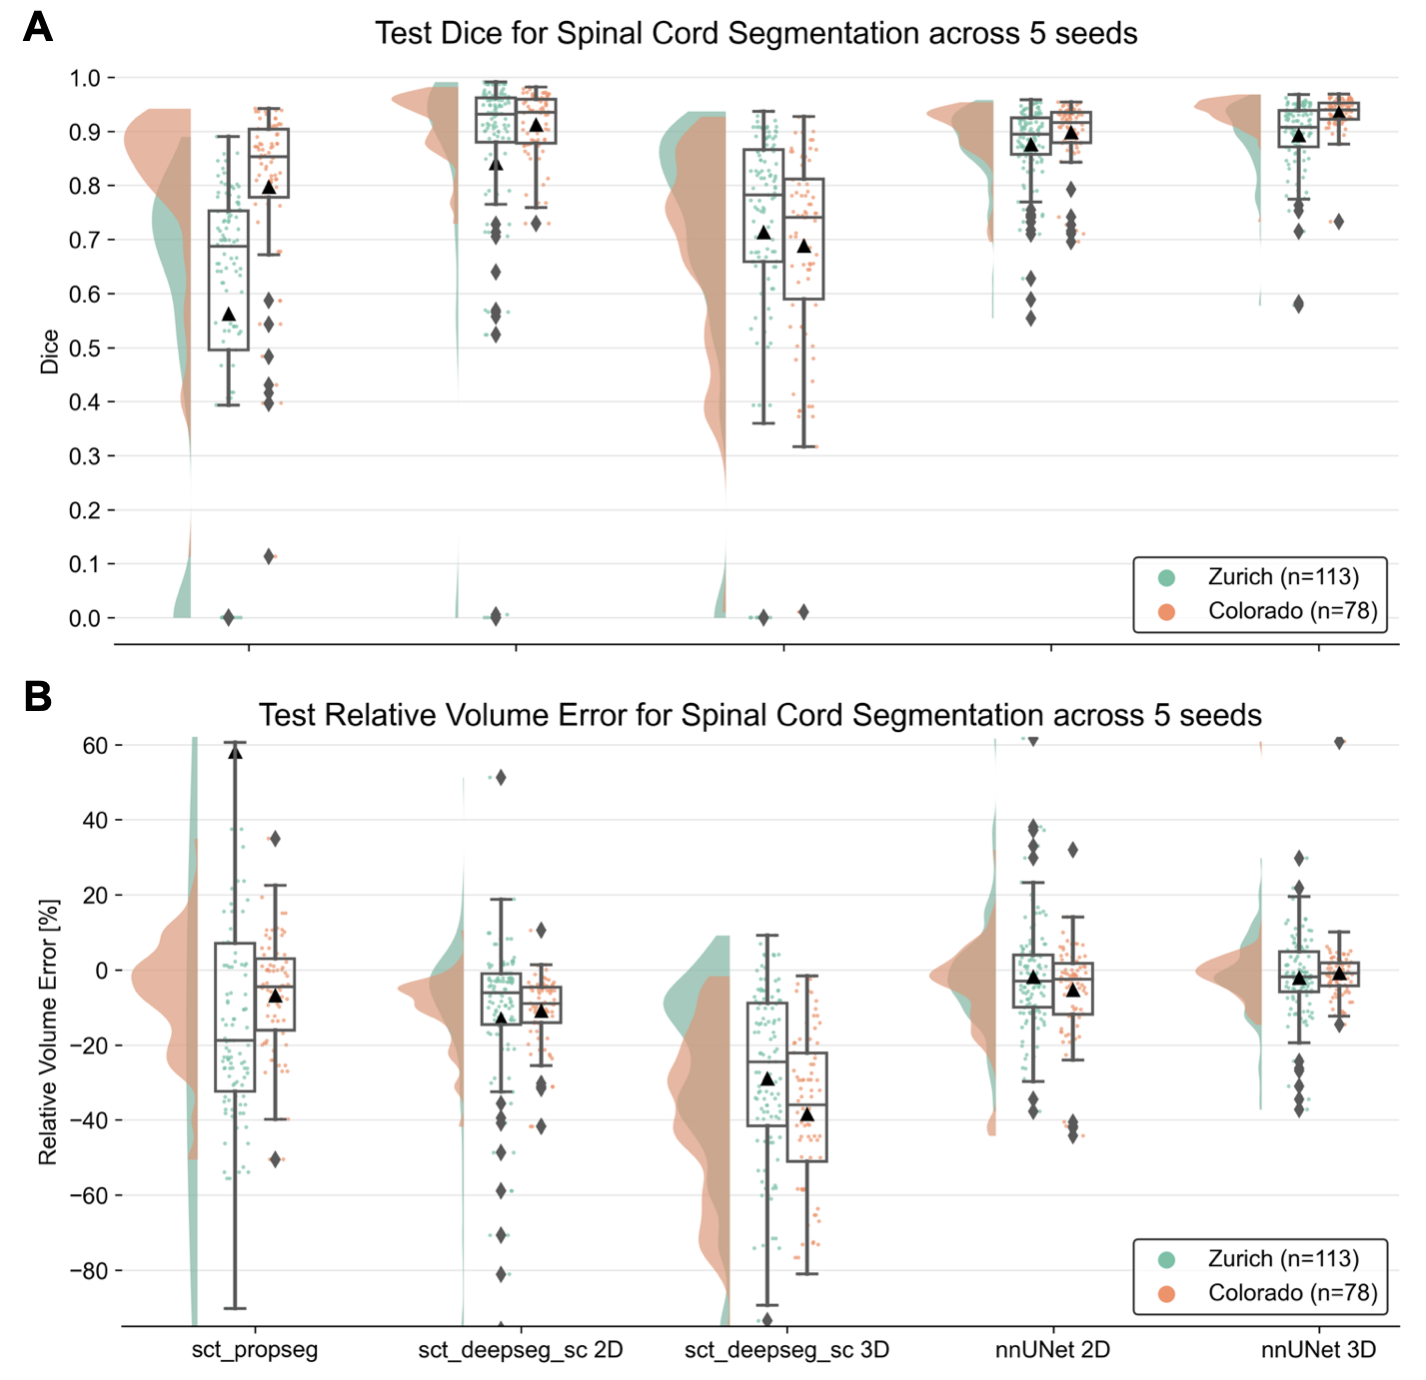
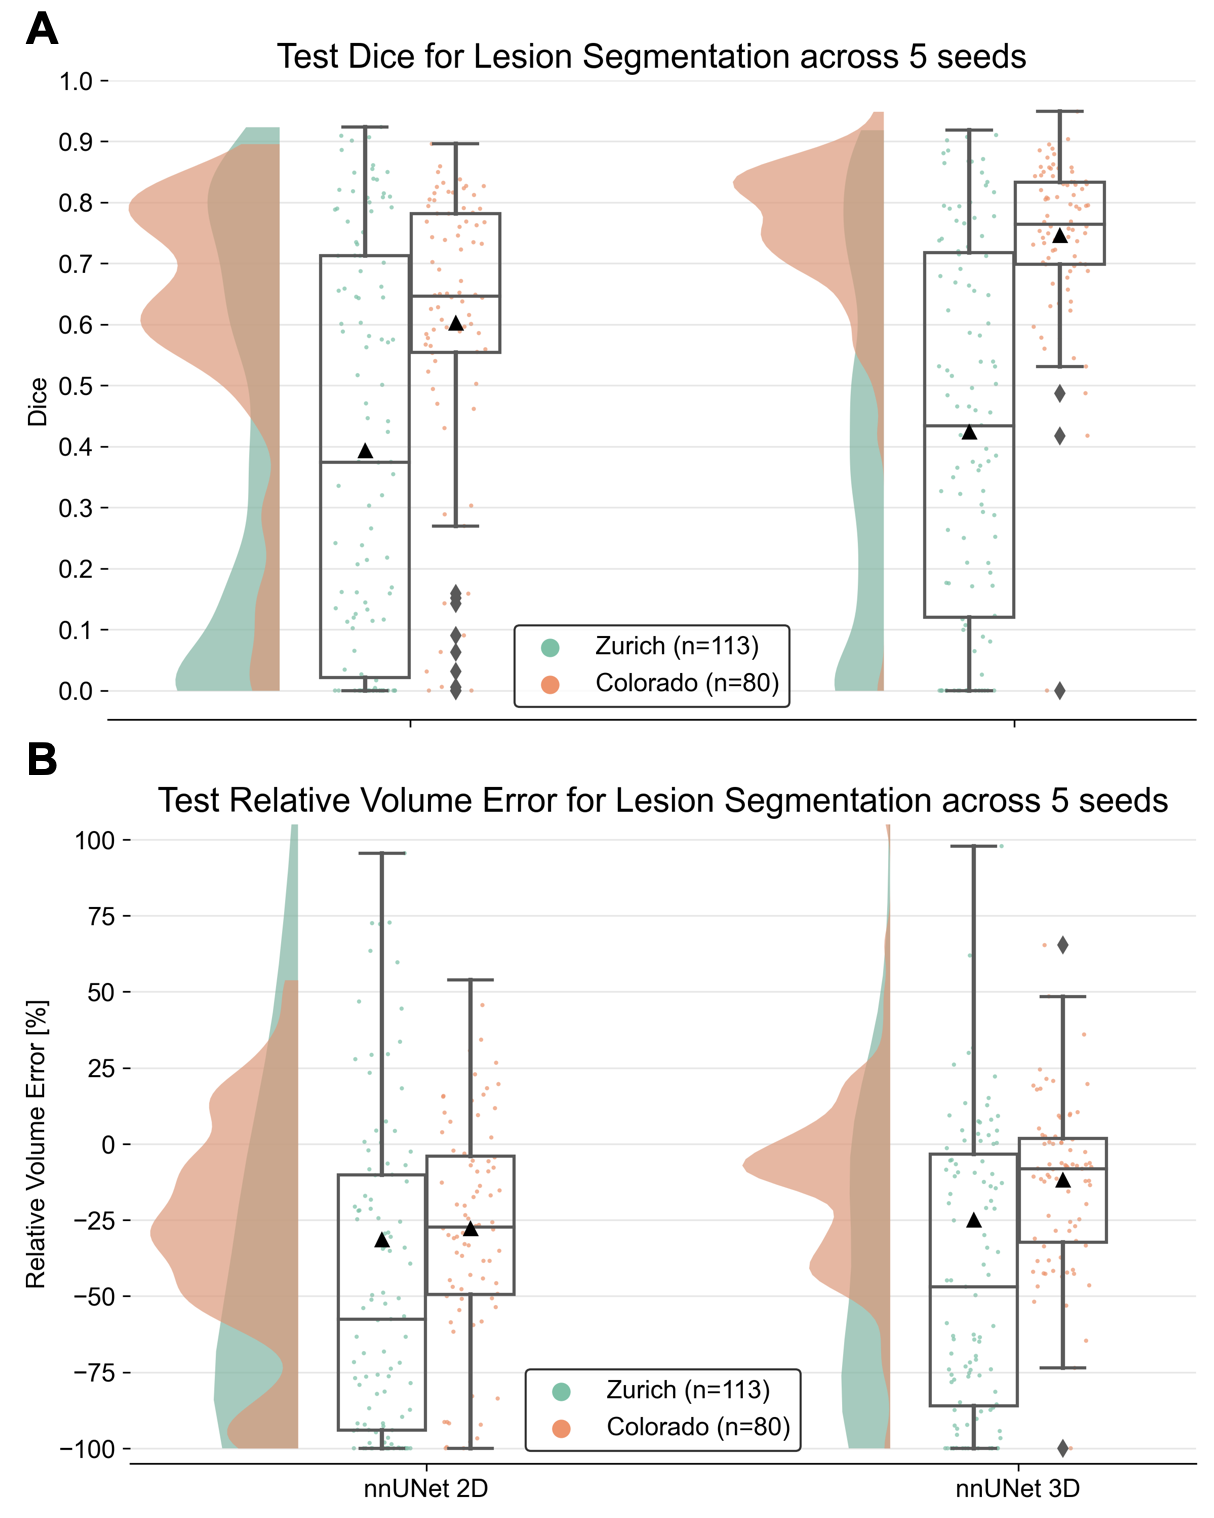
Figure 2 shows the performance of our nnUNet models for SC segmentation in terms of the Dice coefficient and Relative Volume Error compared to the baselines. We observed that nnUNet 3D achieves the best segmentation performance across all baselines (Dice Zurich: 0.89 ± 0.07, Dice Colorado: 0.93 ± 0.03) while producing consistent outputs that are not under-/over-segmented (Median Relative Volume Error ~0 %). Notably, the predictions across all five seeds were quite stable for the Colorado dataset. Note that PropSeg4 was trained only on healthy controls, hence explaining its low performance when applied to SCI data.Figure 3 compares the 2D and 3D variants of our nnUNet model for lesion segmentation. We observed that the 3D model performed better with relatively less under-segmentation across sites (Dice Zurich: 0.42 ± 0.31, Dice Colorado: 0.75 ± 0.13) than its 2D counterpart (Dice Zurich: 0.39 ± 0.33, Dice Colorado: 0.60 ± 0.23). Notably, for Colorado, the density of points in the scatter plot is also higher for the 3D model.
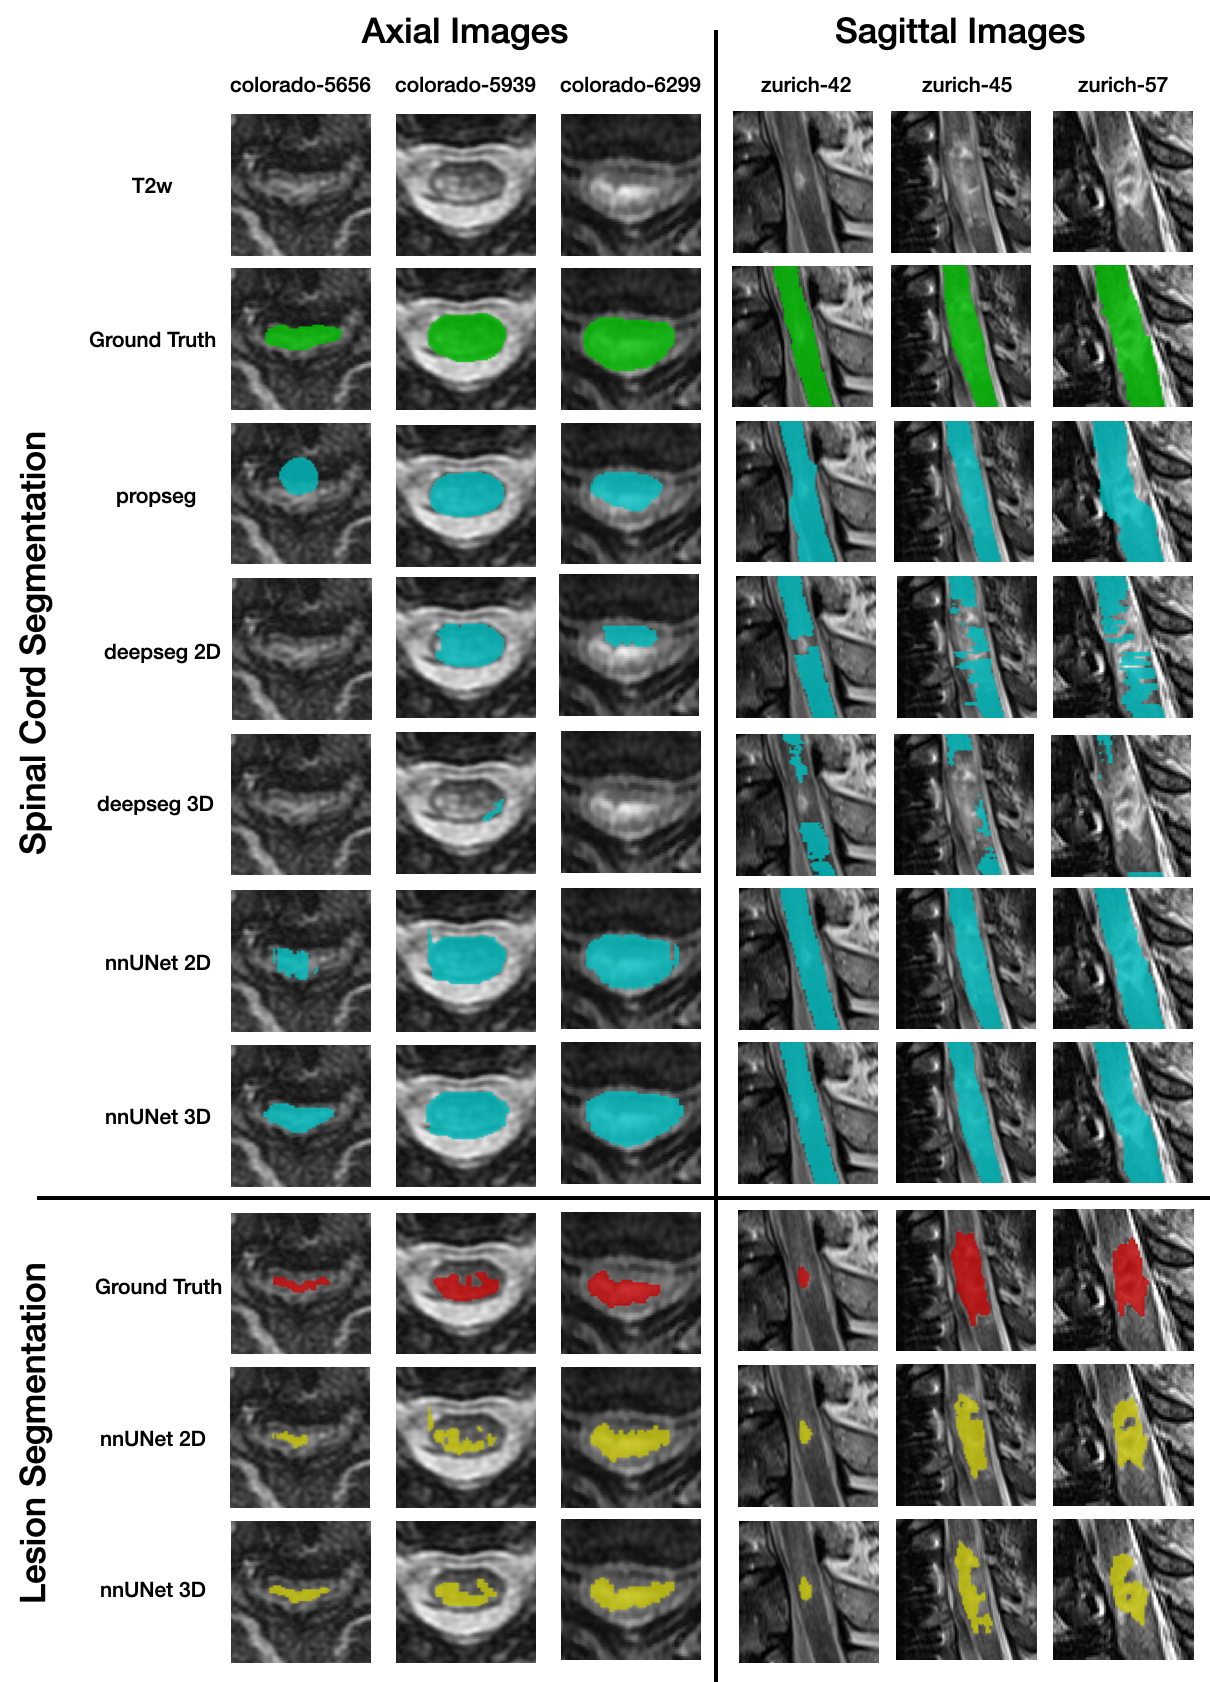
Qualitative examples of lesion and SC segmentations for both datasets are shown in Figure 4.
Discussion
For SC segmentation, the performance of DeepSeg 2D is quite similar to that of our model. However, DeepSeg 2D outputs empty predictions (i.e., no segmentation) for a few subjects in the Zurich dataset (shown by the diamond in Figure 2A) and shows a tendency to under-segment the image as seen by the negative Relative Volume Error for both sites. As for lesion segmentation, we noticed that subjects in the Zurich dataset contain image artifacts due to metal implants, which might explain the lower performance.In general, segmentation of T2-w hyperintense SCI lesions is challenging due to heavy interference from image artifacts in post-operative patients with metal implants, and high variability in lesion signal intensities due to the presence of edema or hemorrhage. Future work is directed towards training models on improved ground-truth masks, where edema and hemorrhage are treated as separate classes.
Conclusion
This study introduced an automatic method for the segmentation of the SC and T2-w hyperintense lesions in SCI patients. To our knowledge, this is the first open-source method (github.com/ivadomed/model_seg_sci) for the segmentation of SCI lesions, which can generalize across treatment strategy (surgery/no surgery), lesion etiology (traumatic/ischemic), sites, scanner manufacturers, heterogeneous image resolutions, and fields-of-view.Acknowledgements
Jan Valošek and Naga Karthik Enamundram contributed equally and share co-first authorship.
Funded by the Canada Research Chair in Quantitative Magnetic Resonance Imaging [CRC-2020-00179], the Canadian Institute of Health Research [PJT-190258], the Canada Foundation for Innovation [32454, 34824], the Fonds de Recherche du Québec - Santé [322736, 324636], the Natural Sciences and Engineering Research Council of Canada [RGPIN-2019-07244], the Canada First Research Excellence Fund (IVADO and TransMedTech), the Courtois NeuroMod project, the Quebec BioImaging Network [5886, 35450], INSPIRED (Spinal Research, UK; Wings for Life, Austria; Craig H. Neilsen Foundation, USA), Mila - Tech Transfer Funding Program. Supported by the Ministry of Health of the Czech Republic, grant nr. NU22-04-00024. All rights reserved. JV has received funding from the European Union's Horizon Europe research and innovation programme under the Marie Sktodowska-Curie grant agreement No 101107932. NKE is supported by the Fonds de Recherche du Quebec Nature et Technologies B2X Doctoral scholarship and UNIQUE Excellence Doctoral scholarship.
References
1. Dobran, M. et al. Prognostic MRI parameters in acute traumatic cervical spinal cord injury. Eur. Spine J. 32, 1584–1590 (2023).
2. Miyanji, F., Furlan, J. C., Aarabi, B., Arnold, P. M. & Fehlings, M. G. Acute cervical traumatic spinal cord injury: MR imaging findings correlated with neurologic outcome--prospective study with 100 consecutive patients. Radiology 243, 820–827 (2007).
3. Isensee, F., Jaeger, P. F., Kohl, S. A. A., Petersen, J. & Maier-Hein, K. H. nnU-Net: a self-configuring method for deep learning-based biomedical image segmentation. Nat. Methods 18, 203–211 (2021).
4. De Leener, B., Kadoury, S. & Cohen-Adad, J. Robust, accurate and fast automatic segmentation of the spinal cord. Neuroimage 98, 528–536 (2014).
5. Gros, C. et al. Automatic segmentation of the spinal cord and intramedullary multiple sclerosis lesions with convolutional neural networks. Neuroimage 184, 901–915 (2019).
Figures