0305
Spinal cord injury and the patterns of neuronal plasticityduring motor-rehabilitation training1Spinal Cord Injury Center Balgrist University Hospital, Zurich, Switzerland, 2Wellcome Centre for Human Neuroimaging, UCL Queen Square Institute of Neurology, London, United Kingdom, 3Department of Neurophysics, Max Planck Institute for Human Cognitive and Brain Sciences, Leipzig, Germany
Synopsis
Keywords: Other Neurodegeneration, Brain, Myelin plasticity; Multiparametric mapping; Magnetisation transfer; Motor learning; Quantitative MRI; Corticospinal tract; Hippocampus
Motivation: Rehabilitation following spinal cord injury is currently the only means to improve motor function. How macro-and microstructural changes in the CNS promote such recovery is understudied.
Goal(s): Investigate training-induced plasticity during motor skill training and explore associations between neuroplasticity and performance.
Approach: We compared healthy and SCI trainees and healthy non-trainees using quantitative and diffusion MRI, and associated changes in MRI parameters with performance improvement.
Results: SCI patients showed training-induced changes in cortical and subcortical areas, which were akin to those in healthy controls and were linked to specific aspects of motor skill learning.
Impact: Motor skill learning in SCI induces neuroplasticity in similar areas as seen in healthy controls. These findings open the possibility to monitor progress in neurorehabilitation.
Introduction
MRI studies have shown training-induced alterations within the grey (GM) and white matter (WM) of cortical and subcortical areas, e.g. in the visual, somatosensory, and motor cortices, as well as their interactions to each other. Cellular mechanisms underlying neuroplasticity might include oligodendrogenesis, myelination, axonal sprouting, and dendritic branching1–4. Traumatic spinal cord injury (SCI) triggers progressive degenerative changes across the central nervous system5 that impacts recovery potential6 and also presents substantial challenges for the rehabilitation of motor functions. Early rehabilitation training is currently the only effective intervention. Yet, how macro-and microstructural changes in the CNS promote such recovery is understudied7. The goal of our study is twofold: to investigate the spatiotemporal evolution of training-induced structural changes across subcortical and cortical areas integral to motor skill learning, and to explore associations between structural changes and performance improvements. To achieve this, we used whole-brain quantitative MRI (multi-parameter mapping protocol–MPM) and diffusion MRI (dMRI) in healthy controls and spinal cord injury (SCI) patients undergoing motor skill learning.Methods
In this longitudinal study, 32 healthy individuals (18-50 years) and 17 chronic SCI patients (23-69 years; post-injury >6 months, Table 1) were divided into five training groups: healthy upper limb trainees (n=9), healthy lower limb trainees (n=9), healthy no-trainees (n=14), SCI upper limb trainees (n=9), and SCI lower limb trainees (n=8). Training was performed four times a week, for four consecutive weeks. The participants' task involved matching arrow symbols on the input device to the arrows scrolling up the screen (Fig. 1)8. MRI data were collected at baseline (before the training), at training days 7, 14, and 28, and at 84-day follow-up (Fig. 1). MPM9–12 was acquired with three 3D multi-echo FLASH images with the following sequence parameters: resolution=1x1x1mm3, repetition times (TR) and flip angles (T1w=25ms/23°; PDw=25ms/4° and MTw=37ms/9°). We used hMRI toolbox13 with UNICORT correction14,15to generate maps of magnetization transfer saturation (MTsat) and longitudinal relaxation rate (R1), which are sensitive to myelin13,16, and map of effective transverse relaxation rate (R2*), which is sensitive to iron13. dMRI data were acquired using a single-shot spin-echo echo planar imaging sequence with the following parameters: resolution=2.5x2.5x2.5mm3, TR=7600ms, echo time=80ms, flip angle=90°, 60 direction with b-values=1200s/mm², 7 with b-values=0s/mm². The data underwent denoising (MRtrix317), correction for susceptibility artifacts (FSL topup18), correction for motion and eddy-current artifacts (FSL eddy18), and were co-registered to the MTsat image. The diffusion tensor model was fitted (FSL dtifit18) to generate maps of fractional anisotropy (FA), mean diffusivity (MD), axial diffusivity (AD), and radial diffusivity (RD)19,20. Statistical parametric mapping was employed to analyze longitudinal training-effects in MTsat, R1, R2*, FA, MD, AD, and RD. To assess differences between training groups, Bayesian statistics and Welch t-tests were used.Results
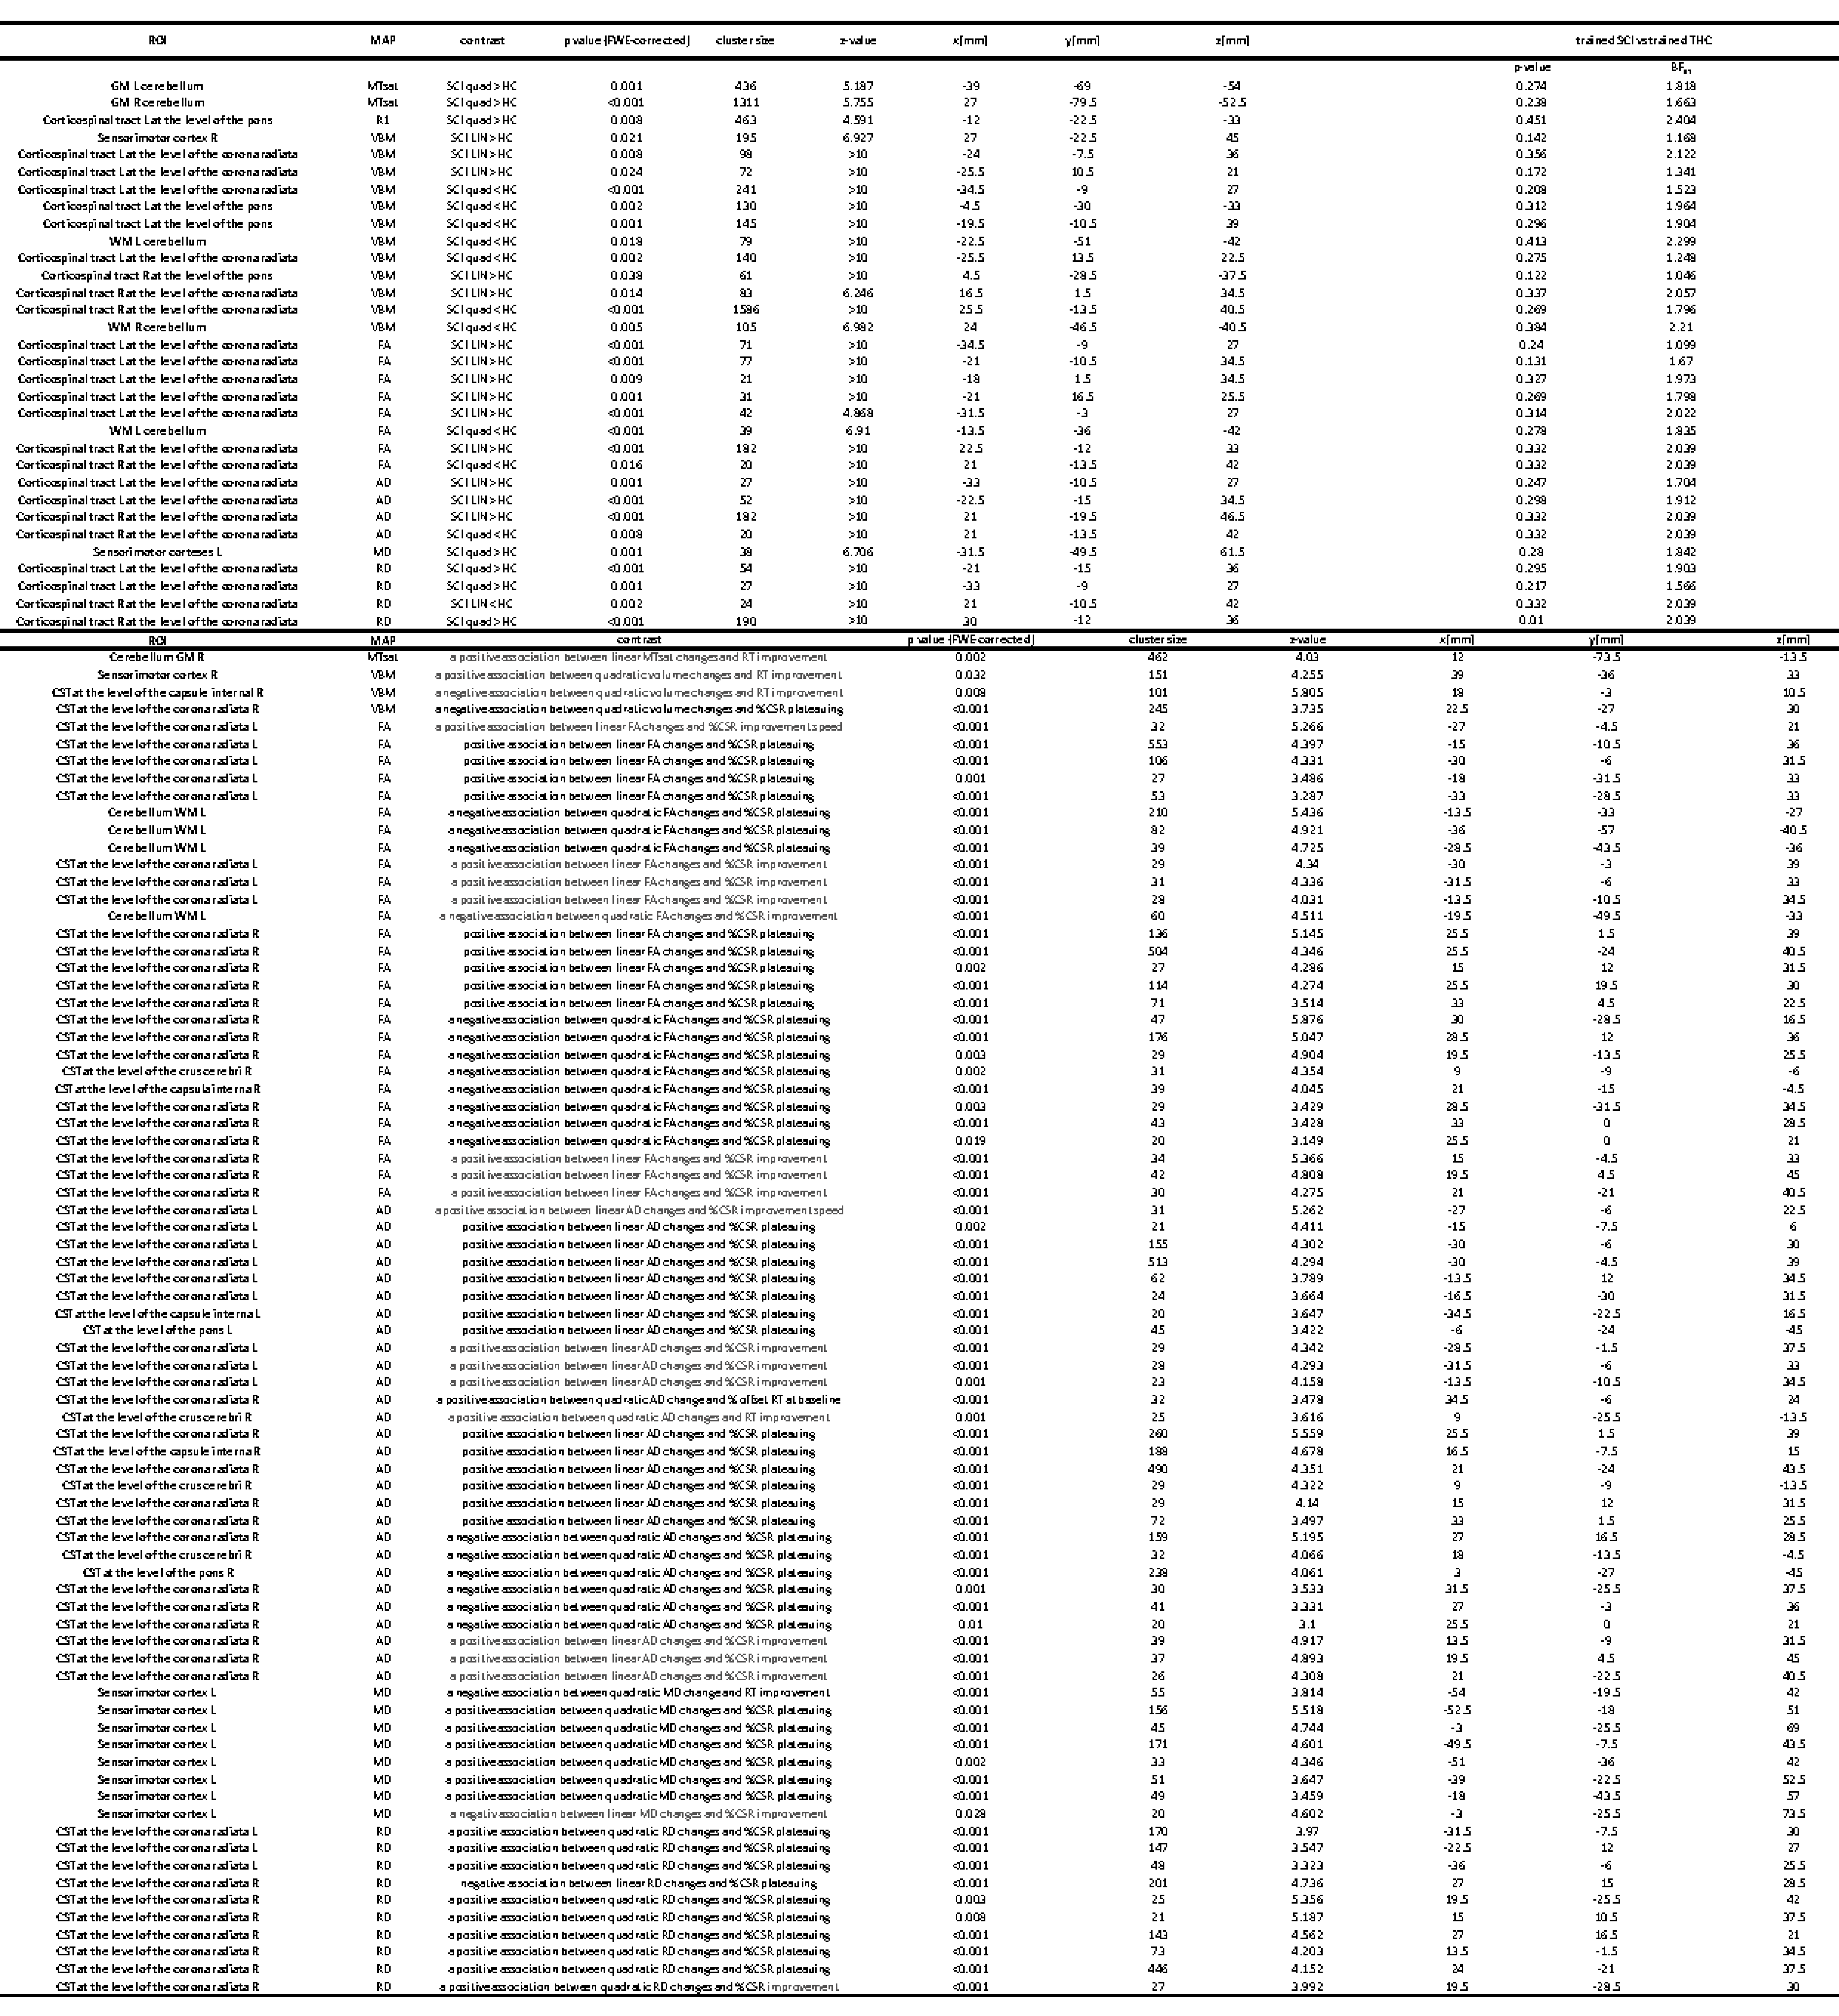
Compared to healthy non-trainees, SCI trainees showed (i) greater rate of increase in GM volume and greater rate of increase and negative quadratic changes in WM volume in the corticospinal tracts (CST) and the cerebellum, (ii) greater rate increase in MTsat and R1 in the cerebellum GM and in the left CST, respectively, (iii) greater rate of increase and greater negative quadratic changes in FA and AD and more negative rate decrease and positive quadratic changes in RD in the CST, and greater negative quadratic changes in FA in the cerebellar WM (Table 2, Fig. 2). Compared to healthy trainees, SCI trainees showed greater negative quadratic changes in RD changes in the right CST. Within these regions, we found correlations between changes in MRI metrics (GM volume, MTsat, FA, MD, AD, and RD) and performance improvement including reaction time and percentage of correct stimulus response (Table 2).Discussion
This study offers novel insights into the neuroplastic changes during motor skill learning. Among SCI trainees, we identified volumetric and microstructural changes, using dMRI and the MPM protocol, in the sensorimotor and limbic systems, with the magnitude of these changes correlating with their performance improvements. Notably, the direction and extent of these changes were in general not significantly different from those observed in healthy trainees8, with the only exception for changes in RD in the right CST. This indicates that training-induced neuroplastic changes are comparable or even more pronounced in SCI patients.Conclusion
These findings demonstrate the sensitivity of MRI techniques, including quantitative MRI and dMRI, to detect neuroplasticity underlying motor skill learning in the injured CNS following an SCI. Therefore, motor rehabilitation training could be optimized by monitoring neuronal plasticity, by means of MRI. Additionally, these insights about neuroplastic changes might guide the development of novel rehabilitation strategies.Acknowledgements
We would like to thank all participants for participation in this study. We thank Eric Reese (https://github.com/kyzentun ) for selflessly offering his time and expertise in the writing of the StepMania scripts. We also thank Dr Maryam Seif, Prof Bogdan Draganski, Dr. Chris Easthope Awai, Dr. Marc Bolliger and Prof. Armin Curt for their guidance and support in developing and carrying out this study; and thanks to Daniel R. Altmann for the statistical support.References
1. Badea, A. et al. Magnetic resonance imaging of mouse brain networks plasticity following motor learning. PLoS One 14, 1–21 (2019).
2. Lamprecht, R. & LeDoux, J. Structural plasticity and memory. Nat. Rev. Neurosci. 5, 45–54 (2004).
3. Theodosis, D. T., Poulain, D. A. & Oliet, S. H. R. R. Activity-dependent structural and functional plasticity of astrocyte-neuron interactions. Physiol. Rev. 88, 983–1008 (2008).
4. Gibson, E. M. et al. Neuronal Activity Promotes Oligodendrogenesis and Adaptive Myelination in the Mammalian Brain. Science (80-. ). 344, 1252304–1252304 (2014).
5. Freund, P. et al. MRI in traumatic spinal cord injury: from clinical assessment to neuroimaging biomarkers. Lancet Neurol. 18, 1123–1135 (2019).
6. Ziegler, G. et al. Progressive neurodegeneration following spinal cord injury: Implications for clinical trials. Neurology 90, e1257–e1266 (2018).
7. Villiger, M. et al. Relationship between structural brainstem and brain plasticity and lower-limb training in spinal cord injury: a longitudinal pilot study. Front. Hum. Neurosci. 9, 1–10 (2015).
8. Azzarito, M. et al. Coherent, time-shifted patterns of microstructural plasticity during motor-skill learning. Neuroimage 274, 120128 (2023).
9. Helms, G. & Dechent, P. Increased SNR and reduced distortions by averaging multiple gradient echo signals in 3D FLASH imaging of the human brain at 3T. J.Magn Reson. 29, 198–204 (2009).
10. Leutritz, T. et al. Multiparameter mapping of relaxation (R1, R2*), proton density and magnetization transfer saturation at 3 T: A multicenter dual-vendor reproducibility and repeatability study. Hum. Brain Mapp. 41, 4232–4247 (2020).
11. Seif, M. et al. Reliability of multi-parameter mapping (MPM) in the cervical cord: A multi-center multi-vendor quantitative MRI study. Neuroimage 264, 119751 (2022).
12. Weiskopf, N. et al. Quantitative multi-parameter mapping of R1, PD(*), MT, and R2(*) at 3T: a multi-center validation. Front. Neurosci. 7, 1–11 (2013).
13. Weiskopf, N., Edwards, L. J., Helms, G., Mohammadi, S. & Kirilina, E. Quantitative magnetic resonance imaging of brain anatomy and in vivo histology. Nat. Rev. Phys. 3, 570–588 (2021).
14. Emmenegger, T. M. et al. The Influence of Radio-Frequency Transmit Field Inhomogeneities on the Accuracy of G-ratio Weighted Imaging. Front. Neurosci. 15, 1–17 (2021).
15. Weiskopf, N. et al. Unified segmentation based correction of R1 brain maps for RF transmit fi eld inhomogeneities (UNICORT). Neuroimage 54, 2116–2124 (2011).
16. Georgiadis, M. et al. Nanostructure-specific X-ray tomography reveals myelin levels, integrity and axon orientations in mouse and human nervous tissue. Nat. Commun. 12, 2941 (2021).
17. MRtrix3. No Title.
18. Jenkinson, M., Beckmann, C. F., Behrens, T. E. J., Woolrich, M. W. & Smith, S. M. FSL. Neuroimage 62, 782–790 (2012).
19. Sampaio-Baptista, C. & Johansen-Berg, H. White Matter Plasticity in the Adult Brain. Neuron 96, 1239–1251 (2017).
20. Zatorre, R. J., Fields, R. D. & Johansen-Berg, H. Plasticity in gray and white: neuroimaging changes in brain structure during learning. Nat. Neurosci. 15, 528–36 (2012).
Figures
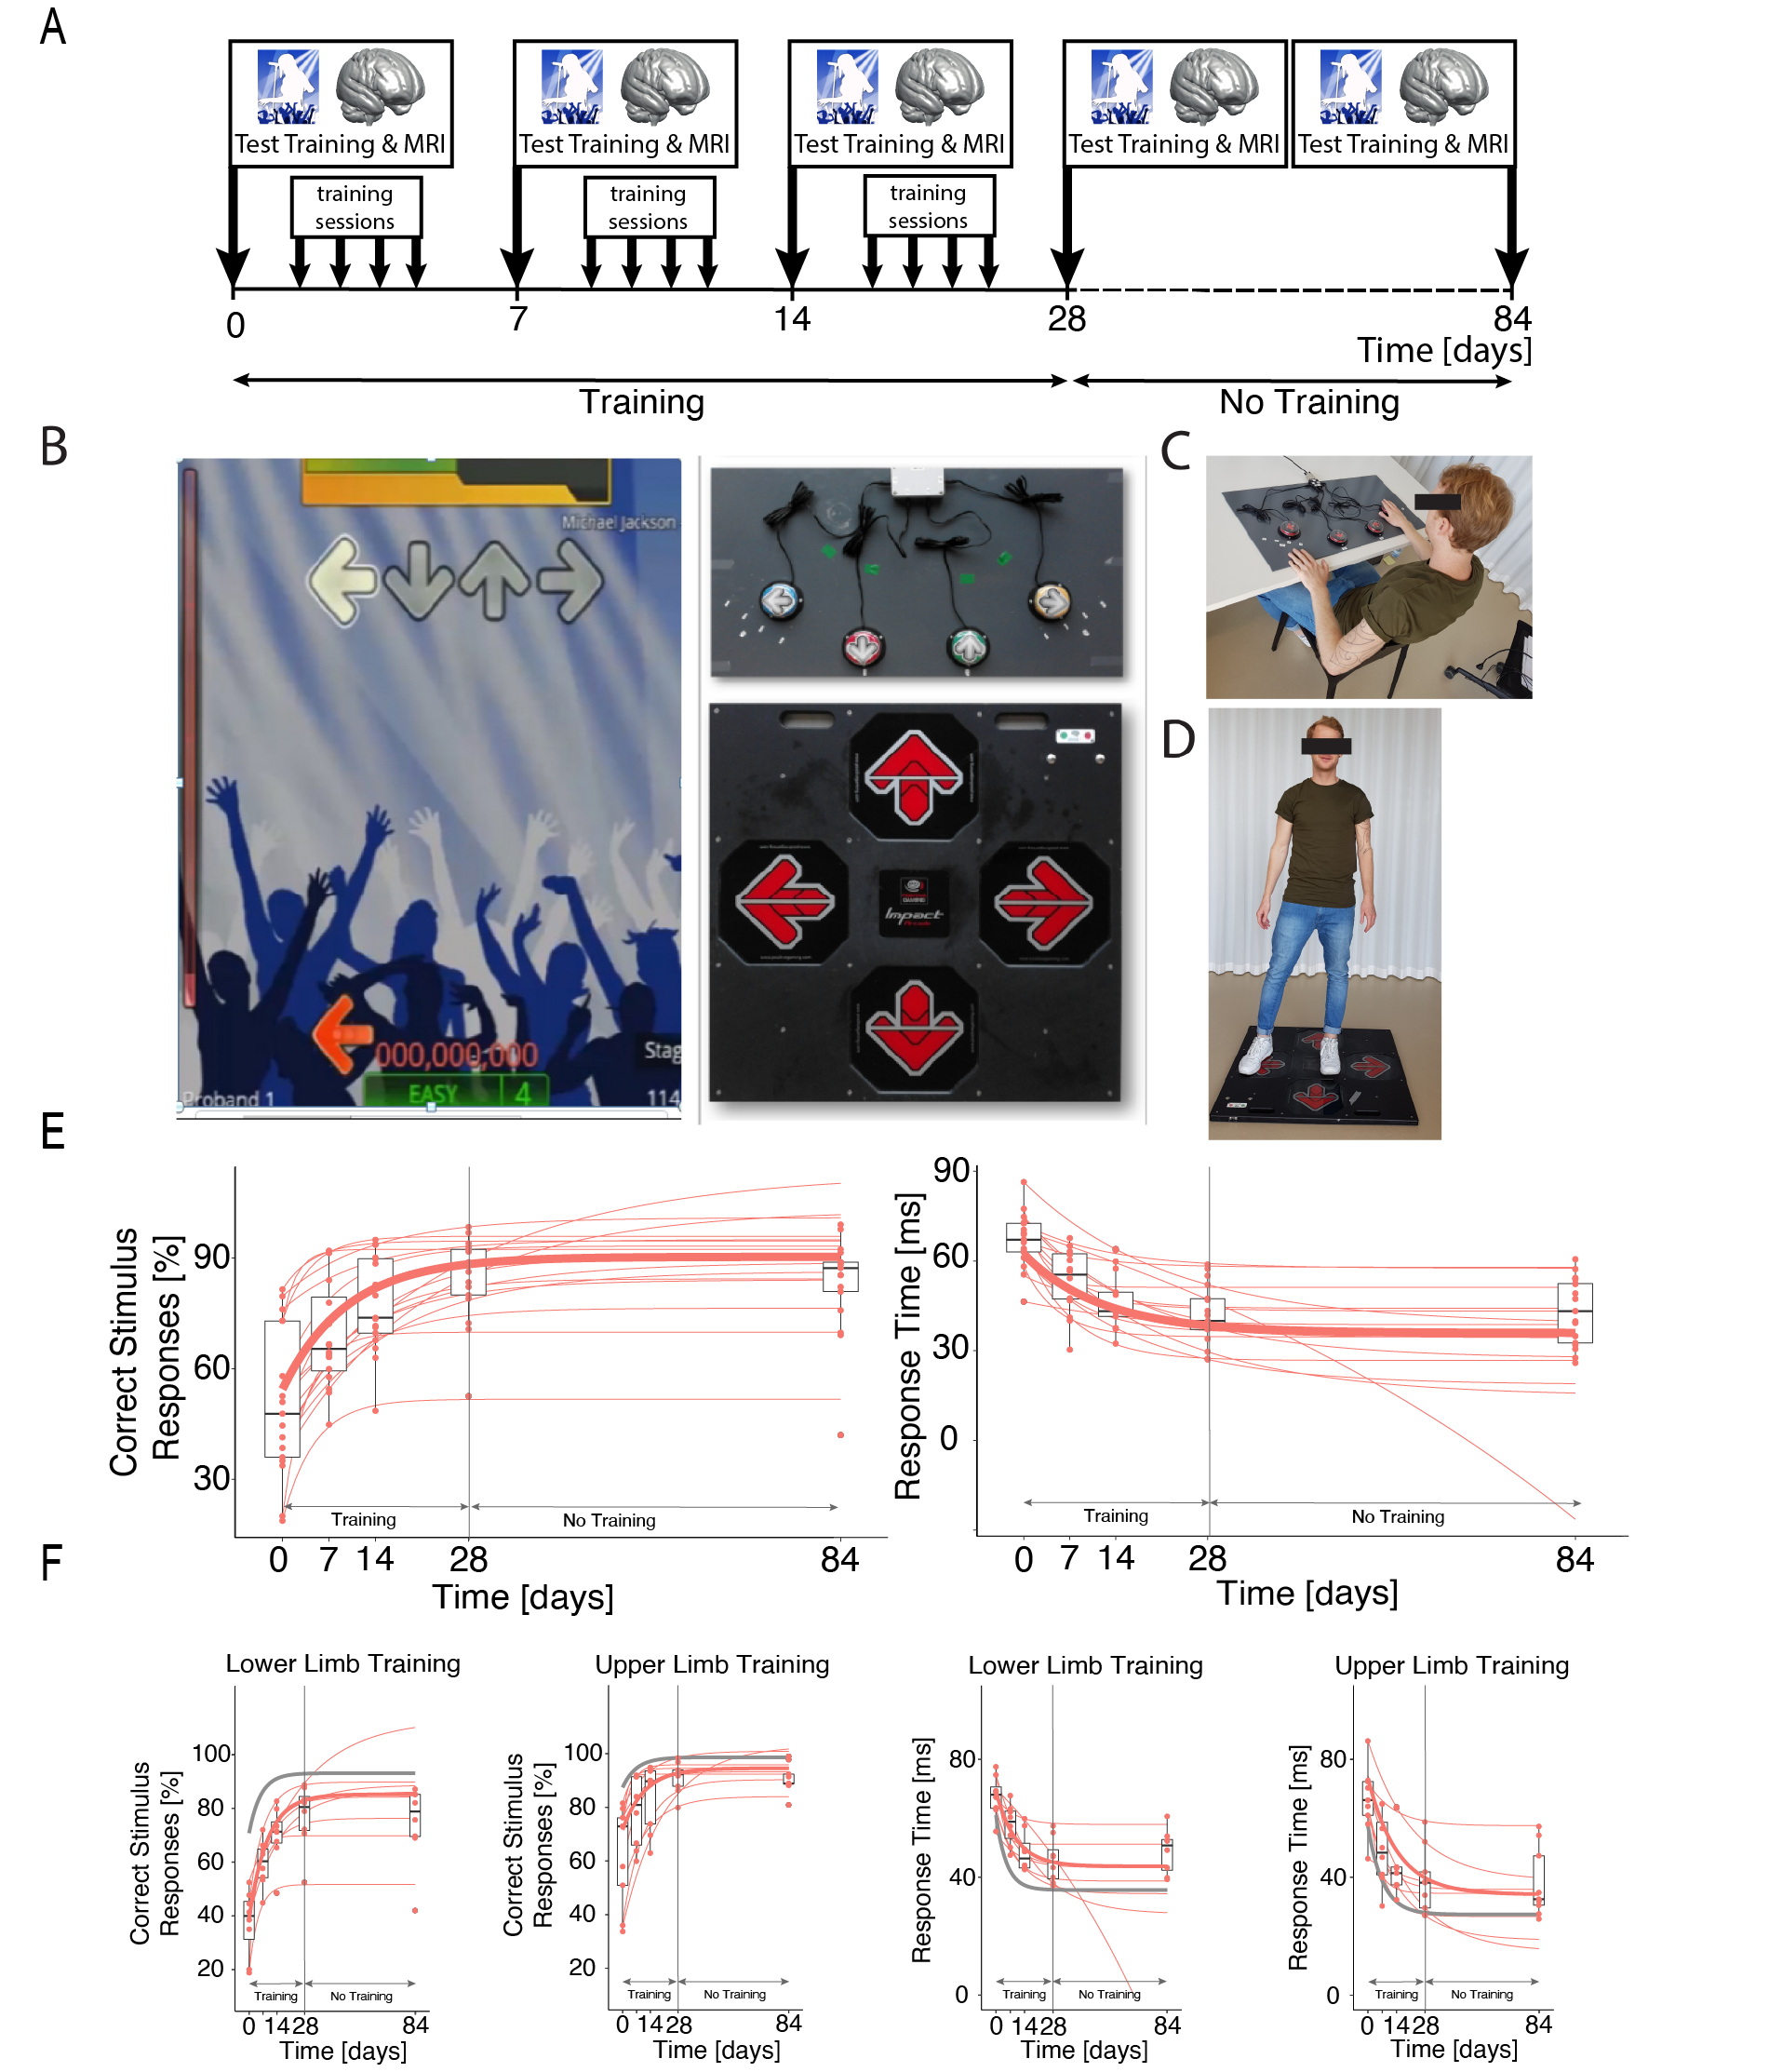
Fig.1: (A) MRI and training assessments were conducted before, during and after training. (B) 60 minutes of training four times weekly for one month. Spinal cord injured trainees (SCI) activated inputs with hands (C) or feet (D) in response to rhythmic stimuli. The task involved selecting the correct symbol when the scrolling arrow overlapped with the arrows. (E&F) Weekly behavioural improvement measurements. Participant-specific curves (thin lines) along with the group median (thick line) are shown for SCI (red). Trained healthy control values (grey) are reported previously8.
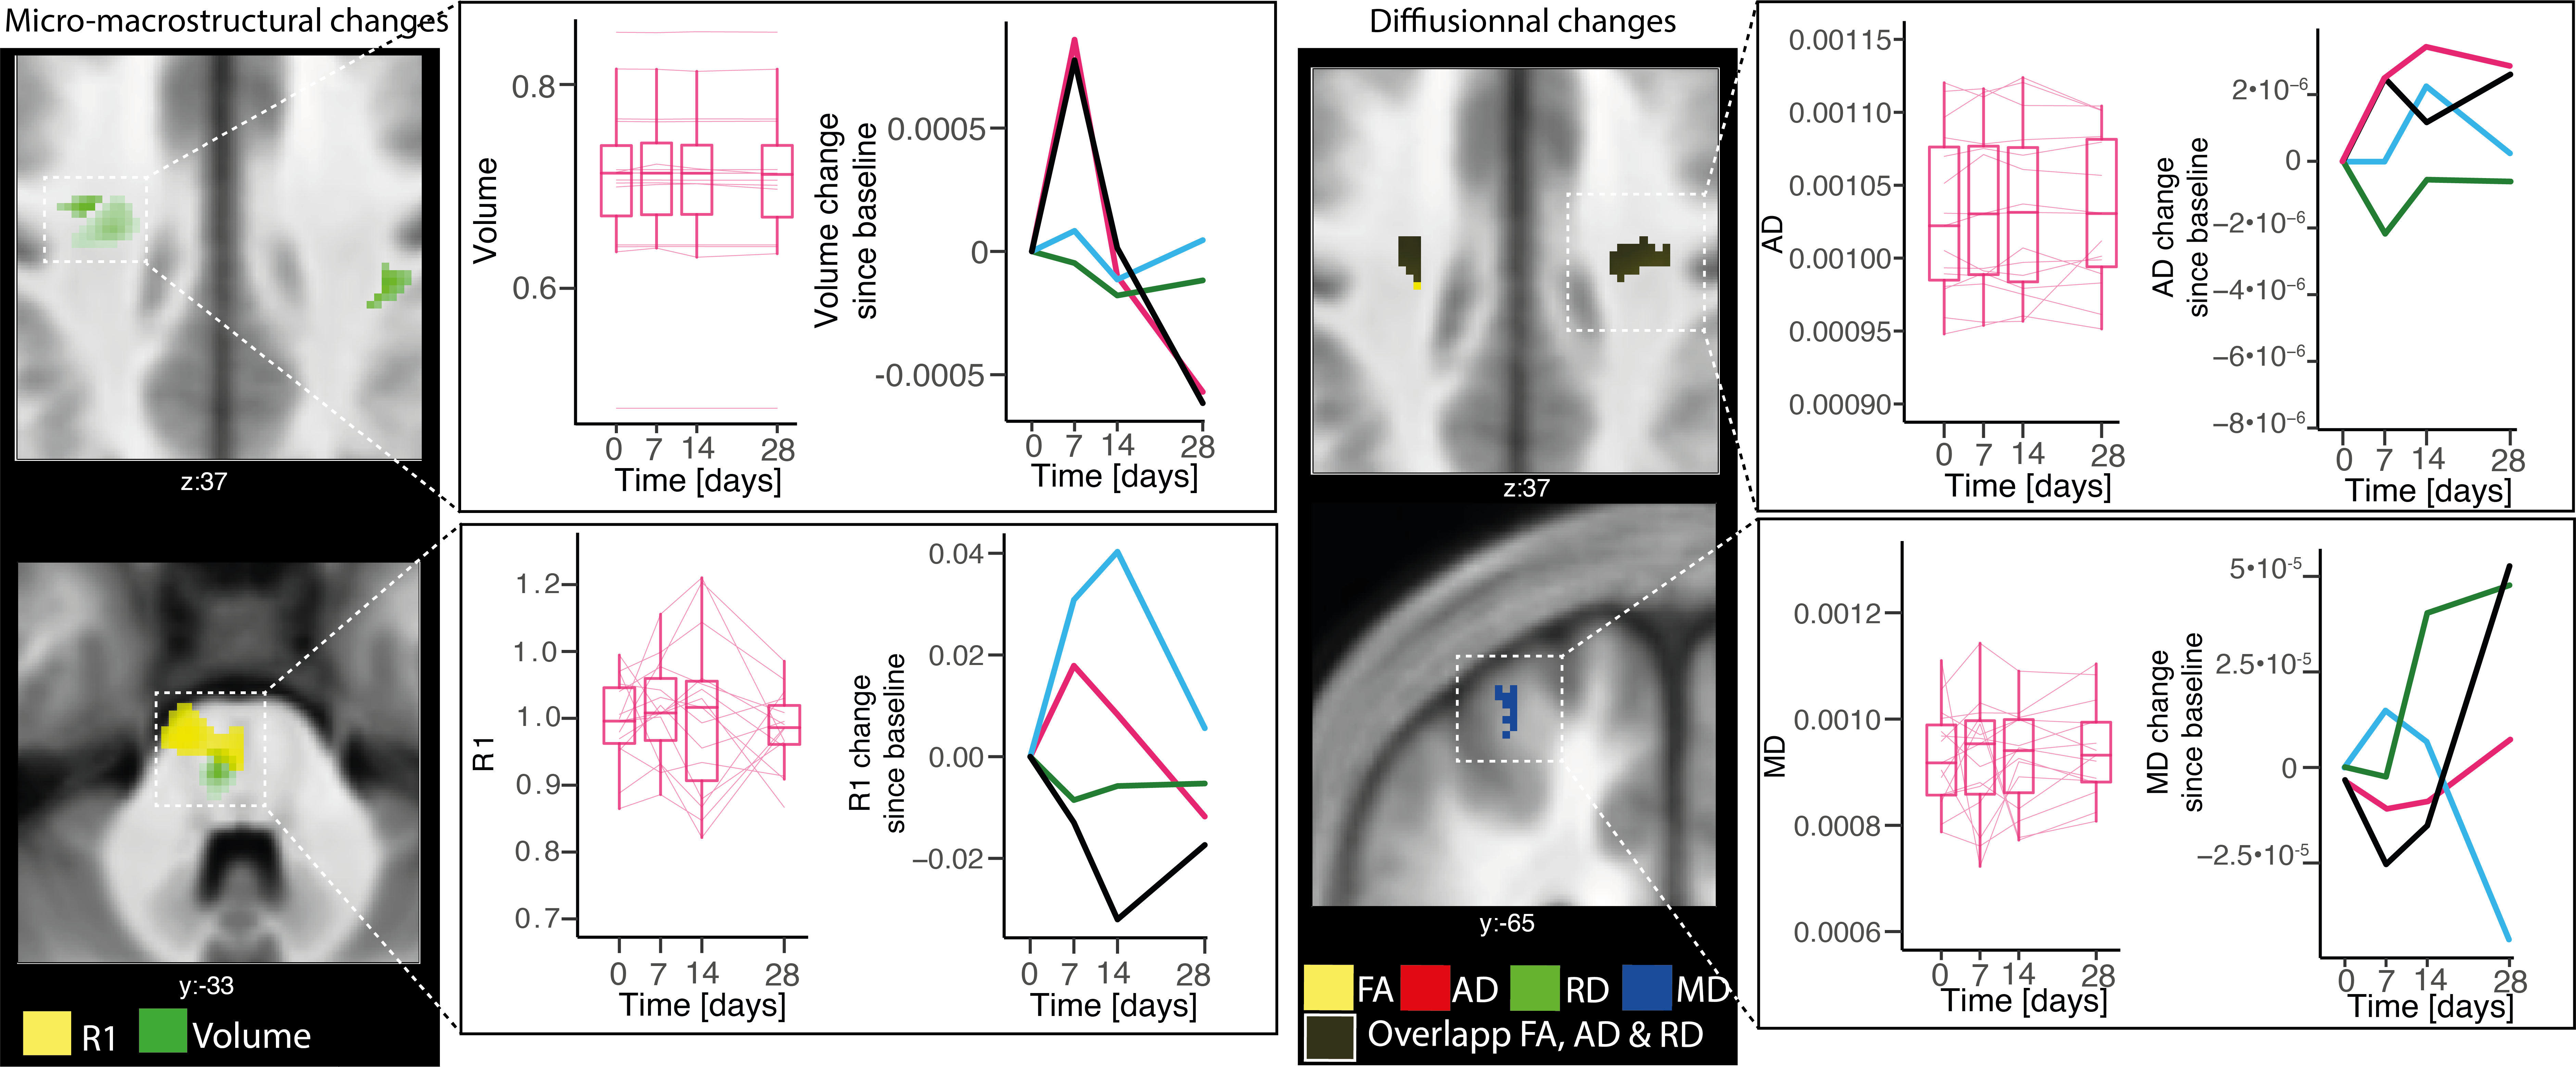
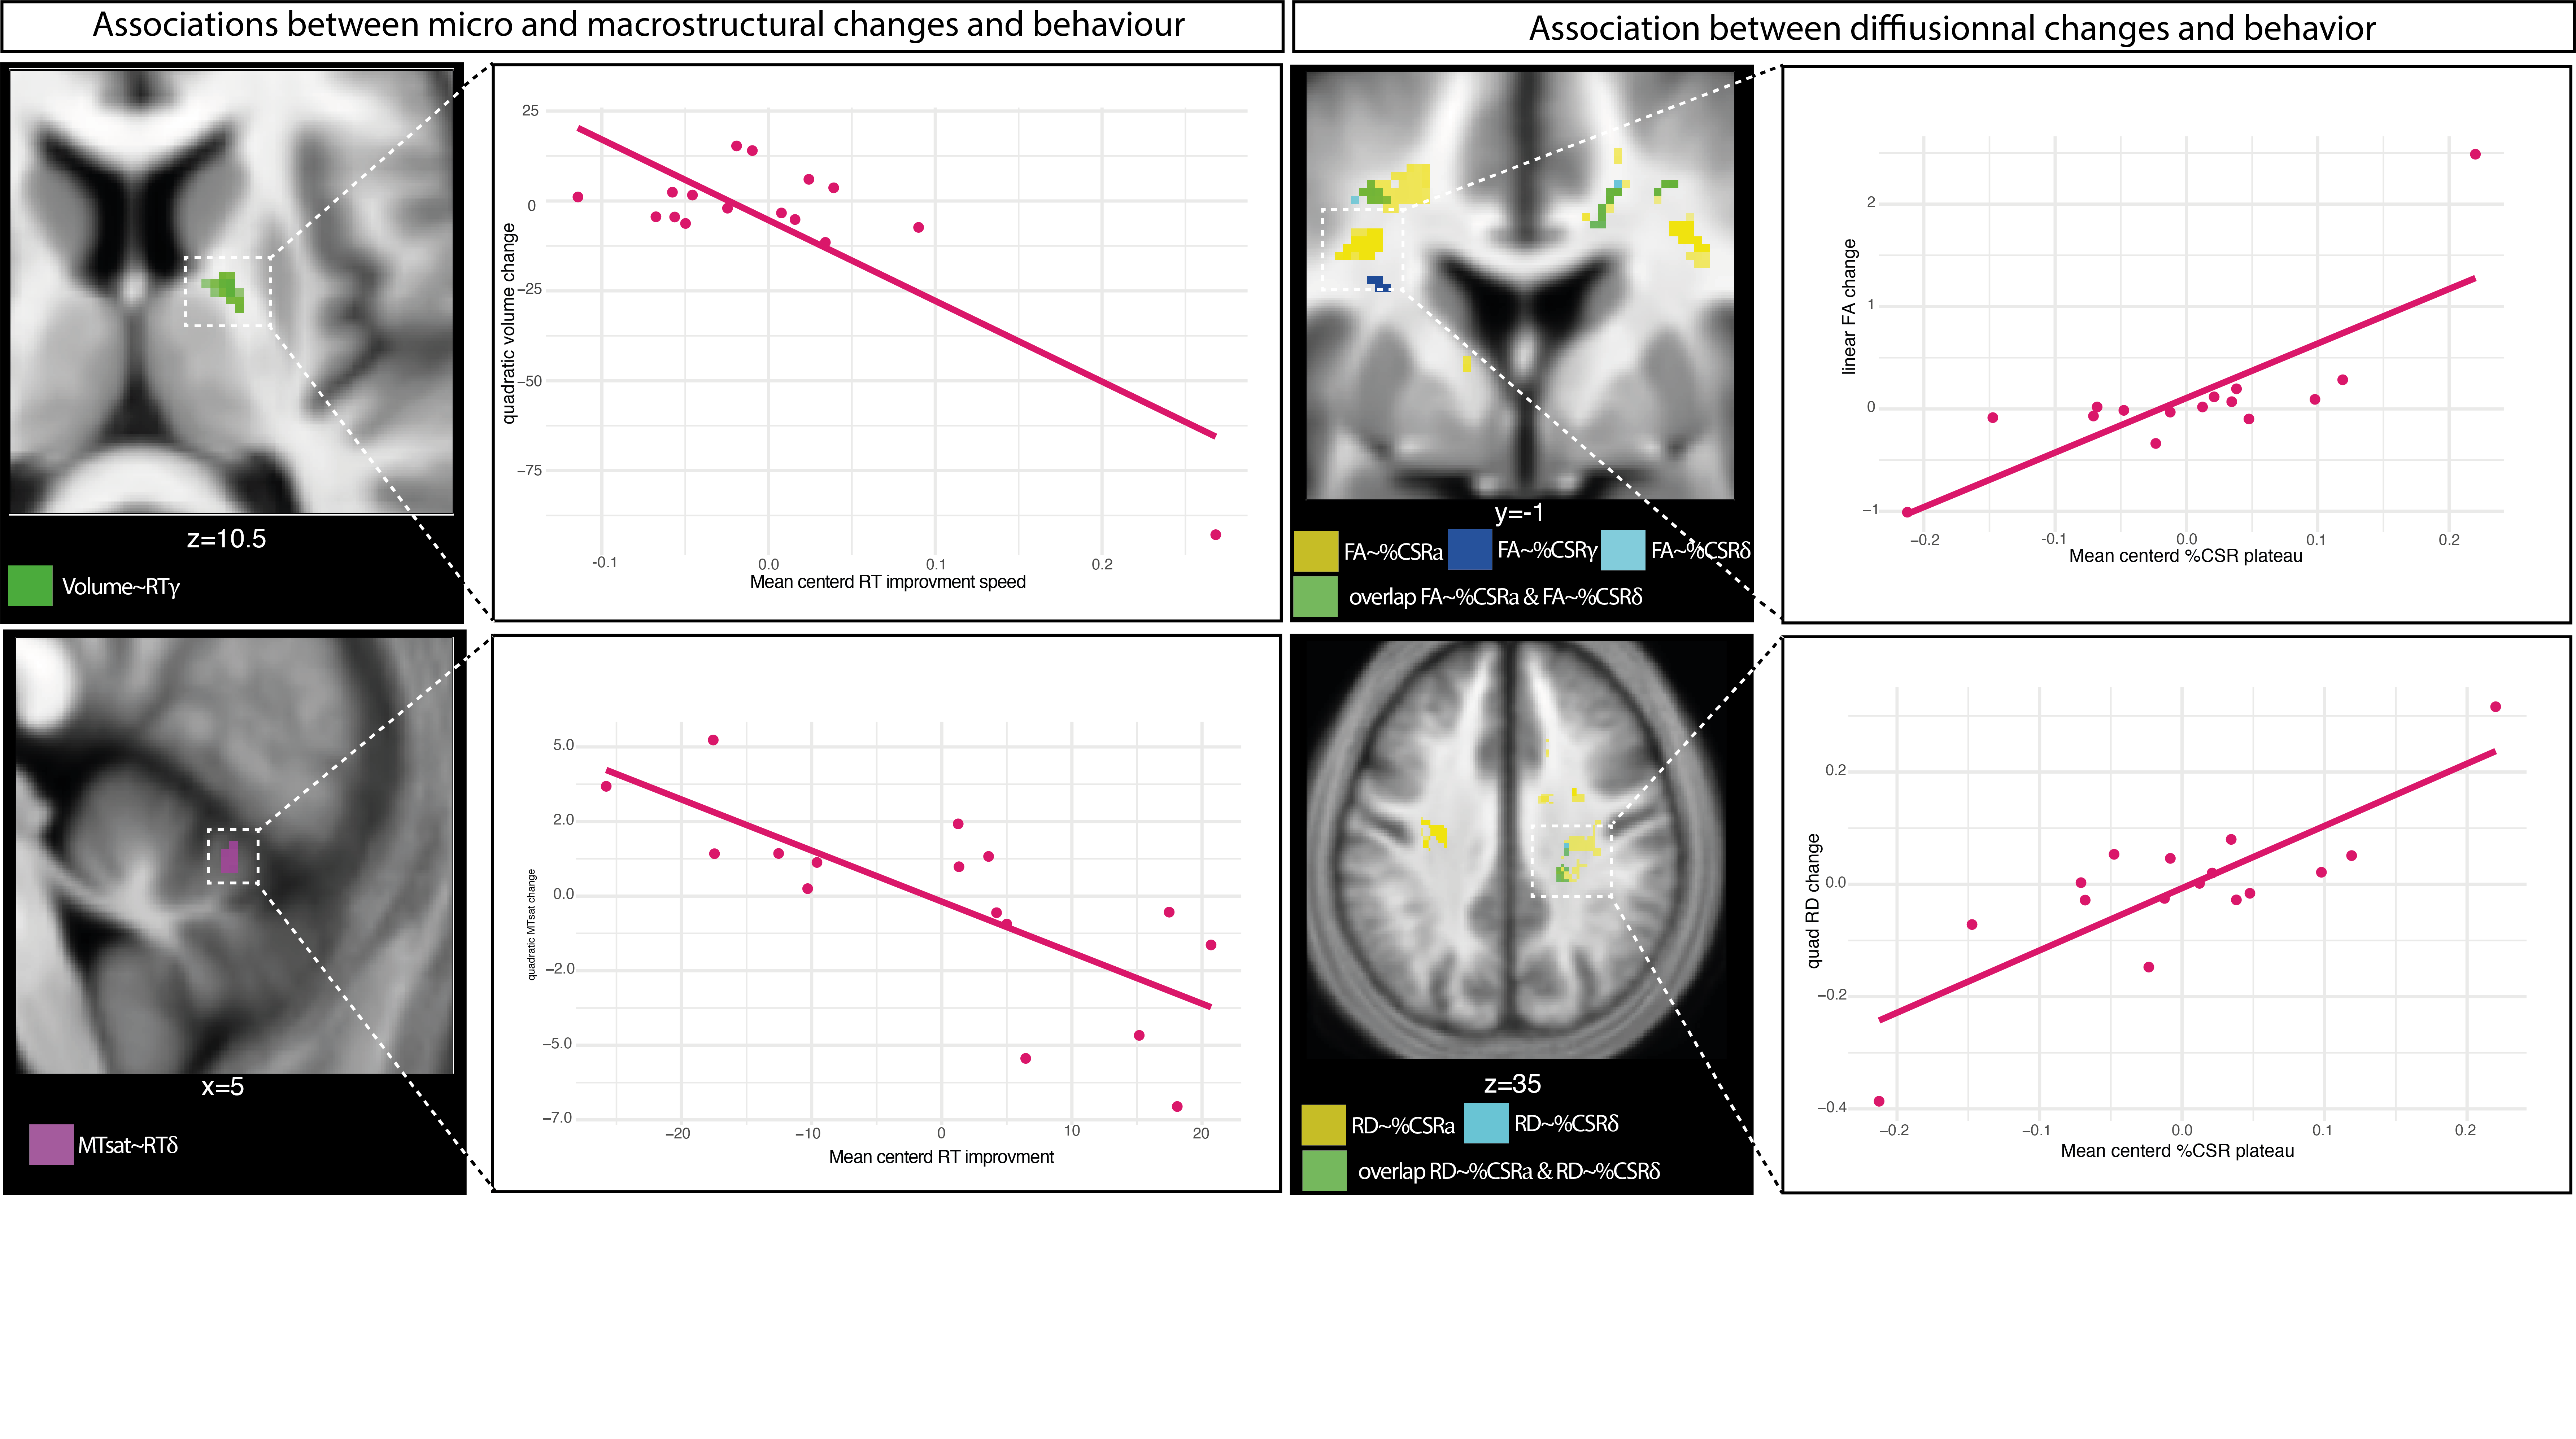
Fig.3: Associations between micro- and macrostructural changes (left column: MTsat = magnetization transfer saturation and volume) or diffusion parameters (right column: FA = fractional anisotropy, and RD = radial diffusivity) and behavioral parameters (response time = RT, and percentage of correct stimulus responses = %CSR); =improvement; =plateau; =improvement speed.
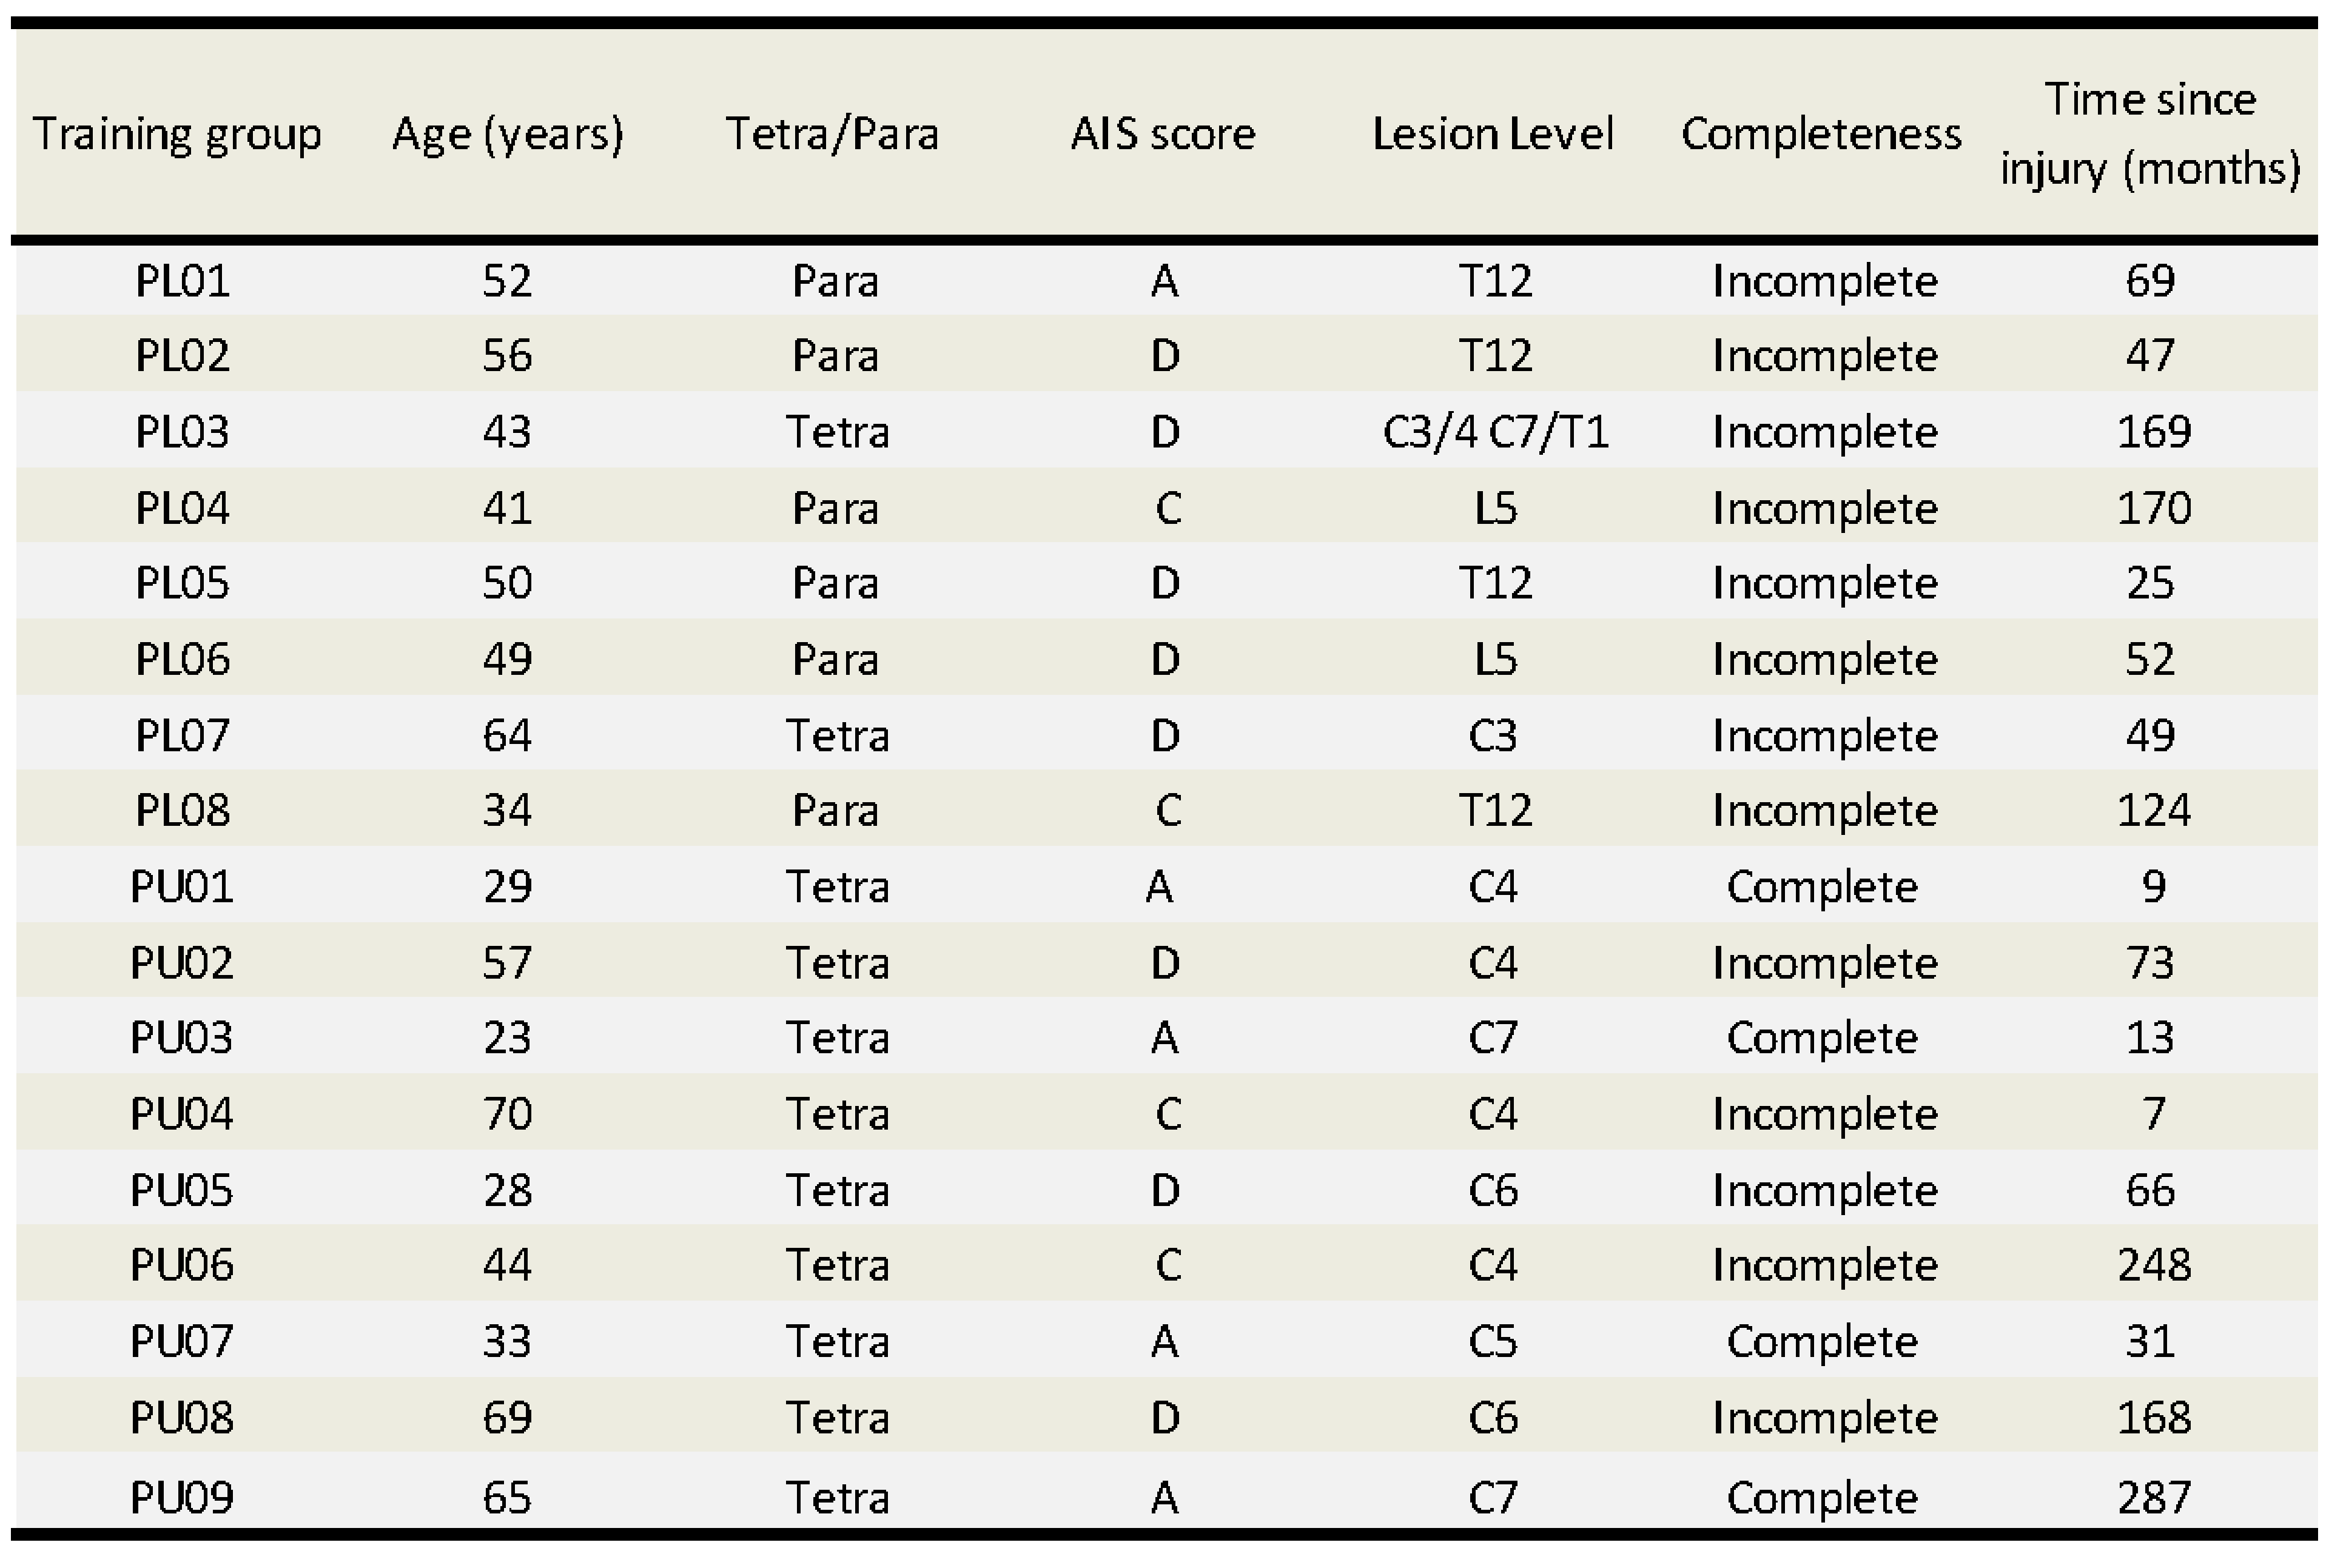
Table 1: Characterisation of the SCI patients in terms of training group age, sex, AIS score, lesion level, completeness of injury and time since injury.