0304
Quantifying changes of axonal shape in traumatic brain injury with time-dependent diffusion1Bernard and Irene Schwartz Center for Biomedical Imaging, Department of Radiology, New York University Grossman School of Medicine, New York, NY, United States, 2Center for Advanced Imaging Innovation and Research, New York University Grossman School of Medicine, New York, NY, United States, 3Department of Radiology, Harvard Medical School, Boston, MA, United States, 4A.I. Virtanen Institute for Molecular Sciences, University of Eastern Finland, Kuopio, Finland
Synopsis
Keywords: Microstructure, Modelling, Axons, Diffusion, Validation, TBI, Segmentation, Electron microscopy
Motivation: Interpreting diffusion MRI (dMRI) in terms of brain tissue micro-geometry.
Goal(s): To identify cellular features that govern diffusion measurements among myriads of parameters specifying tissue microstructure.
Approach: We found how axonal micro-geometry is manifested in a dMRI measurement by analytically solving the diffusion equation in a tube with a randomly varying cross-section.
Results: We identify a specific power-law approach of the time-dependent diffusion coefficient along the axon to its long-time limit. The average inverse cross-section and the variance of long-range cross-sectional fluctuations govern the diffusive dynamics. We quantify changes in these non-trivial geometrical features, associated with axonal beading, in a rat TBI model.
Impact: Beading is a characteristic feature of numerous neurodegenerative diseases triggered by different pathological conditions and injuries. Here, we detect geometrical changes in the axonal micro-geometry, accessible via the along-tract diffusivity from the diffusion tensor using clinically feasible diffusion weightings.
INTRODUCTION
Tissue microgeometry is fully specified by a myriad of parameters. Most of them change in disease. The purpose of biophysical modeling1-6 is to identify the most relevant tissue degrees of freedom that affect the MRI measurement the most. If faithfully performed, such simplification helps interpret and quantify disease progression in the most parsimonious and meaningful way. Here, we fulfill this program for intra-axonal diffusion in chronic traumatic brain injury (TBI). Specifically, we analytically connect axonal microgeometry to the time-dependent along-tract diffusivity$$D(t)\simeq D_\infty+\frac{c_D}{\sqrt{t}},\quad(1)$$
accessible with dMRI in clinically feasible settings, and interpret changes of $$$D_\infty$$$ and $$$c_D$$$ in terms of axon micro-geometry from serial block-face scanning EM (SBEM) in rats.
METHODS
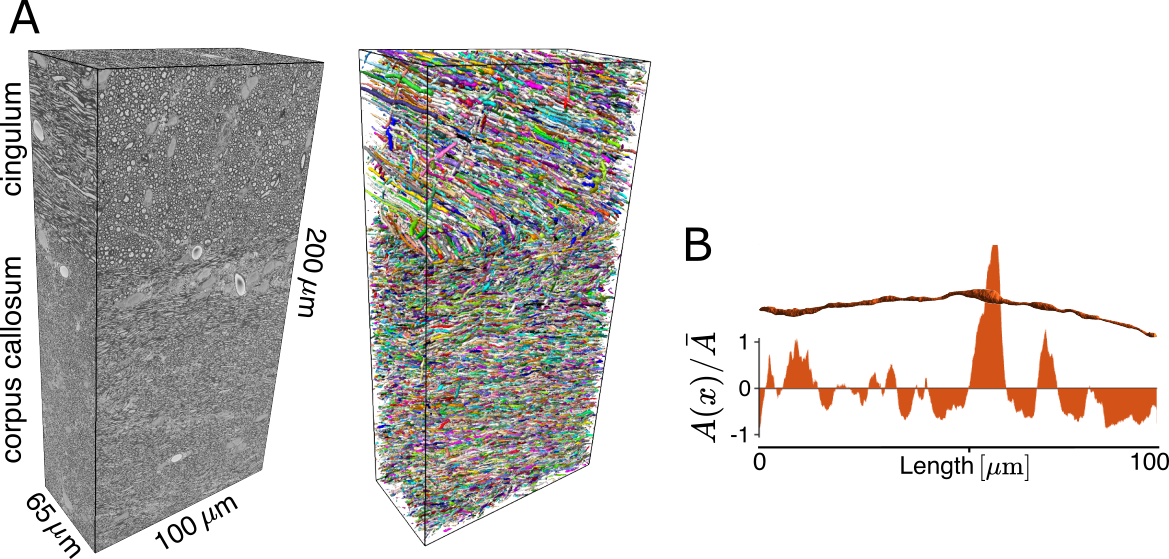
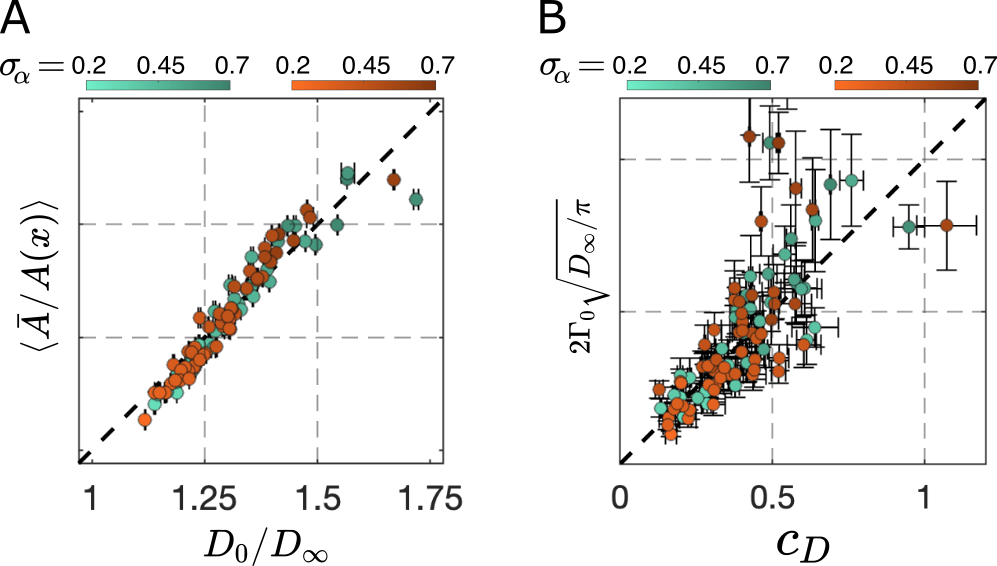
Datasets: Samples from the ipsilateral cingulum and corpus callosum (200x100x65 µm3) of five adult rats, two sham-operated and three with TBI, were imaged using serial block-face scanning EM (SBEM) with 50x50x50 nm3 voxel-size. We used the DeepACSON pipeline7-8 for segmenting all myelinated axons in these datasets (Fig.1A). We quantified each axon for its cross-sectional area $$$A(x)$$$ along the length (Fig.1B). Monte Carlo (MC) simulations of diffusion9 were run with 200,000 random walkers per axon for $$$t\leq 500$$$ ms.Exact tortuosity limit: At diffusion times $$$t\gg A/D_0$$$, coarse-graining in each cross-section turns a 3-dimensional (3d) diffusion equation into the Fick-Jacobs (FJ) equation describing 1d particle density $$$\psi(t,x)$$$, obeying the conservation law $$$\partial_t \psi(t,x)=-\partial_x J(x)$$$, where the particle flux is $$$J(x)=-D_0 A(x)\partial_x \psi(x)/A(x)$$$. At $$$t\to\infty$$$, full coarse-graining has occurred, and $$$J(x)=\text{const}$$$ in each cross-section. From this condition, splitting the axon into short segments, we derive an exact tortuosity limit,
$$\frac{D_0}{D_\infty}=\left<\frac {\bar{A}}{A(x)}\right>,\quad(2)$$
where $$$\langle\cdots\rangle$$$ stands for averaging over cross-sections.
Time-dependent approach of $$$D(t) \to D_\infty$$$: The FJ equation $$$\partial_t \psi(t,x)=D_0 \partial^2_x \psi(t,x) - D_0 \partial_x \left[y(x) \psi(t,x) \right]$$$ can be written in terms of the stochastic shape function $$$y(x)= \partial_x \ln \alpha(x)$$$, where $$$\alpha(x)=\frac{A(x)}{\bar{A}}$$$. We find the Green's function of the FJ equation in the effective medium form10-11 $$$G_{\omega, q} = \frac{1}{-i\omega+D_0 q^2-\sum(\omega,q)}$$$, where the self-energy part $$$\sum(\omega,q)$$$ becomes asymptotically exact when most of the axon shape coarse-graining has occurred. Expanding $$$\sum(\omega,q)$$$ up to $$$q^2$$$ provides the dispersive contribution to the overall diffusivity in Eq.1, where
$$c_D=2\Gamma_0 \sqrt{D_\infty / \pi},\quad(3)$$
and $$$\Gamma_0=\Gamma_\alpha (k) |_{k \to 0}$$$ where $$$\Gamma_\alpha (k)=\alpha(-k)\alpha(k)/L$$$ is power spectral density of the relative cross-section variation $$$\alpha(x)$$$ in an axon of length $$$L$$$. Hence, variance $$$\Gamma_0$$$ of long-range cross-section fluctuations governs how fast $$$D(t) \to D_\infty$$$.
Geometrical interpretation of $$$\Gamma_0$$$: Varying cross-section can be represented as a convolution of bead-shape $$$A_1(x)$$$ and bead positions, $$$A(x)=A_0+\sum_{m=1}^N A_1 (x-x_m)$$$, where $$$A_0$$$ is minimal cross-section. This yields
$$\Gamma_0 = \dfrac{\sigma^2}{\bar{a}}\left(\frac{v_1}{A_0\bar{a}+v_1} \right)^2,\quad(4)$$
where $$$v_1=\int \text{d}x A_1(x)$$$ is the bead volume.
RESULTS
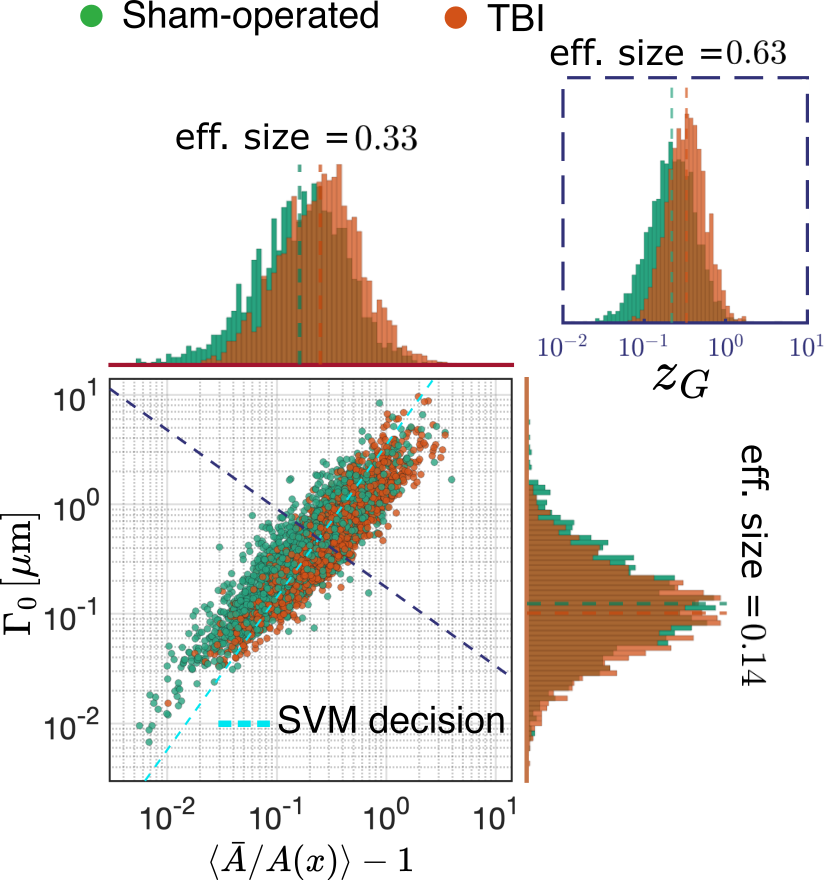
Theory validation: In Fig. 2A-B, we validated Eq.2-3 via MC simulations in axons from SBEM.Relevant micro-geometry: We investigated the impact of chronic TBI on tortuosity $$$\left<\frac{1}{\alpha(x)}\right>-1$$$ and $$$\Gamma_0$$$ in Fig. 3, where both parameters increase in TBI.
The validated theory Eqs.1-3 allows us to predict $$$D(t)$$$ instantly for ~36,000 axons without running any simulations, which could consume a year of GPU-powered MC simulations.
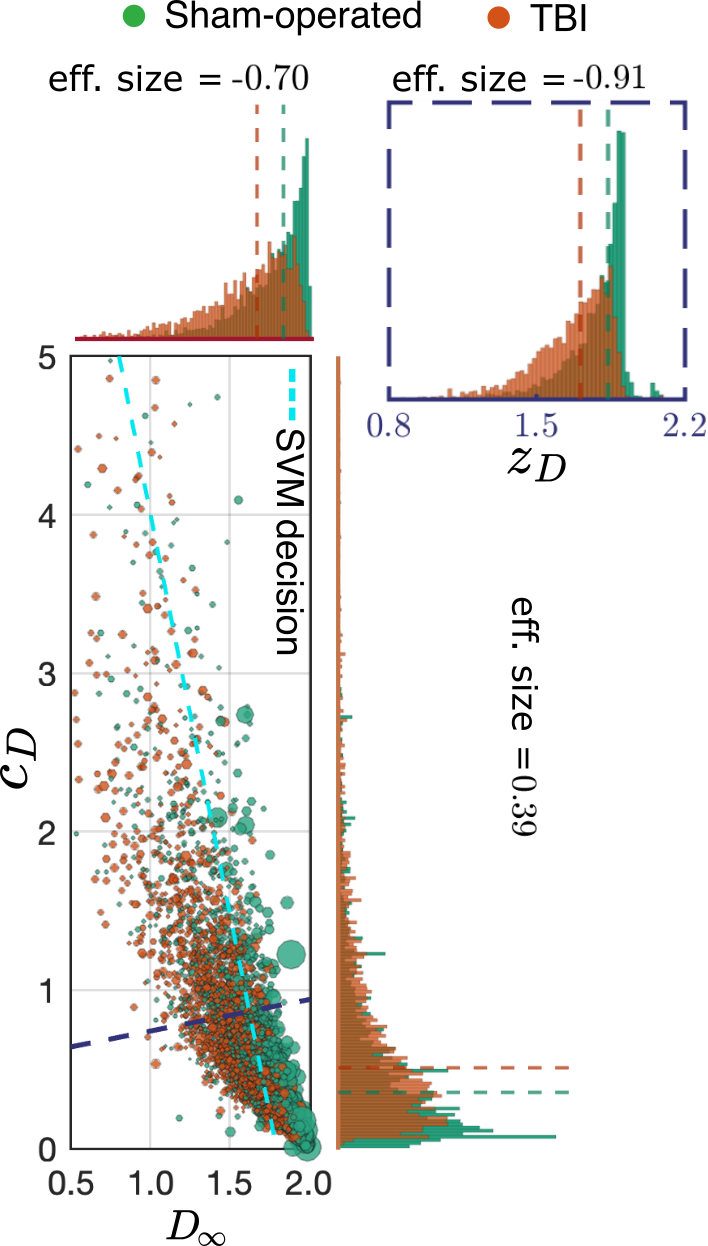
Connection to dMRI: In Fig.4, we predicted the macroscopic $$$D(t)$$$ in terms of $$$D_\infty$$$ and $$$c_D$$$ for all myelinated axons in the ipsilateral cingulum; the size of each data point corresponds to its volume-weighted contribution to the ensemble-averaged $$$D(t)$$$. TBI caused a decrease in $$$D_\infty$$$ and an increase in $$$c_D$$$ --- the rate at which the diffusion signal approaches its tortuosity limit.
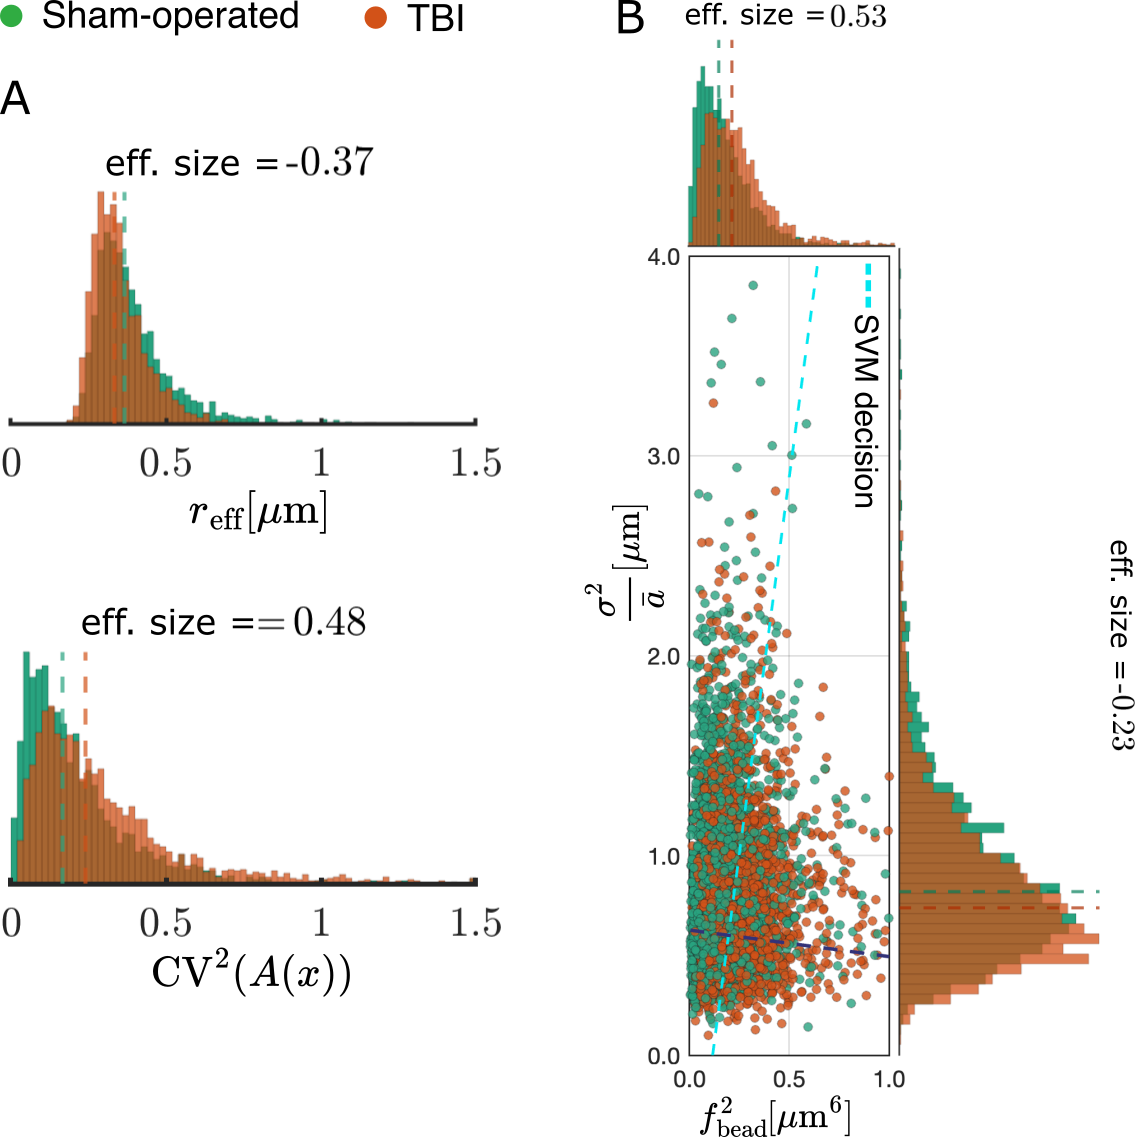
Geometrical interpretation: In Fig.5 A, we compare the sensitivity of our tortuosity measure $$$\frac{D_0}{D_\infty}\approx1+\text{CV}^2(A(x)/\bar{A})$$$ (achievable in clinical settings) against the effective diameter defined12-13 as $$$r_{\text{eff}}=\left(\frac{\langle r\rangle^6}{\langle r\rangle^2}\right)^{1/4}$$$. We found that tortuosity is more sensitive to the changes caused by TBI in the ipsilateral cingulum dataset. In Fig.5 B, by decomposing $$$\Gamma_0$$$, we observe that TBI increased the volume fraction of beads with a large effect size and decreased the disorder of bead positions with a smaller effect.
DISCUSSION AND CONCLUSIONS
Accessing the time-dependent along-tract diffusivity $$$D(t)$$$ corresponds to a clinically feasible, lowest-order ~$$$q^2$$$ dMRI weighting, as opposed to very strong diffusion gradients necessary for mapping axonal diameters12-16 dominated by the tail of the axonal diameter distribution12-13. We expect the extra-axonal space contribution to be similar given that its geometric profile mirrors that of intra-axonal space, yet with notably smaller volume fraction17 further suppressed by the relatively faster T2 relaxation18-19. The uncovered geometric parameters, $$$\left<\frac{1}{\alpha(x)}\right>$$$ and $$$\Gamma_0$$$ attain specificity to $$$\mu$$$m-scale changes in axon microstructure, the hallmark of many neurodegenerative diseases20-24.Acknowledgements
This research was supported by the NIH under awards R01 NS088040 and R21NS081230 and was performed under the rubric of the Center for Advanced Imaging Innovation and Research (CAI2R, www.cai2r.net), an NIBIB National Center for Biomedical Imaging and Bioengineering (NIH P41 EB017183).References
[1] Kiselev VG, NMR in Biomedicine 30 (2017); [2] Novikov DS et al., Magnetic Resonance in Medicine 79, 3272 (2018); [3] Novikov DS et al., NMR in Biomedicine 32 (2019); [4] Jelescu I et al., Frontiers in physics 5 (2017); [5] Weiskopf N et al., Nature Reviews Physics 3, 570 (2021); [6] Lampinen B et al., NeuroImage 282(2023); [7] Abdollahzadeh A et al., Commun Biol. 4 1 (2021); [8] Abdollahzadeh A et al., IEEE Access 9 (2021); [9] Lee HH et al., J Neurosci Methods 350 (2021); [10] Novikov DS et al., NMR in Biomedicine 23 (2010); [11] Novikov DS et al., PNAS 111 14 (2014); [12] Veraart J et al., eLife 9 (2020); [13] Burcaw LM et al., NeuroImage, 114 (2015); [14] Assaf Y et al., Magnetic Resonance in Medicine 59 (2008); [15] Fan Q et al., NeuroImage 222 (2020); [16] Huang SY et al., Annals of clinical and translational neurology 6 (2019); [17] Sykova E et al., Physiol Rev 88 (2008); [18] Veraart J et al., NeuroImage 182 (2018); [19] Tax CM et al., NeuroImage 236 (2021); [20] Shepherd GMG et al. PNAS 99 (2002); [21] Geula C et al., Journal of Neuropathology & Experimental Neurology 67 (2008); [22] Li P et al., JNeurosci 28 (2008); [23] Ohgami T et al., Neuroscience Letters 136 (1992); [24] Nikic I et al., Nature Medicine 17 (2011)Figures