0303
Evaluation of MR Elastography-Based Biomarkers for Detecting Skull-Brain Interface Decoupling Changes in Response to Repetitive Head Impacts1Radiology, Mayo Clinic, Rochester, MN, United States, 2Physiology and Biomedical Engineering, Mayo Clinic, Rochester, MN, United States
Synopsis
Keywords: Traumatic Brain Injury, Traumatic brain injury, Repetitive head impacts, Magnetic resonance elastography
Motivation: The growing concern about subconcussive, repetitive head impacts (RHI) has prompted the need for non-invasive RHI detection methods.
Goal(s): To understand if there are alterations of the skull-brain interface due to RHI exposure and explore potential imaging biomarkers for characterizing RHI.
Approach: Four MR Elastography (MRE)-based parameters were compared between RHI(-) and RHI(+) groups, encompassing assessment of cortical stiffness, capabilities of motion dampening, and strain mediation at the skull-brain interface.
Results: Our findings revealed increased cortical stiffness, rotational transmission ratio, and adjusted NOSS in individuals with high RHI exposure, suggesting a degeneration of the skull-brain interface decoupling performance.
Impact: This study sheds light on RHI-induced changes at the skull-brain interface, proposing three potential non-invasive biomarkers for monitoring such alterations. These findings hold promise for aiding medical professionals in identifying individuals at high RHI exposure risk.
Introduction
Subconcussive, repetitive head impacts (RHI) refer to cumulative exposure to head trauma without observable symptoms and have been associated with the development of cognition decline and chronic traumatic encephalopathy 1,2. While numerous studies have illustrated the significance of the skull-brain interface in shielding the brain from RHI exposure 3-5, it remains uncertain whether alterations in this interface occur due to RHI exposure. With recent advancements in MR elastography (MRE) technology, we can now assess the status of the skull-brain interface by quantifying the skull-to-brain motion transmission (rotational transmission ratio, Rtr), the brain deformation (cortical normalized octahedral shear strain, NOSS), and the tissue properties (stiffness) at the cortical surface 6-8. Our hypothesis is that exposure to RHI may lead to changes in tissue properties and degradation of the skull-brain interface protective capability. In this study, we aimed to assess the response of these MRE-based parameters in individuals with RHI exposure.Methods
With IRB approval and written informed consent, we recruited 52 RHI(-) participants and 45 RHI(+) participants with at least three years of contact-sports involvement. After excluding six participants due to low wave quality/acquisition failure, Table 1 shows the participant demographics. Given the diverse sports histories of RHI participants, an impact index was formed with the most relevant two sports history indices and calculated as sports engagement duration divided by retirement-scan interval. With a cutoff of 5 (shown in Figure 1), RHI(+) participants were divided into low/high-impact subgroups, with an index>5 indicating longer play duration and more recent exposure.All MRI/MRE scans were conducted on a high-performance compact 3T MRI scanner 9. 3D T1-weighted and axial T2-weighted sequences were performed for segmentation and registration. MRE scans introduced 60Hz vibrations into the head, encoding skull/brain motions into fat/water phase signals with a dual-sensitivity and dual-motion encoding MRE pulse sequence and then converting phase signals to displacements 6.
The data processing followed the previous study 7. Briefly, Rtr is the brain-to-skull rotation ratio computed after fitting the displacements to a rigid-body model. Neural network inversions were used to generate octahedral shear strain (OSS) and stiffness maps. NOSS was calculated by normalizing the OSS to the wave amplitude. To further control for the wavelength-induced variation, the adjusted NOSS was calculated by multiplying NOSS and wave speed.
Median values within cortical surface regions (frontal, temporal, parietal, occipital) were reported, excluding low-displacement voxels (cutoff defined as displacement amplitude < one standard deviation of cortical displacement). Linear regression models were used to control for age/sex in the case of NOSS, stiffness, and adjusted NOSS. Rtr was controlled for sex and the skull-brain distance. ANOVA analysis and post-hoc Tukey analysis were used for each parameter, with significance at p < 0.05. FDR-corrected Q-values were calculated using the Benjamini-Hochberg method, and Q < 0.05 was considered statistically significant.
Results and Discussion
Figure 2 presents a comparative analysis of three groups, revealing significantly higher Rtr (Figure 2A), stiffness (Figure 2C), and adjusted NOSS (Figure 2D) in the high-impact group, but no significant NOSS differences between groups. Figures 3 and 4 show the projection of mean cortical stiffness and adjusted NOSS of RHI(-) and high-impact groups onto the standard space, as well as their differences. Besides the frontal lobe, the high-impact group also displays significantly higher stiffness in the temporal lobe and elevated adjusted NOSS in the temporal and parietal lobes.The increasing Rtr values in the high-impact group indicate greater motion transferred into the brain, potentially due to a weakened skull-brain interface's damping ability. Elevated cortical stiffness in vulnerable regions such as the frontal and temporal lobes is noteworthy and could result from potential scarring from repeated frictional movements at the skull-brain interface 10. However, the stiffer regions in the high-impact group did not exhibit the anticipated reduced shear strain (NOSS), likely because cortical deformation is influenced by both cortical stiffness and skull-brain interface interactions. When accounting for wavelength, a higher adjusted NOSS was observed, implying a reduced ability of the skull-brain interface to mediate strain. The smaller p-value for adjusted NOSS suggests it might be a more sensitive metric for identifying RHI exposure than stiffness alone. Low-impact participants who experienced shorter RHI exposures and longer recovery periods exhibited similar levels as RHI(-) individuals, suggesting the existence of a potential recovery window of the interface protective mechanisms.
Conclusion
This study has demonstrated an increase in cortical stiffness and a degeneration of the protective properties of the skull-brain interface under RHI exposure. The MRE-based parameters (Rtr, stiffness, adjusted NOSS) are promising biomarkers for noninvasively screening populations with RHI exposure risk.Acknowledgements
This work was supported by grants from the NIH (R01EB001981, R01NS113760, R01EB027064, and U01EB024450).
References
1. Montenigro PH, Alosco ML, Martin BM, et al. Cumulative head impact exposure predicts later-life depression, apathy, executive dysfunction, and cognitive impairment in former high school and college football players. Journal of neurotrauma 2017;34(2):328-340
2. Baugh CM, Stamm JM, Riley DO, et al. Chronic traumatic encephalopathy: neurodegeneration following repetitive concussive and subconcussive brain trauma. Brain imaging and behavior 2012;6(244-254)
3. Benko N, Luke E, Alsanea Y, et al. Spatial distribution of human arachnoid trabeculae. Journal of Anatomy 2020;237(2):275-284
4. Benko N, Luke E, Alsanea Y, et al. Mechanical characterization of the human pia-arachnoid complex. Journal of the Mechanical Behavior of Biomedical Materials 2021;120(104579)
5. Qian L, Wang S, Zhou S, et al. Influence of pia-arachnoid complex on the indentation response of porcine brain at different length scales. Journal of the Mechanical Behavior of Biomedical Materials 2022;127(104925)
6. Yin Z, Sui Y, Trzasko JD, et al. In vivo Characterization of 3D Skull and Brain Motion During Dynamic Head Vibration Using Magnetic Resonance Elastography. Magn Reson Med 2018;80(6):2573-85, doi:10.1002/mrm.27347
7. Shan X, Murphy MC, Sui Y, et al. Magnetic Resonance Elastography-Based Technique to Assess the Biomechanics of the Skull-Brain Interface: Repeatability and Age-Sex Characteristics. Journal of Neurotrauma 2023;40(19-20):2193-2204
8. Pavuluri K, Scott JM, Huston III J, et al. Differential effect of dementia etiology on cortical stiffness as assessed by MR elastography. NeuroImage: Clinical 2023;37(103328)
9. Weavers PT, Shu Y, Tao S, et al. Compact three‐tesla magnetic resonance imager with high‐performance gradients passes ACR image quality and acoustic noise tests. Medical physics 2016;43(3):1259-1264
10. Jeon YS, Lee JG, Chun YI, et al. Traumatic pseudoaneurysm related to calcified nodules of cerebral convexity dura mater in an american college football player. Journal of Cerebrovascular and Endovascular Neurosurgery 2016;18(3):322-326
Figures
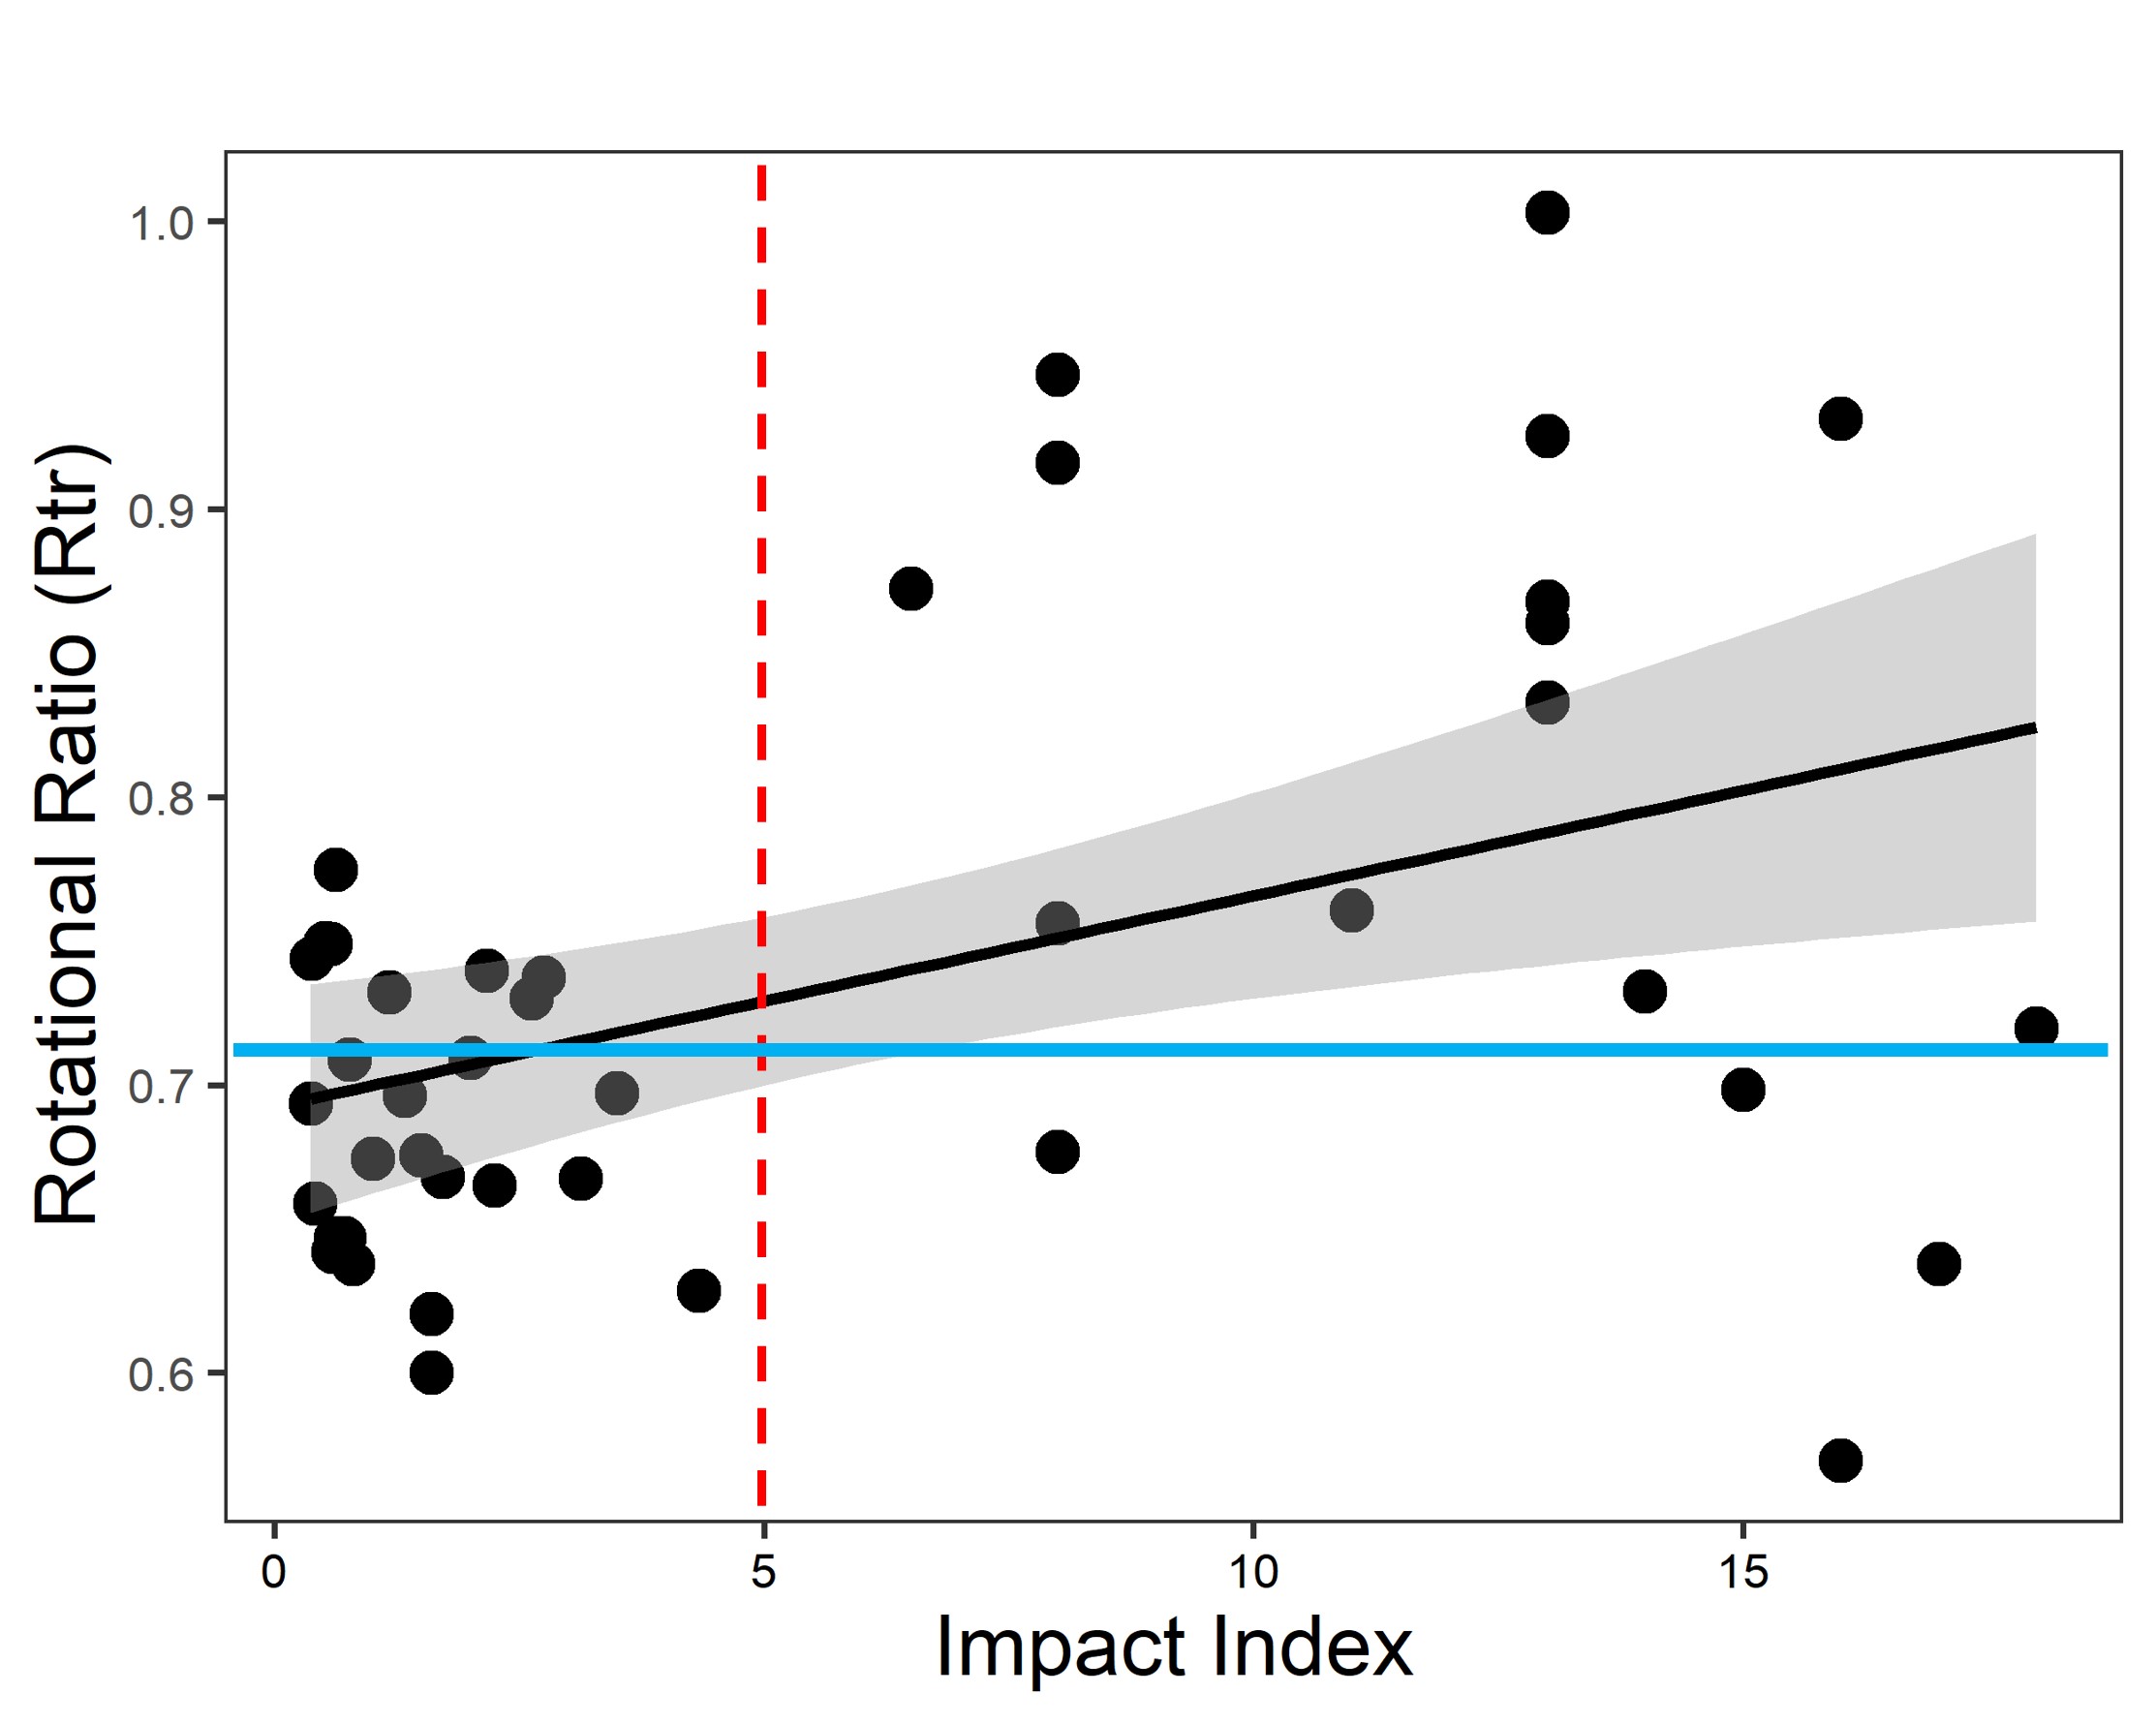
Figure 1. Correlation between rotational transmission ratio (Rtr) and impact index. Rtr versus impact index linear regression line is plotted (solid black line) with confidence intervals (grey shadow). Blue solid indicates the mean Rtr value in the RHI(-) group. A cutoff of 5 (red dotted line) is used for separating RHI(+) participants into low and high-impact groups.
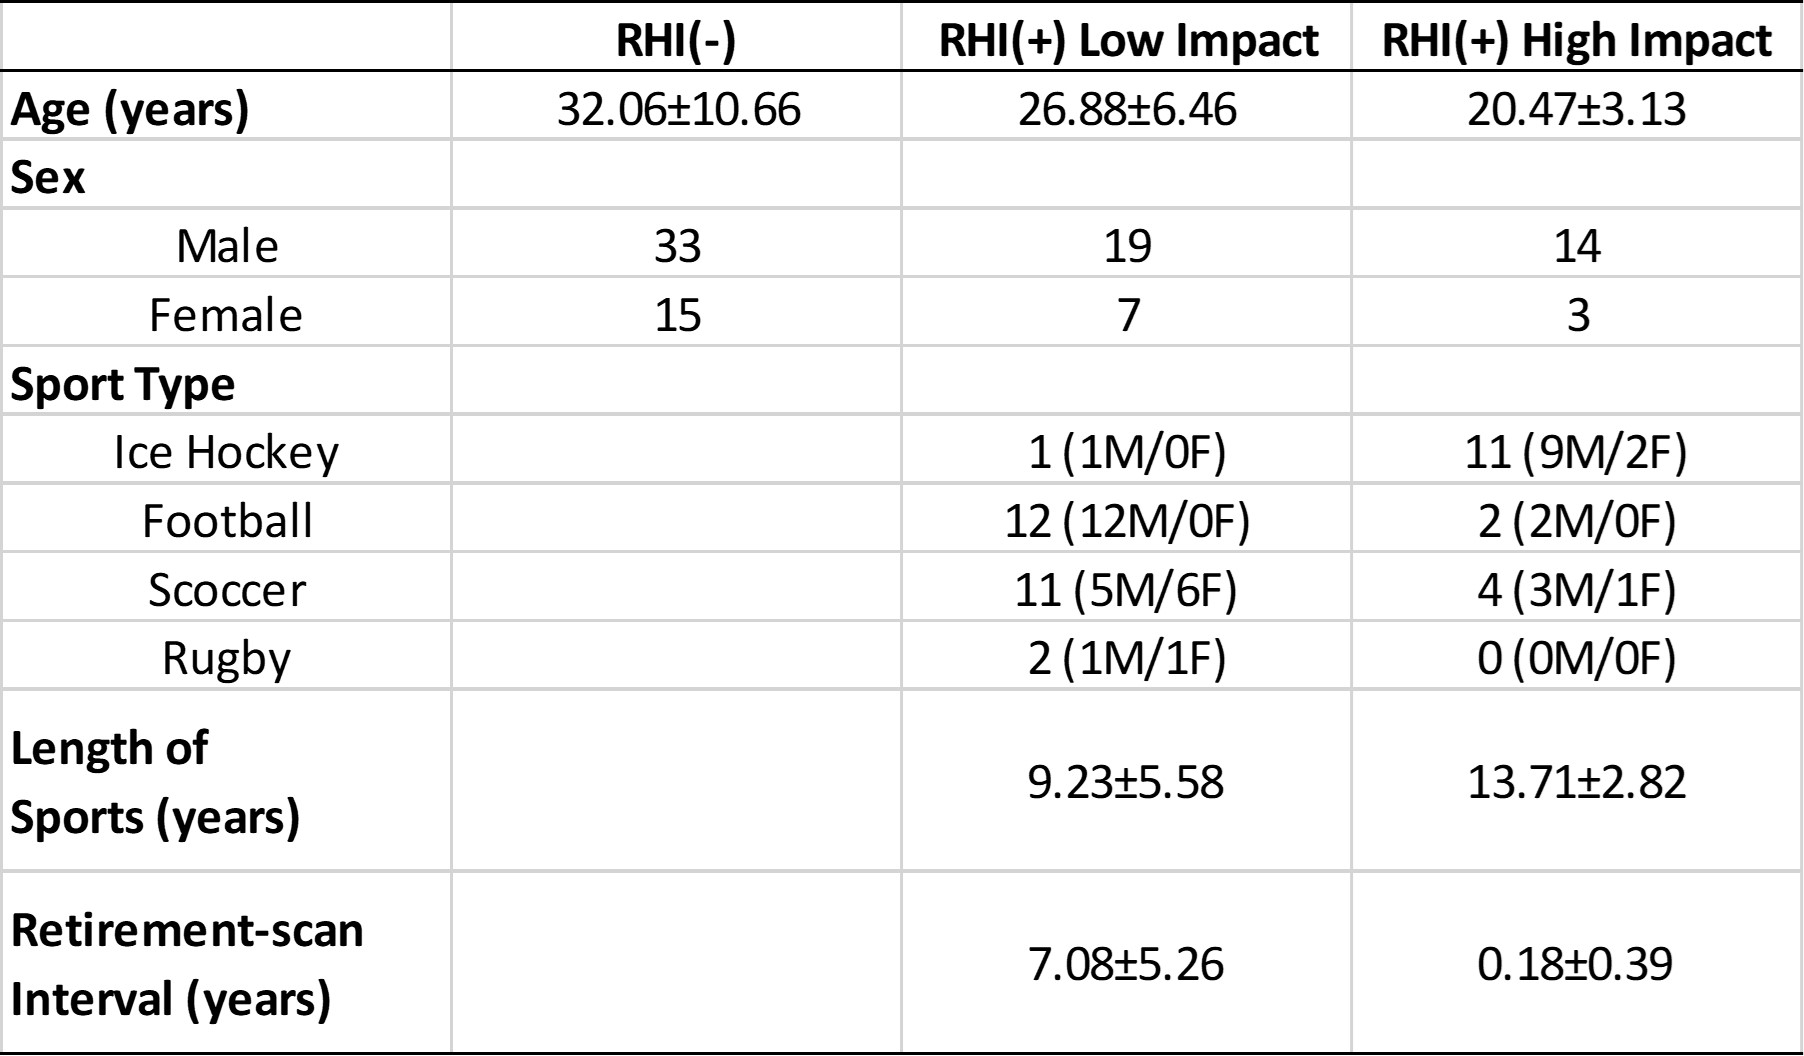
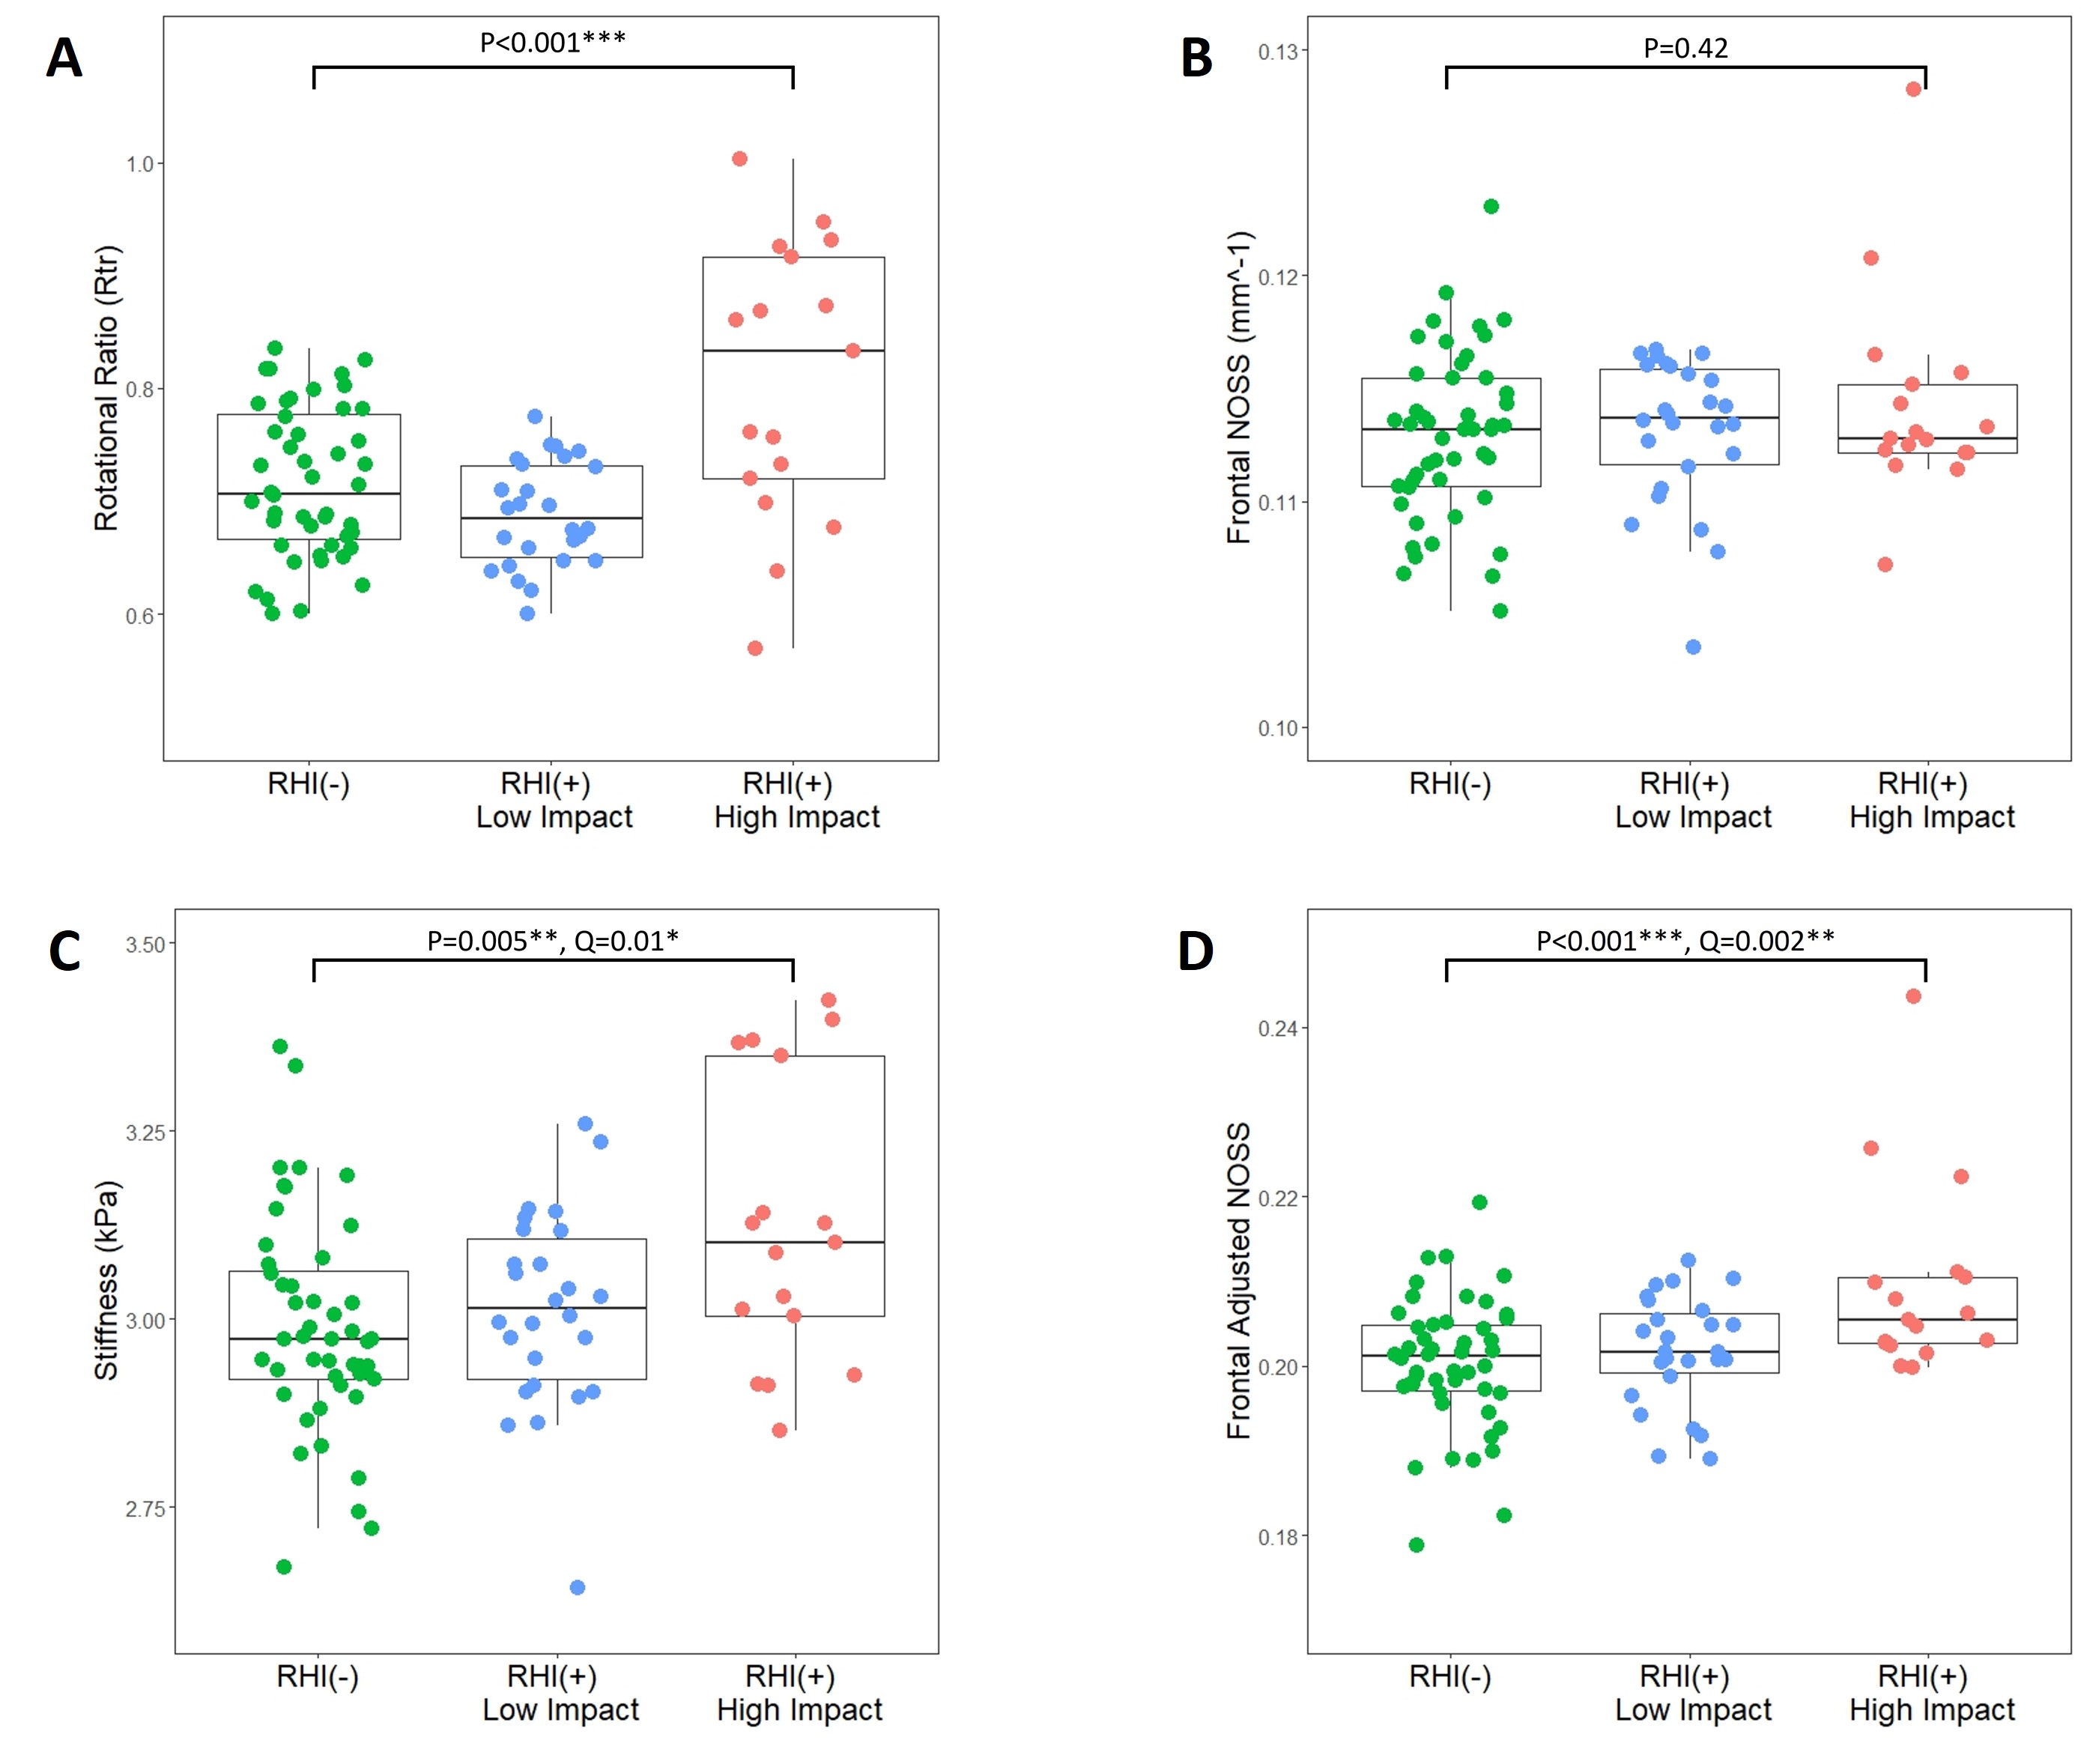
Figure 2. Results of group analysis for (A) Rtr, (B) frontal NOSS, (C) frontal stiffness, and (D) frontal adjusted NOSS.
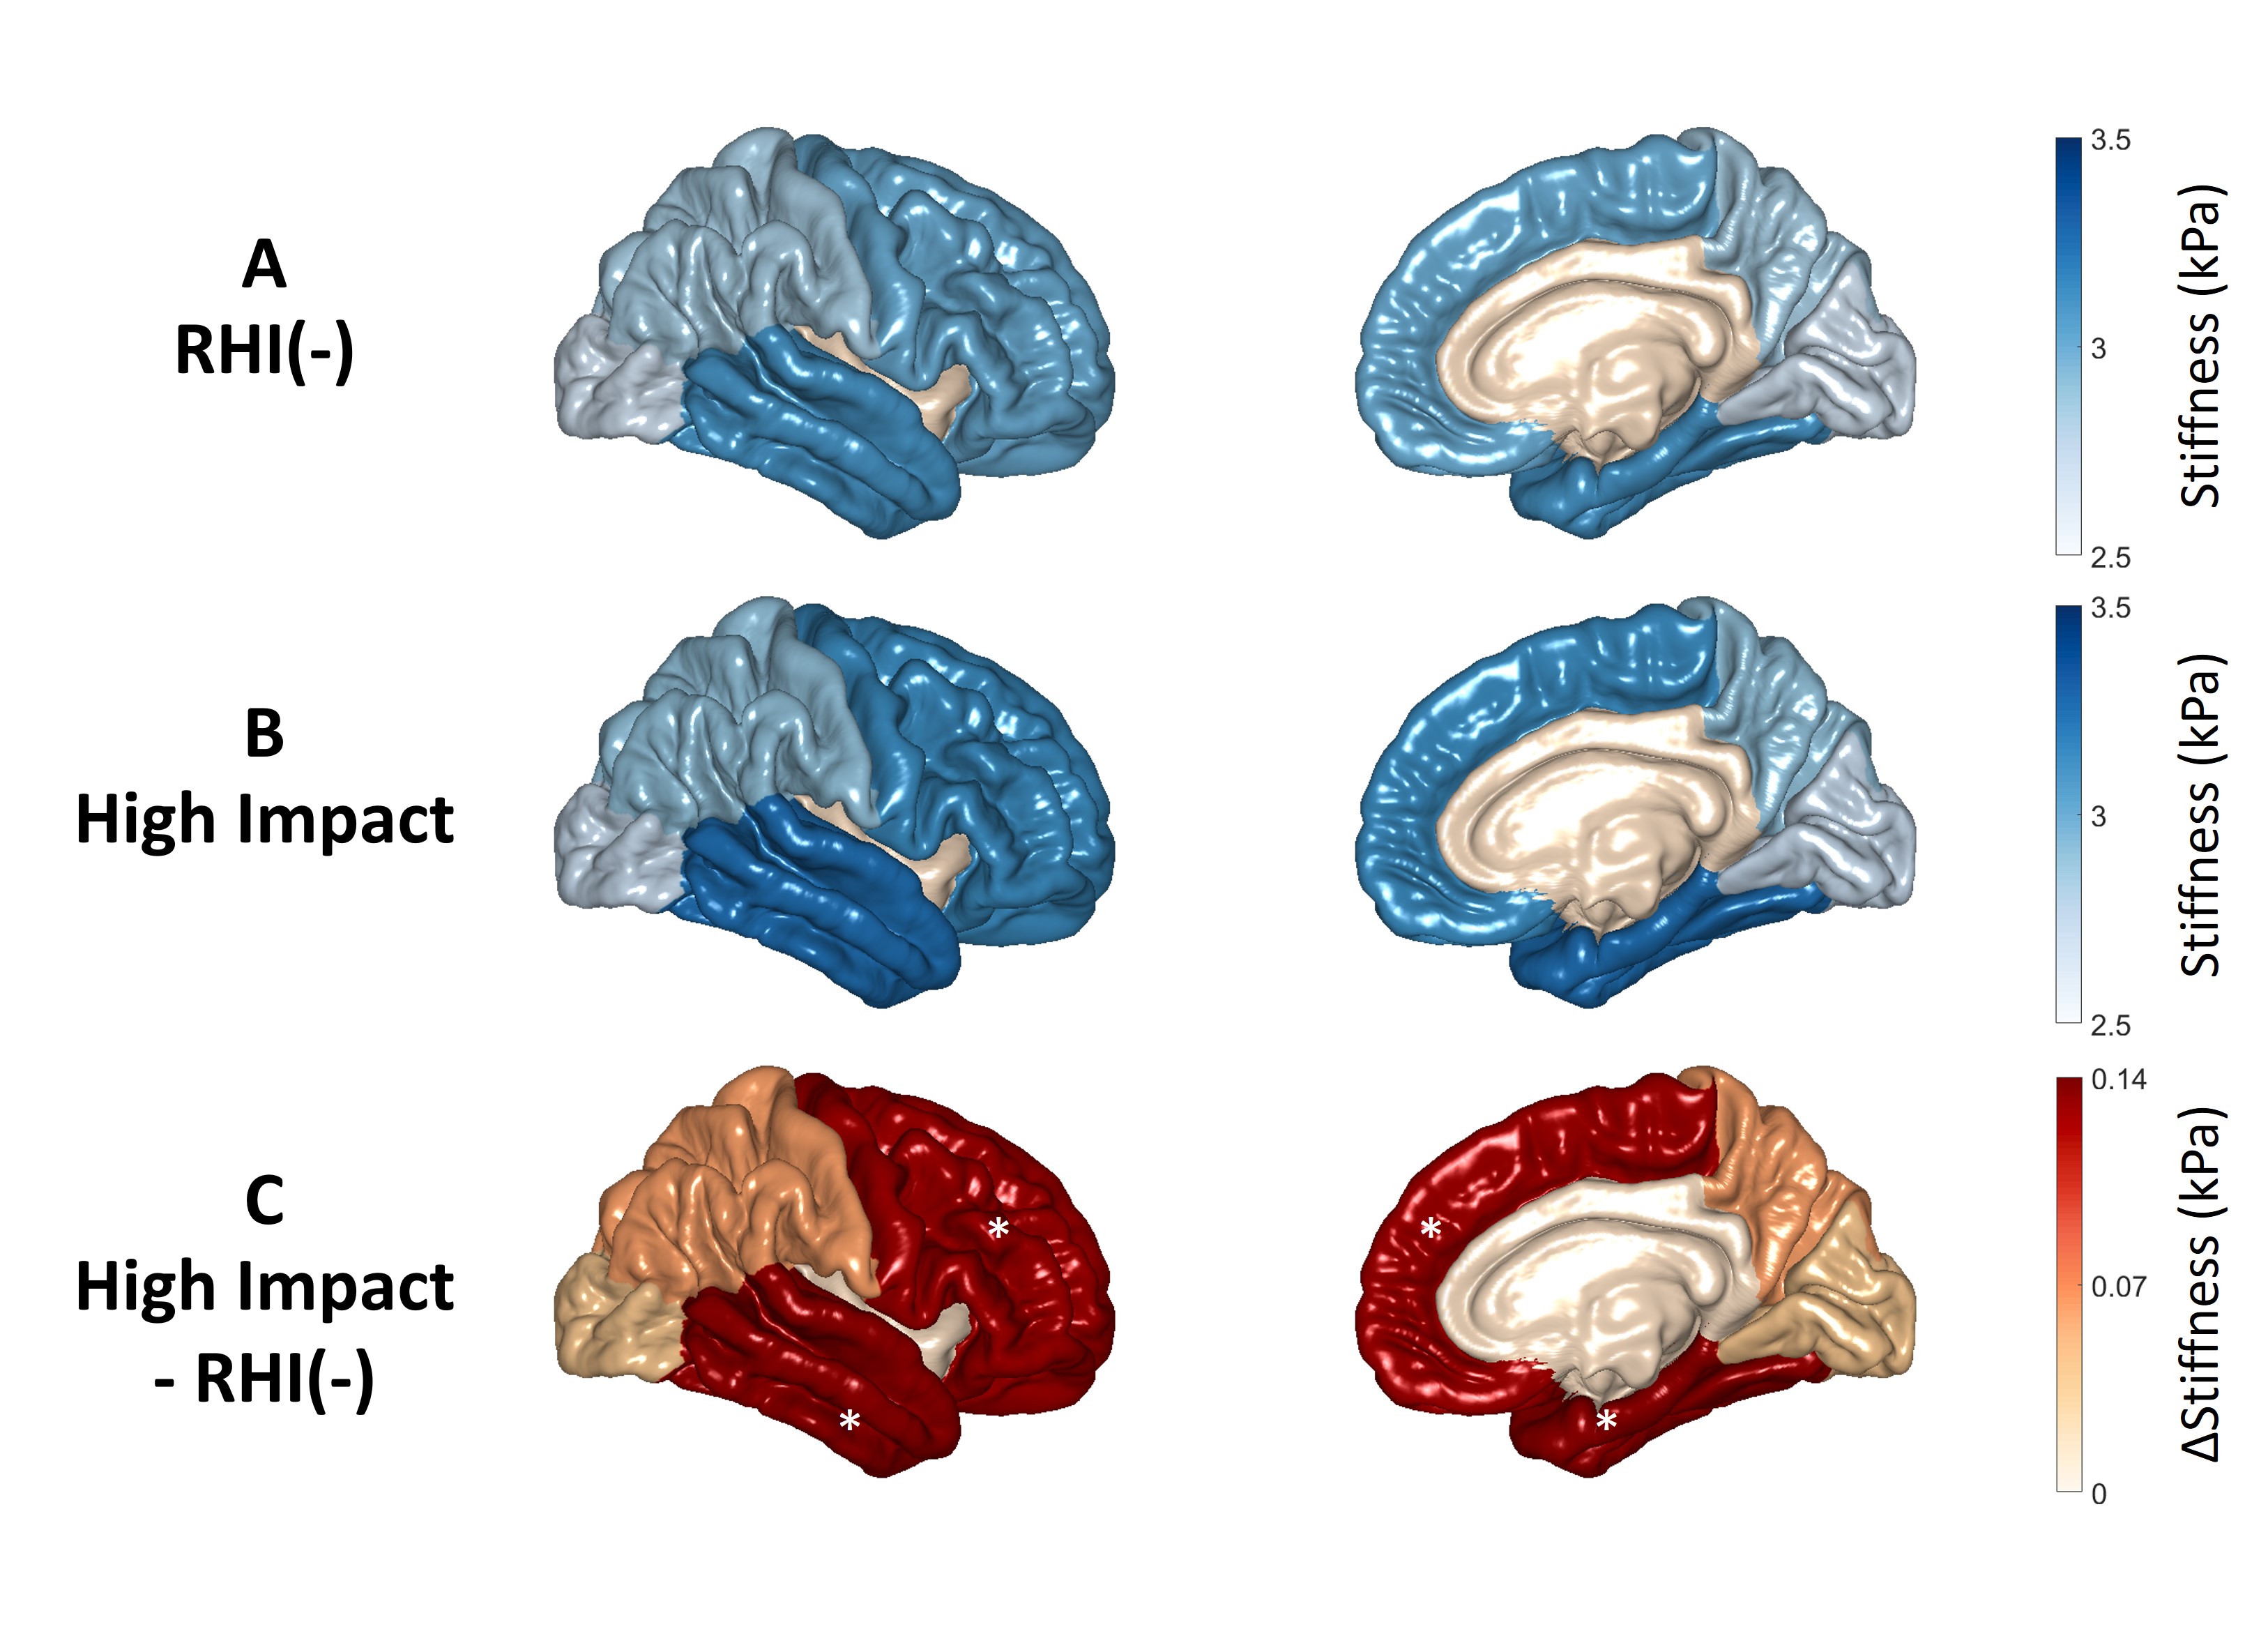
Figure 3. Regional cortical stiffness changes due to RHI exposure. (A) Mean cortical stiffness in the RHI(-) group. (B) Mean cortical stiffness in the high-impact group. (C) The difference in mean cortical stiffness between the two groups. Regions marked with stars show a significant difference between the RHI(-) and high-impact groups.
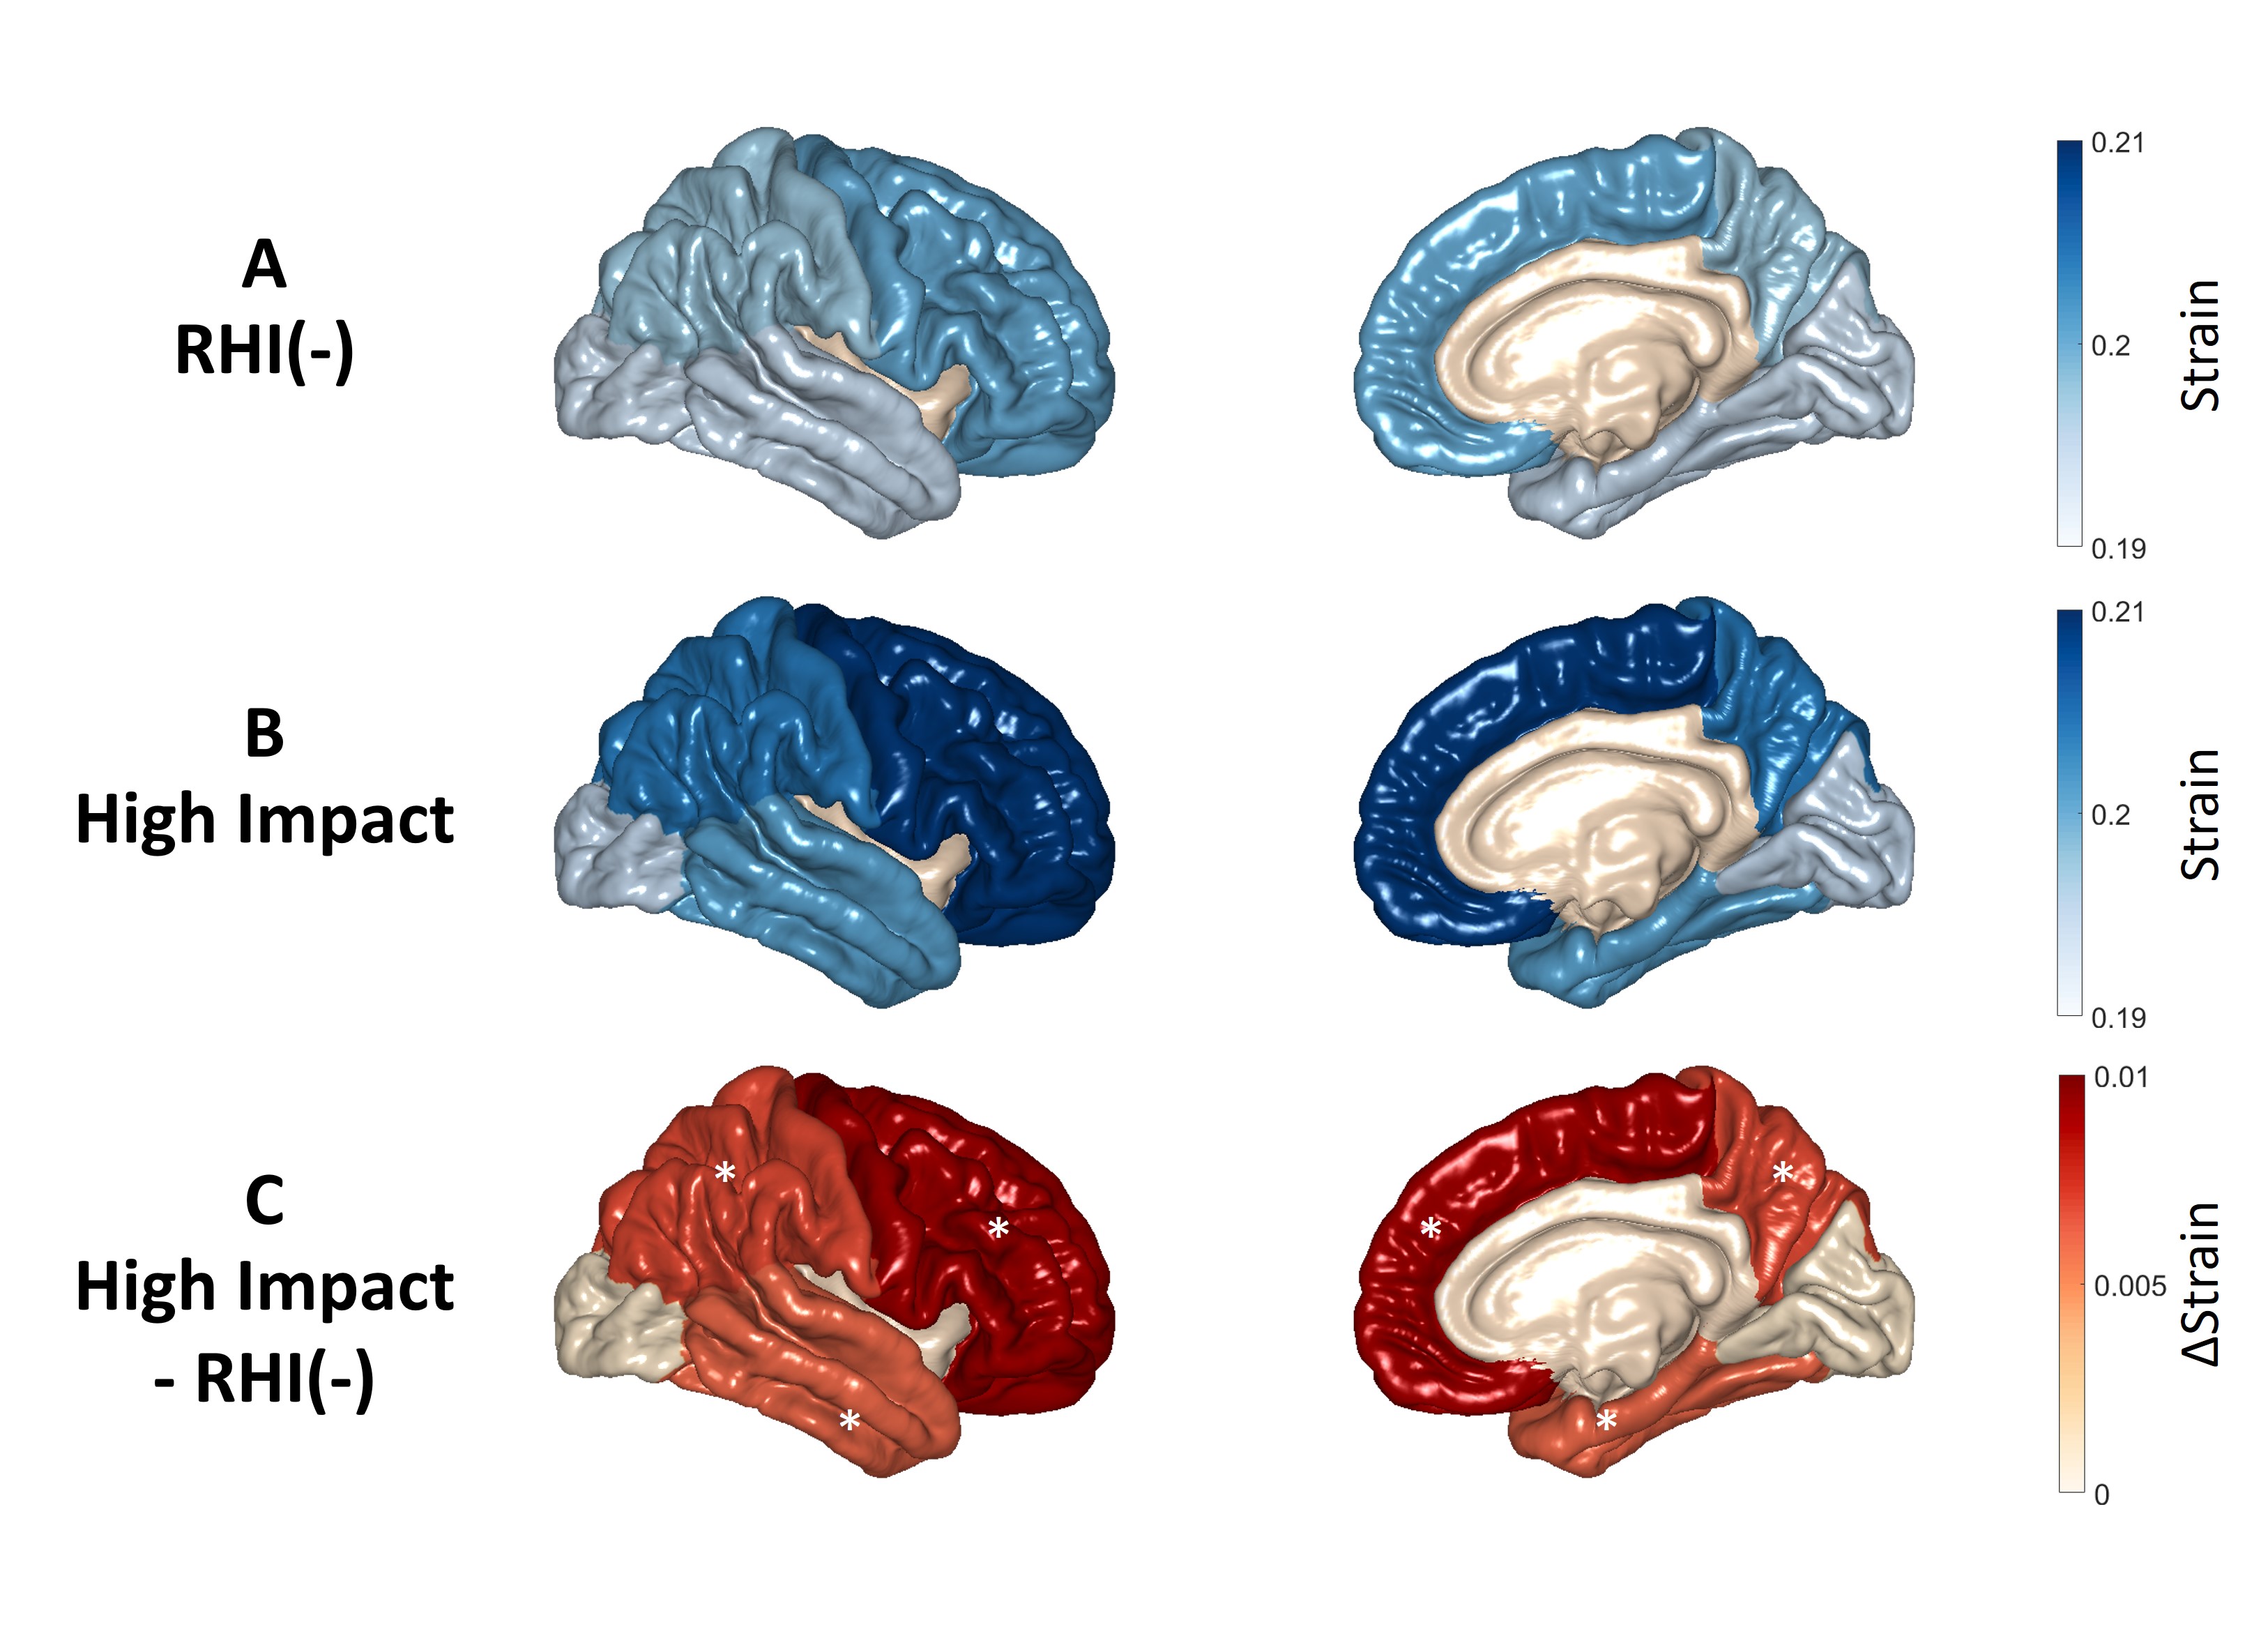
Figure 4. Regional cortical adjusted NOSS changes due to RHI exposure. (A) Mean cortical adjusted NOSS in the RHI(-) group. (B) Mean adjusted NOSS stiffness in the high-impact group. (C) The difference in mean cortical adjusted NOSS between the two groups. Regions marked with stars show a significant difference between the RHI(-) and high-impact groups.