0299
Brain temperature and its relation to cognitive status in traumatic brain injury: a whole-brain magnetic resonance spectroscopic imaging study1Department of Biomarker imaging Science, Graduate School of Biomedical Science and Engineering, Hokkaido University, Sapporo, Japan, 2Department of Rehabilitation, Hokkaido University Hospital, Sapporo, Japan, 3Department of Rehabilitation, Sapporo Azabu Neurosurgical Hospital, Sapporo, Japan, 4Department of Radiology, University of Miami School of Medicine, Miami, FL, United States, 5Department of Rehabilitation Science, Hokkaido University Faculty of Health Sciences, Sapporo, Japan, 6Global Center for Biomedical Science and Engineering, Faculty of Medicine, Hokkaido University, Sapporo, Japan
Synopsis
Keywords: Traumatic Brain Injury, Thermometry, Brain temperature
Motivation: The long-term outcome, i.e., the impact of injury on life, may be underestimated in patients with mild-to-moderate TBI. Cognitive deficit, a sequela of TBI and a significant social burden, is difficult to assess in uncooperative patients.
Goal(s): To compare brain temperature between control and TBI groups, and to assess the relationship between brain temperature and cognitive status in TBI group.
Approach: Brain temperature of patients was estimated noninvasively by WB-MRSI and compared to controls; the association between brain temperature and cognitive status was also assessed in the TBI group.
Results: Significant brain temperature reductions in the TBI group were associated with cognitive decline.
Impact: The strong correlation between brain temperature and cognitive performance in the TBI group indicates that attention decreases as brain temperature decreases. Brain temperature may become as a quantitative indicator of cognitive status in patients with subacute to chronic TBI.
Introduction
The widely known persistent neurological deficits of severe TBI can also occur in patients with mild-to-moderate TBI1. Chronic cognitive impairment resulting from TBI poses a major social burden and concern because it leads to decreased productivity, yet the long-term outcome of patients with mild-to-moderate TBI may be underestimated2,3. A previous 1H-MRS study reported a correlation between brain metabolite ratio Cho/NAA and cognitive performance in mild-to-moderate TBI4. Major brain metabolites such as NAA, Cho, and Cr are involved in energy metabolism, contributing to heat production5. In addition to energy metabolism, brain temperature is affected by multiple parameters, including glucose transport and the dissipation of generated heat. Brain temperature may be a better indicator of brain status than brain metabolites. We aimed to assess whether brain temperature estimated from brain metabolites reflects cognitive performance with mild-to-moderate TBI in subacute-to-chronic phases.Methods
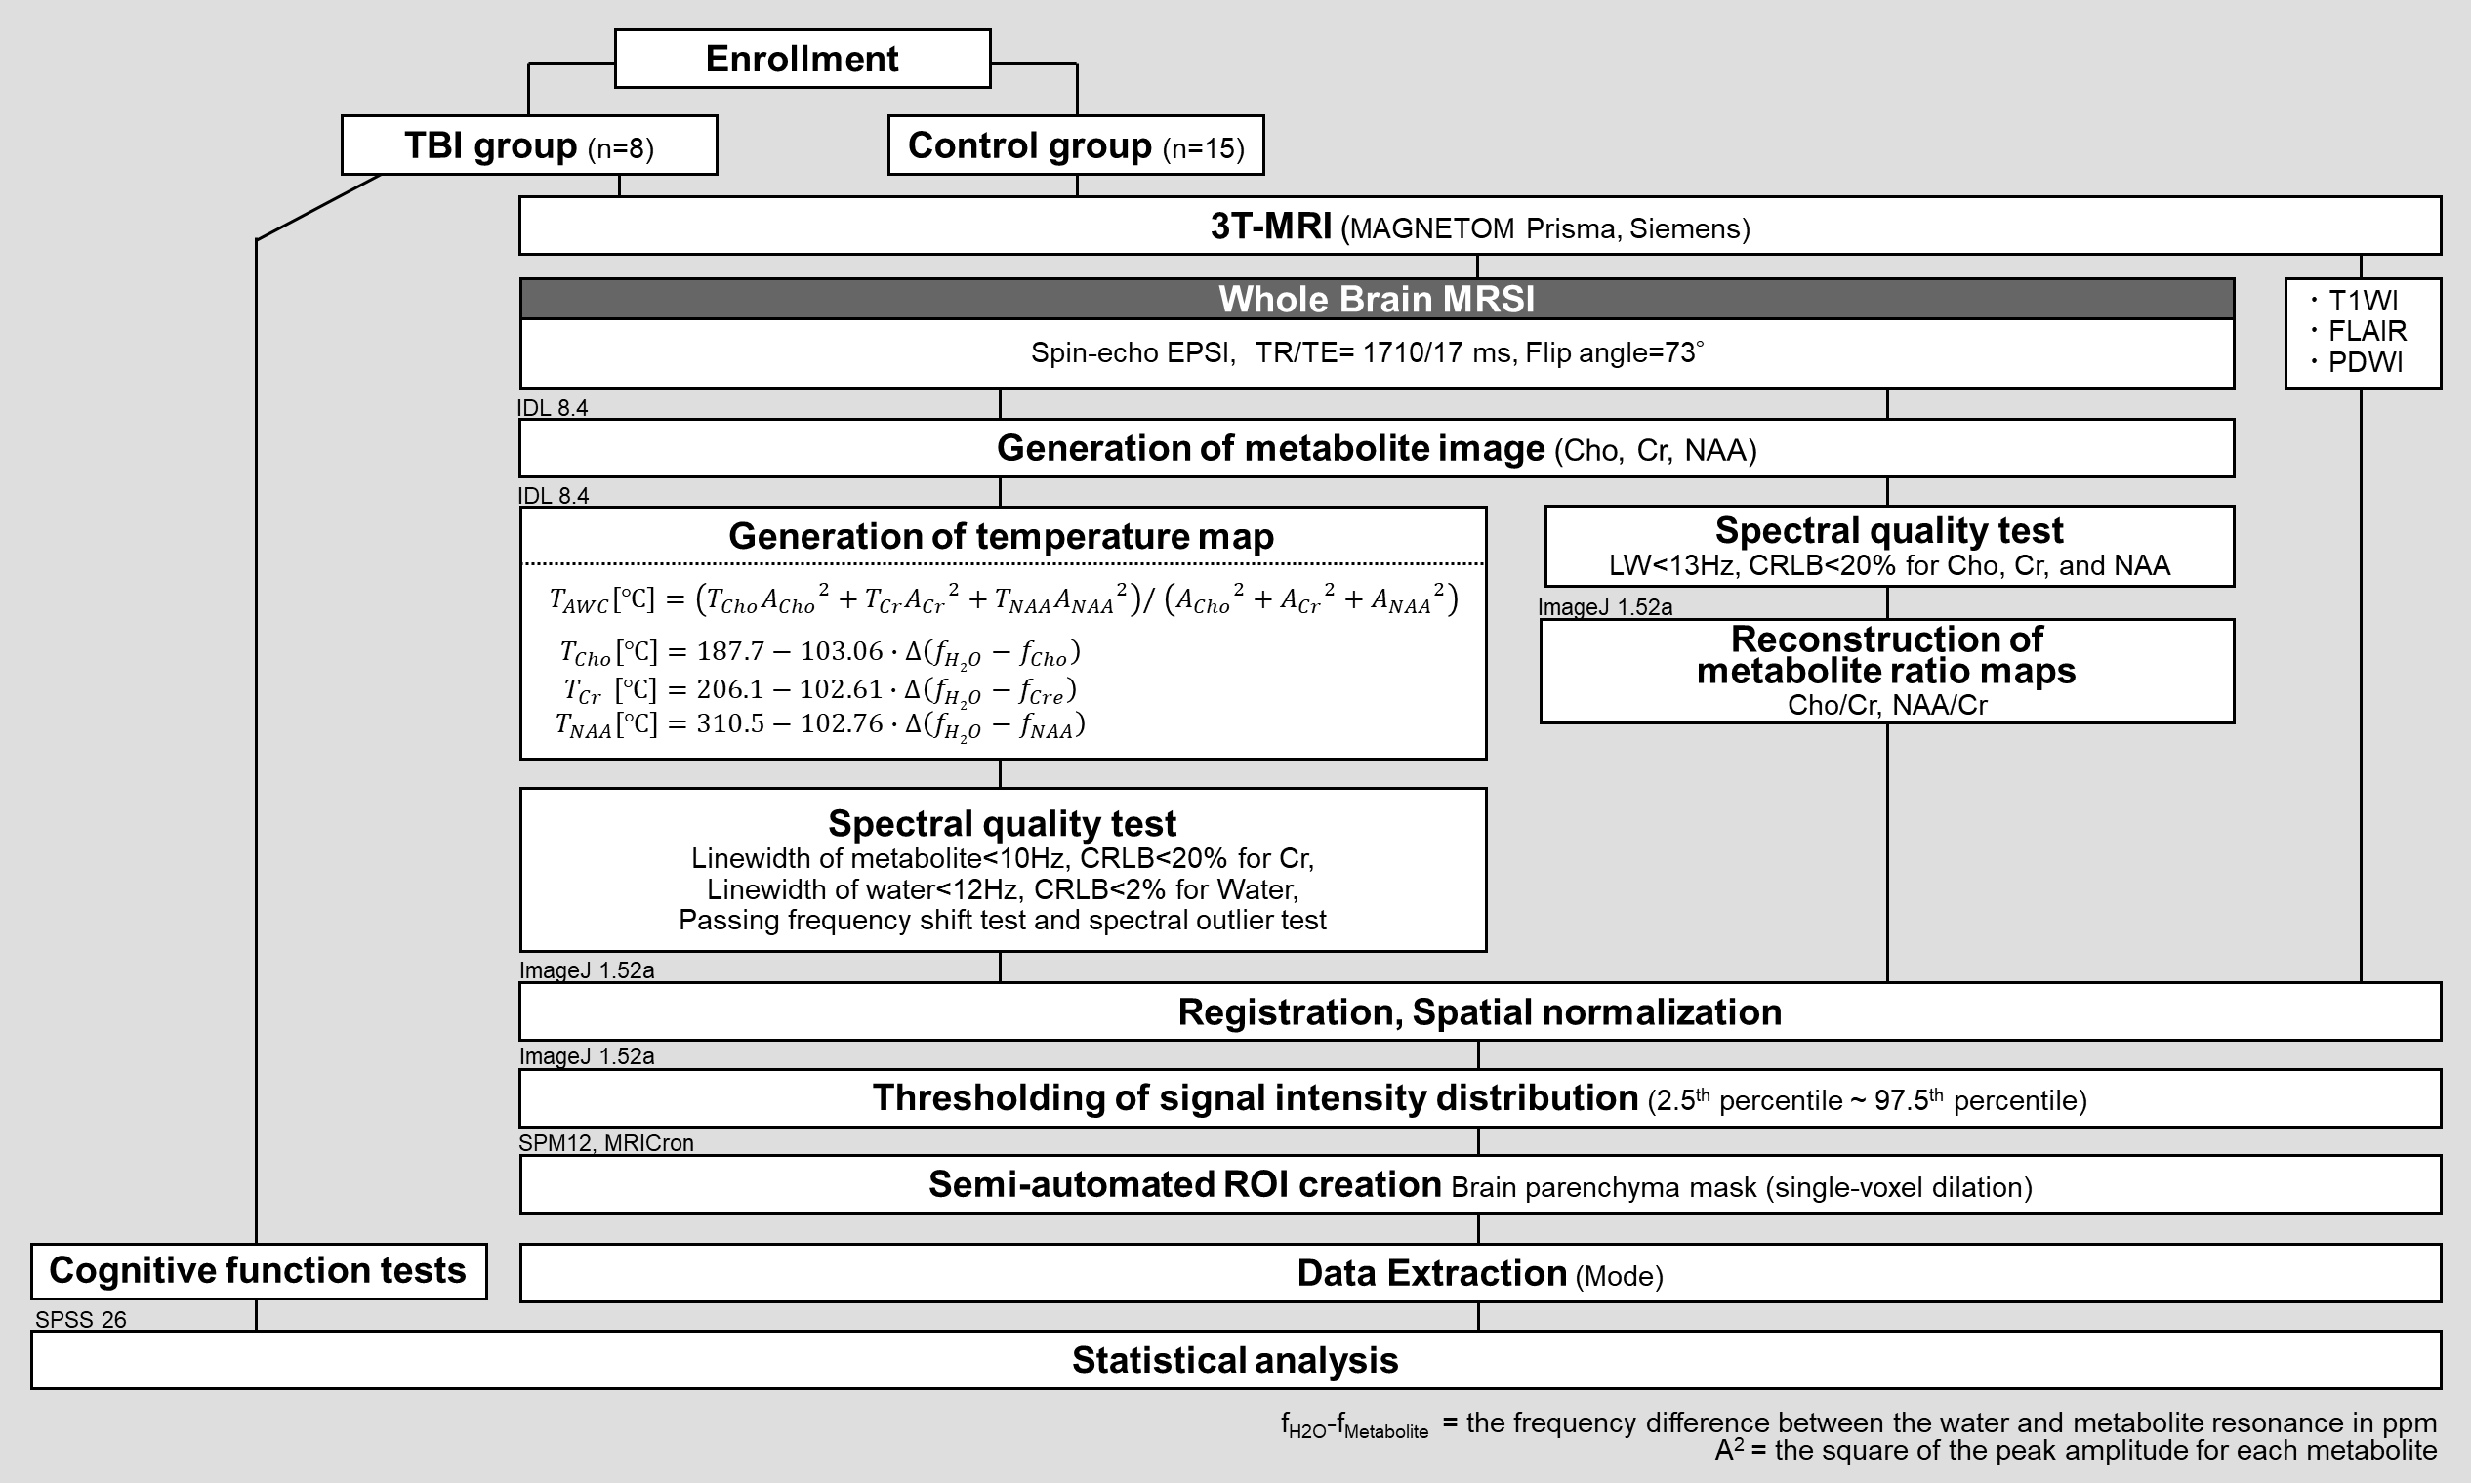
This retrospective study was approved by a local ethical committee, and written informed consent was obtained from all participants. In 25 months, serial patients with TBI who consulted at the Department of Rehabilitation of our Hospital were recruited. After excluding those lacking short TE whole brain (WB) MRSI, 8 patients (all men, mean age= 44.0±14.3 years) were eligible. For comparison, 15 age- and sex-matched healthy controls were randomly selected from a normal database6. Table1 shows the details of patients. Each group underwent a short TE WB-MRSI and the following scan parameters: TR/TE/TI = 1710/17/198 ms, flip angle = 73°, sampling of 50 × 50 × 18 k-space points over 280 × 280 × 180mm3. 3D-T1WI, axial FLAIR imaging and axial PDWI were also acquired to obtain structural images and to check for gross abnormalities. The TBI group also underwent neurocognitive tests to assess cognitive performance: The Wechsler Adult Intelligence Scale (WAIS), Behavioral Assessment of the Dysexecutive Syndrome (BADS); Clinical Assessment for Attention (CAT), Continuous Performance Test (CPT); and Trail Making Test (TMT). The WB-MRSI data were processed using MIDAS software7 (University of Miami, USA), and the image reconstruction and spectral processing procedures for the major metabolite and temperature maps closely followed those reported by Maudsley et al7,8 (Figure1). Brain temperature maps TAWC, TCho, TCr, and TNAA were calculated voxel by voxel from the frequencies of water and each metabolite, NAA, Cho, and Cr. Metabolite maps were also reconstructed, and metabolite ratio maps, Cho/Cr, and NAA/Cr were calculated. Mode was extracted from each temperature and major metabolite ratio map. Student‘s t-test or Mann-Whitney U test was used to assess whether brain temperature varied between groups. Statistical significance was set as p< 0.05. Pearson’s product-moment correlation analysis assessed the relationship between brain temperature and neurocognitive performance in the TBI group, and statistical significance was defined as p< 0.01.Results and Discussion
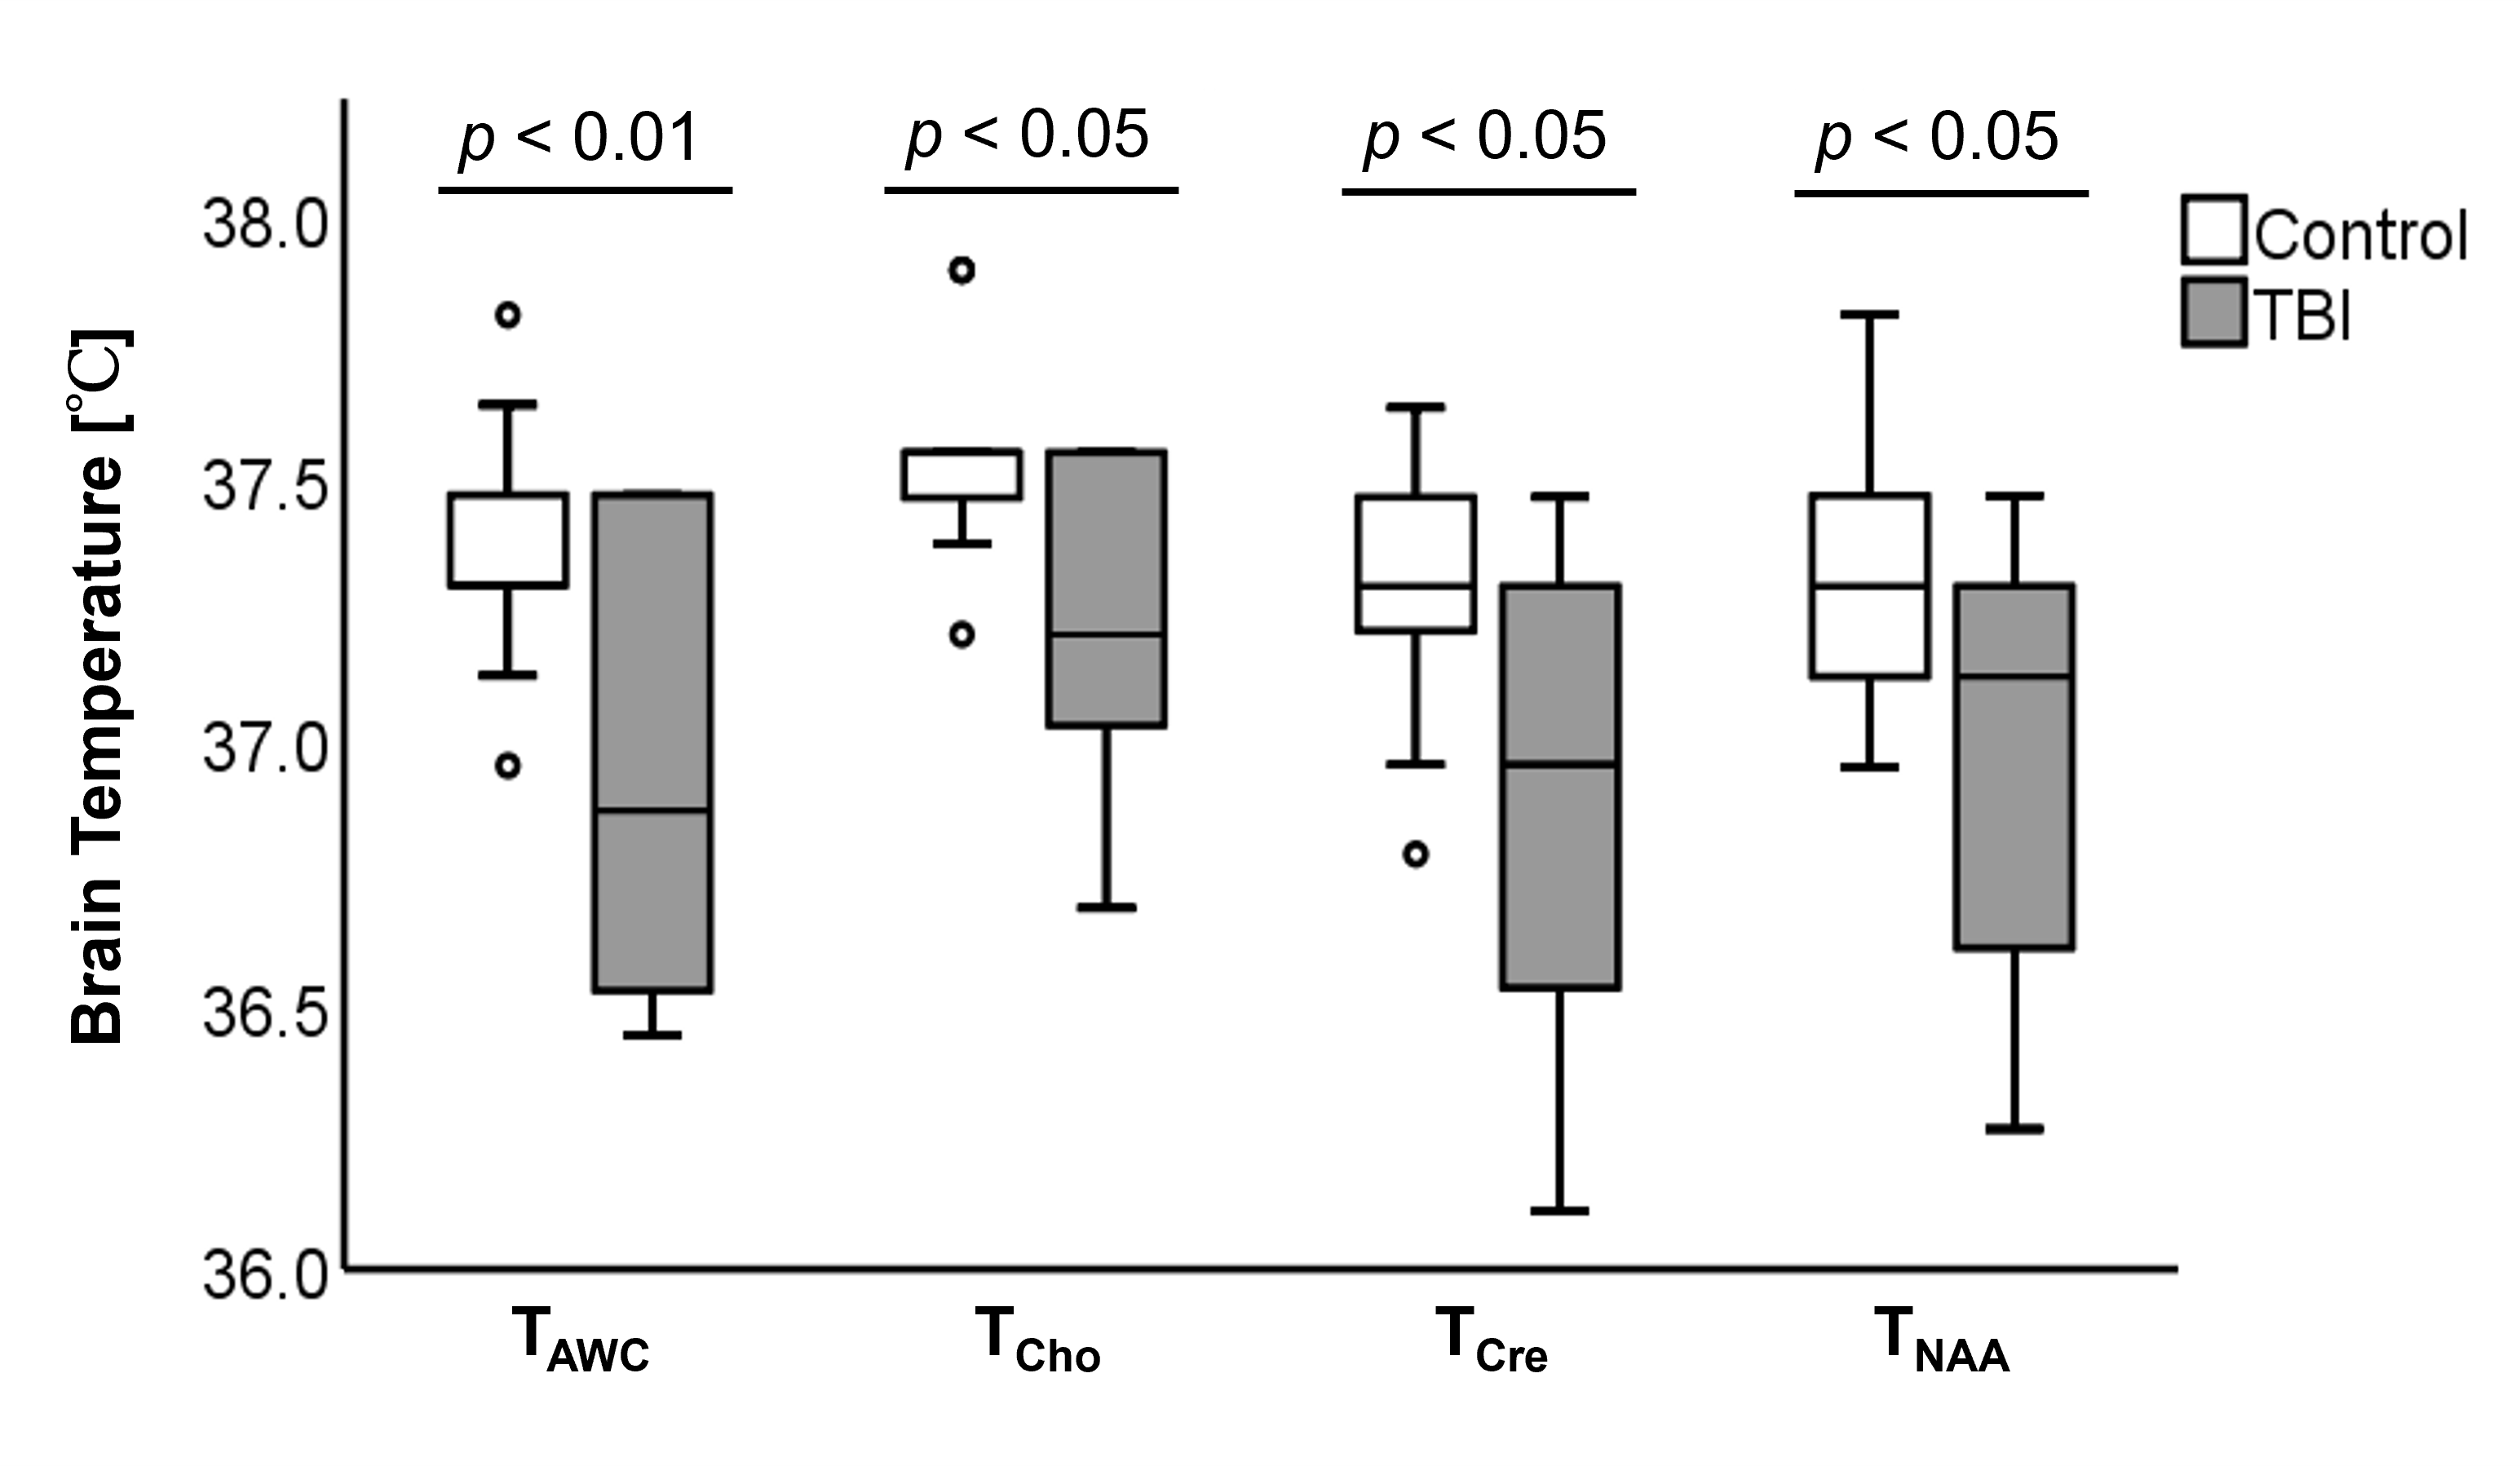
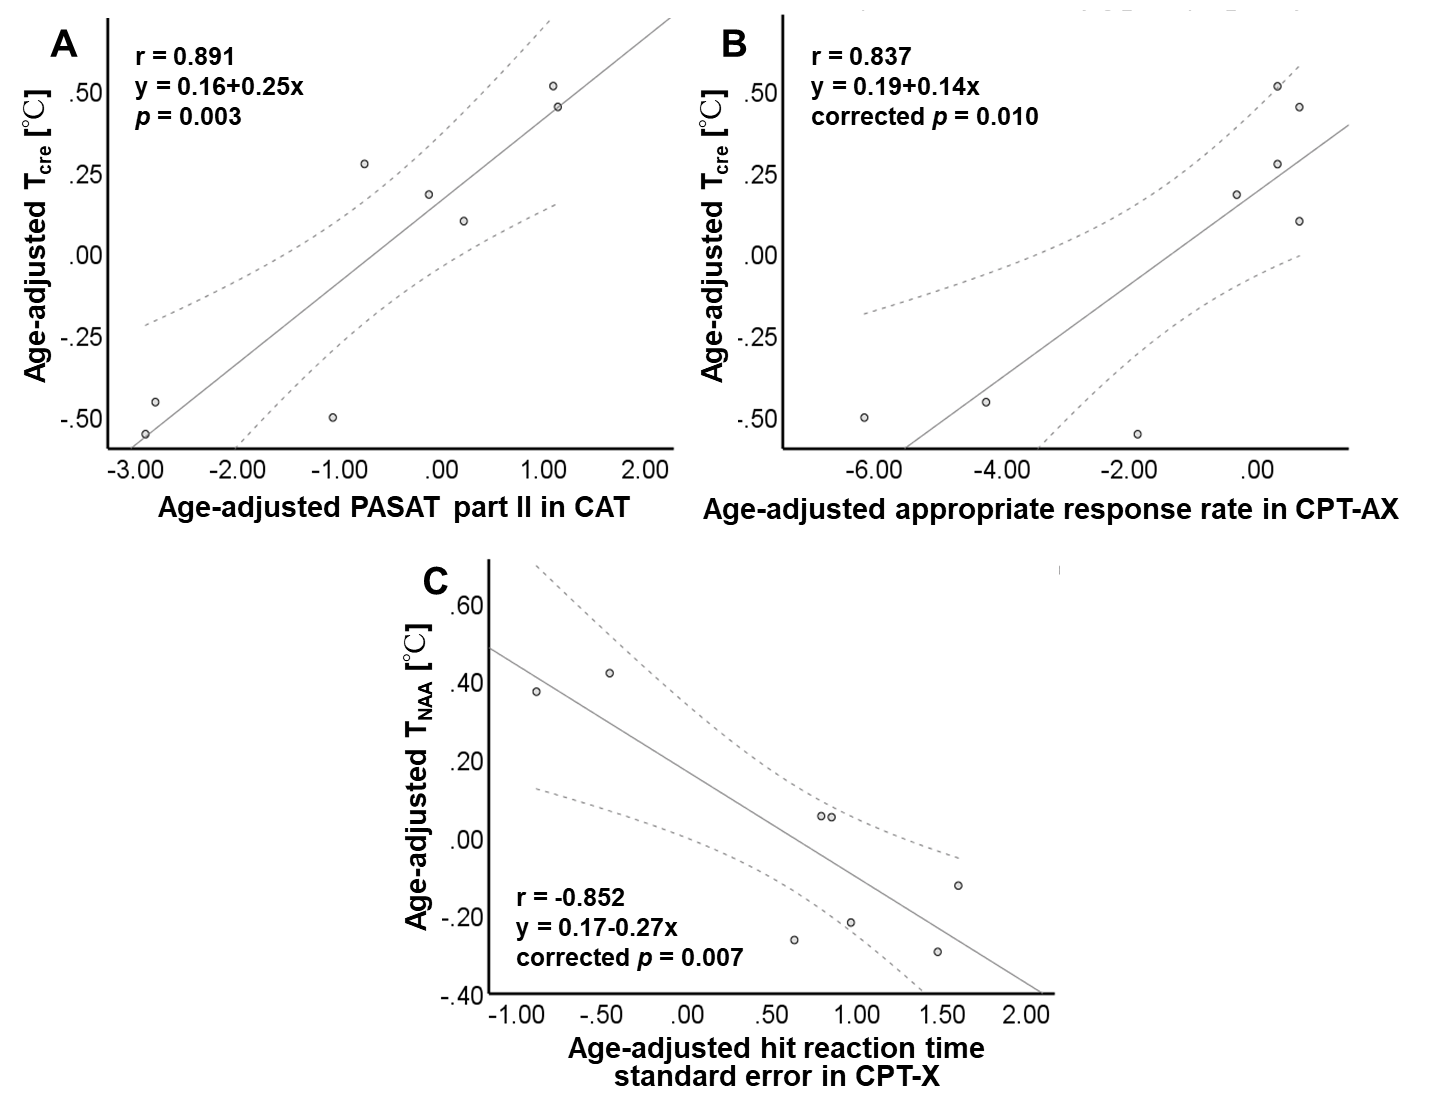
The TBI patient had significantly lower brain temperature (i.e., TAWC, TCho, TCr, and TNAA) than in the control group (p< 0.05) (Table2, Figure2). Strong positive correlations were observed between TCr and paced auditory serial addition test (PASAT) part II in CAT (r= 0.891, p= 0.003) and the appropriate response rate for the CPT-AX (r= 0.837, p= 0.010) (Figure3). There was a strong negative correlation between TNAA and hit reaction time standard error in CAT-X (r= -0.852, p= 0.007) (Figure3). Our observation of brain temperature decrease in the patients may be due to abnormal glucose metabolism. It has been reported that the metabolic rate of glucose is reduced in chronic TBI patients9, although an increase is known in the acute phase10. Our observation of lower brain temperature in the patients may thus be due to decreased glucose metabolism since heat is produced in the metabolic process5. Decreased glucose metabolism and decreased brain temperature may also be due to decreased CBF. Since blood transports glucose to tissues, decreasing CBF can result in diminished glucose availability. A decrease in CBF is also reported in TBI11. Cognitive scores that showed significant correlations are concerned with attention and concentration12,13. Our results may reflect that brain temperature mediates these cognitive tasks. Brain temperature derived from Cr, a marker of energy metabolism in the central nervous system, and that estimated from NAA, a neuronal marker, may become a noninvasive index that can estimate cognitive state.Conclusion
The effect of trauma on brain temperature and the association between brain temperature and cognitive status with mild-to-moderate TBI patients in the subacute-to-chronic phases were evaluated. Our observation of cognitive deficits associated with a significant decrease in brain temperature in the TBI group proposes the potential role of noninvasive brain temperature assessment in TBI.Acknowledgements
The authors thank Dr. Sinyeob Ahn for providing the EPSI sequence. This study was supported by (i) the Grants-in-Aid for scientific research by the Japan Society for Promotion of Science (5K01358, 24591741) and (ii) the Global Center for Biomedical Science and Engineering, Hokkaido University, Japan.References
1. Rabinowitz AR, Levin HS. Cognitive sequelae of traumatic brain injury. Psychiatr Clin North Am. 2014;37(1):1-11.
2. Haarbauer-Krupa J, Pugh MJ, Prager EM, et al. Epidemiology of Chronic Effects of Traumatic Brain Injury. J Neurotrauma. 2021;38(23):3235-3247.
3. Vitaz TW, Jenks J, Raque GH, et al. Outcome following moderate traumatic brain injury. Surg Neurol. 2003;60(4):285-291.
4. Govind V, Gold S, Kaliannan K, et al. Whole-brain proton MR spectroscopic imaging of mild-to-moderate traumatic brain injury and correlation with neuropsychological deficits. J Neurotrauma. 2010;27(3):483-496.
5. Mrozek S, Vardon F, Geeraerts T. Brain temperature: physiology and pathophysiology after brain injury. Anesthesiol Res Pract. 2012;2012:989487.
6. Li X, Abiko K, Sheriff S, et al. The Distribution of Major Brain Metabolites in Normal Adults: Short Echo Time Whole-Brain MR Spectroscopic Imaging Findings. Metabolites. 2022;12(6):543.
7. Maudsley AA, Darkazanli A, Alger JR, et al. Comprehensive processing, display and analysis for in vivo MR spectroscopic imaging. NMR Biomed. 2006;19(4):492-503.
8. Maudsley AA, Goryawala MZ, Sheriff S. Effects of tissue susceptibility on brain temperature mapping. Neuroimage. 2017;146:1093-1101.
9. Provenzano FA, Jordan B, Tikofsky RS, et al. F-18 FDG PET imaging of chronic traumatic brain injury in boxers: a statistical parametric analysis. Nucl Med Commun. 2010;31(11):952-957.
10. Yoshino A, Hovda DA, Kawamata T, Katayama Y, Becker DP. Dynamic changes in local cerebral glucose utilization following cerebral conclusion in rats: evidence of a hyper- and subsequent hypometabolic state. Brain Res. 1991;561(1):106-119.
11. Gaggi NL, Ware JB, Dolui S, et al. Temporal dynamics of cerebral blood flow during the first year after moderate-severe traumatic brain injury: A longitudinal perfusion MRI study. Neuroimage Clin. 2023;37:103344.
12. Tombaugh TN. A comprehensive review of the Paced Auditory Serial Addition Test (PASAT). Arch Clin Neuropsychol. 2006;21(1):53-76.
13. Riccio CA, Reynolds CR, Lowe P, et al. The continuous performance test: a window on the neural substrates for attention?. Arch Clin Neuropsychol. 2002;17(3):235-272.
Figures