0283
Accelerated free-breathing 3D simultaneous Bright and black-blood Whole-Heart Imaging at 0.55T: Comparison to 1.5T.1School of Biomedical Engineering and Imaging Sciences, King’s College London, London, UK, London, United Kingdom, 2Royal Brompton Hospital, Guy's and St Thomas' NHS Foundation Trust, London, United Kingdom, 3Institute for Biological and Medical Engineering, Pontificia Universidad Católica de Chile, Santiago, Chile, Santiago, Chile, 4School of Engineering, Pontificia Universidad Católica de Chile, Santiago, Chile, Santiago, Chile, 5MR Research Collaborations, Siemens Healthcare Limited, Camberley, United Kingdom, Camberley, United Kingdom, 6Escuela de Ingeniería, Pontificia Universidad Católica de Chile, Santiago, Chile, Santiago, Chile, 7Millennium Institute for Intelligent Healthcare Engineering, Chile, Santiago, Chile, 8Technical University of Munich, Germany; Institute of Advanced Study, Munich, Germany, Santiago, Chile
Synopsis
Keywords: Vessel Wall, Low-Field MRI, bright- and black-blood whole heart, vessel lumen,vessel wall
Motivation: Bright-blood and black-blood MRI is fundamental for the comprehensive assessment of cardiac disease.Low field MRI promises high quality imaging at lower cost and improved patient accessibility.3D bright-blood and black-blood whole-heart imaging applications at low-field are limited.
Goal(s): To implement and evaluate the diagnostic quality of a novel framework for simultaneous 3D whole-heart bright-and black-blood(BOOST) imaging at 0.55T.
Approach: 3D whole-heart BOOST including image-based navigation, motion corrected reconstruction and patch-based denoising was evaluated at 0.55T.Diagnostic capabilities of 3D BOOST was evaluated versus its counterpart at 1.5T.
Results: 3D whole-heart BOOST at 0.55T offers good quality imaging, that is comparable to its counterpart at 1.5T.
Impact: This study demonstrates that high-quality bright- and black-blood 3D whole-heart imaging can be achieved at 0.55T CMR, showing comparable image and diagnostic quality to the current clinical standard in both healthy subjects and clinical patients.
Introduction
Low field MRI at 0.55T is promising to offer high quality imaging at lower cost,with increased patient comfort, implant safety, reduced implant-induced image artefacts and facilitate MRI-guided catheterizations[1].Bright-blood and black-blood MRI is clinically indicated for the comprehensive assessment of congenital heart disease and pre-interventional evaluation[2-4].Conventionally, bright-blood and black-blood images are acquired sequentially in different acquisitions with different geometries.A recently introduced sequence for bright-and black-blood magnetic resonance angiography (iT2Prep-BOOST) enabled high-quality, simultaneous 3D whole-heart anatomy and vessel-wall imaging at 1.5T[5].The 3D whole-heart free-breathing iT2Prep-BOOST, including image-based navigation, respiratory motion-corrected reconstruction and low-rank based denoising[6],was implemented at 0.55T.In this study, we evaluated the diagnostic quality of iT2Prep-BOOST at 0.55T for the assessment of congenital heart disease, and compared it to its 1.5T counterpart.Methods
The implemented 3D free-breathing, ECG-triggered, bSSFP iT2prep-BOOST research sequence utilised an interleaved acquisition framework. A T2 prepared-Inversion Recovery module is applied before data acquisition in odd heartbeats and no preparation is applied in even heartbeats [5]; generating two bright-blood datasets. The first bright-blood dataset can be used for lumen visualization, while subtraction of the two bright-blood datasets is used to create the black-blood dataset for vessel wall visualization. Ten healthy subjects and 2 patients with adult congenital heart disease were scanned with this framework at 0.55T and 1.5T (MAGNETOM Free.Max and MAGENTOM Aera, Siemens Healthcare, Erlangen, Germany). The framework incorporated undersampled acquisition via variable-density Cartesian trajectory [7], which was 3-fold accelerated for the healthy volunteers and 4-fold for the patients. Imaging parameters at 0.55T include: 3D bSSFP readout, FOV = 312 x 312 x 120 mm, resolution = 1.5 mm3, flip-angle HB1/HB2 = 110/80 deg, TR = 5.3 ms, TE = 2.65 ms, T2-Prep duration = 50 ms, IR TI = 90 ms, bandwidth = 800 Hz/px. Imaging parameters at 1.5T include: bSSFP readout, FOV=400 × 300 × 104 mm, spatial resolution=1.5 mm3isotropic, flip angle=90°, TE/TR =1.41/3.24 ms, bandwidth=930 Hz/px. In odd heartbeats, a T2Prep-IR preparation module was used, with a T2Prep duration of 40 msec, and inversion time (TI) = 110 msec, while in even heartbeats only fat saturation was used. Six-channel and 18-channel anterior coils were employed at 0.55T and 1.5T, in combination with their respective spine coil. Diagnostic quality of the cardiac chambers and thoracic vasculature with regards to sharpness of vascular borders and robustness to artefacts was assessed and compared between the 0.55T and 1.5T acquisitions using a 1-5 Likert scale [(1: non-diagnostic, 5: excellent depiction of cardiac/vascular borders, ≥3: diagnostic), (1: non-diagnostic, severe artifact, 5: minimal artifact, ≥3: diagnostic)]. The signal ratio between blood and myocardium was computed in the respective intrapericardial structures. Bland-Altman plots were used to assess the agreement and bias in aortic root co-axial measurements and linear correlation was used to assess the agreement of vessel wall thickness at the level of mid-ascending aorta.Results
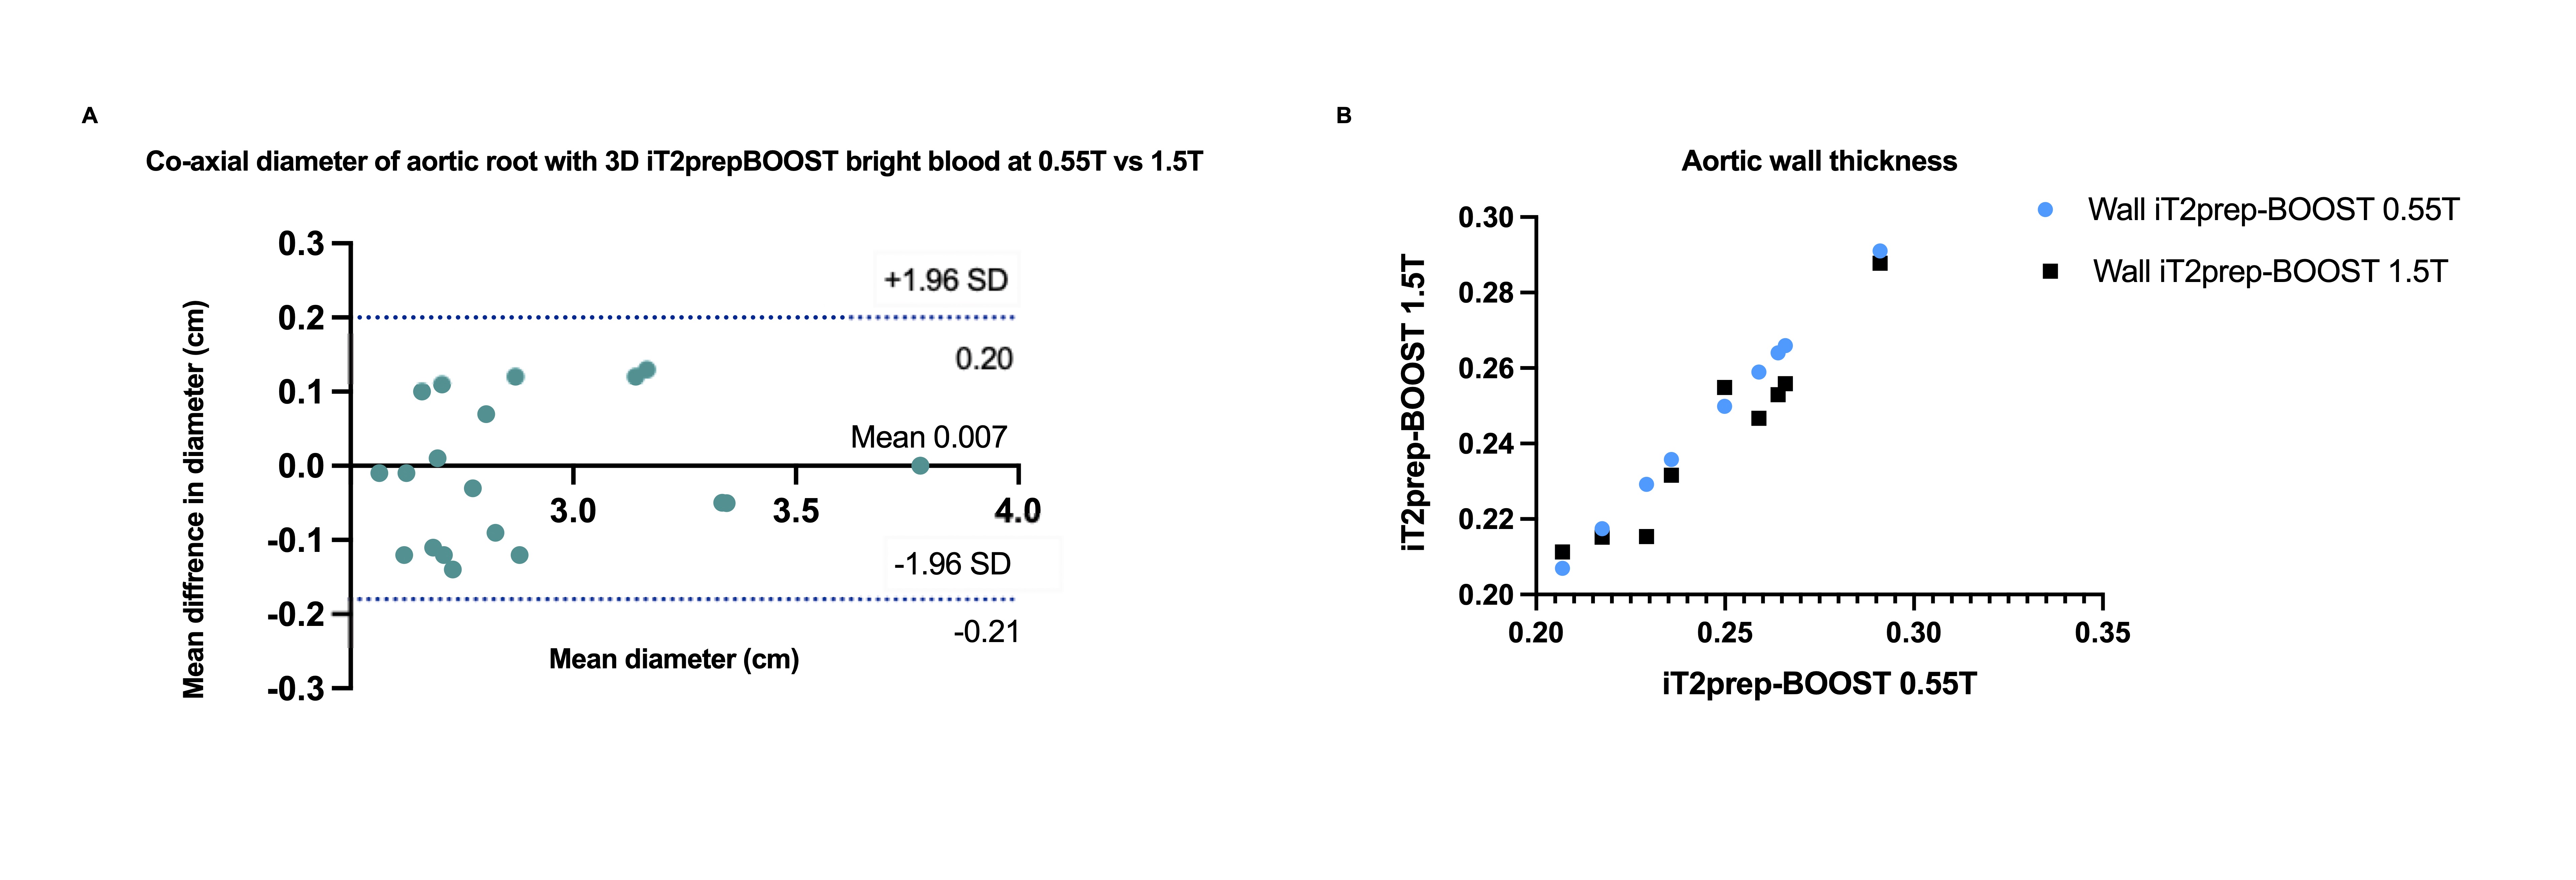
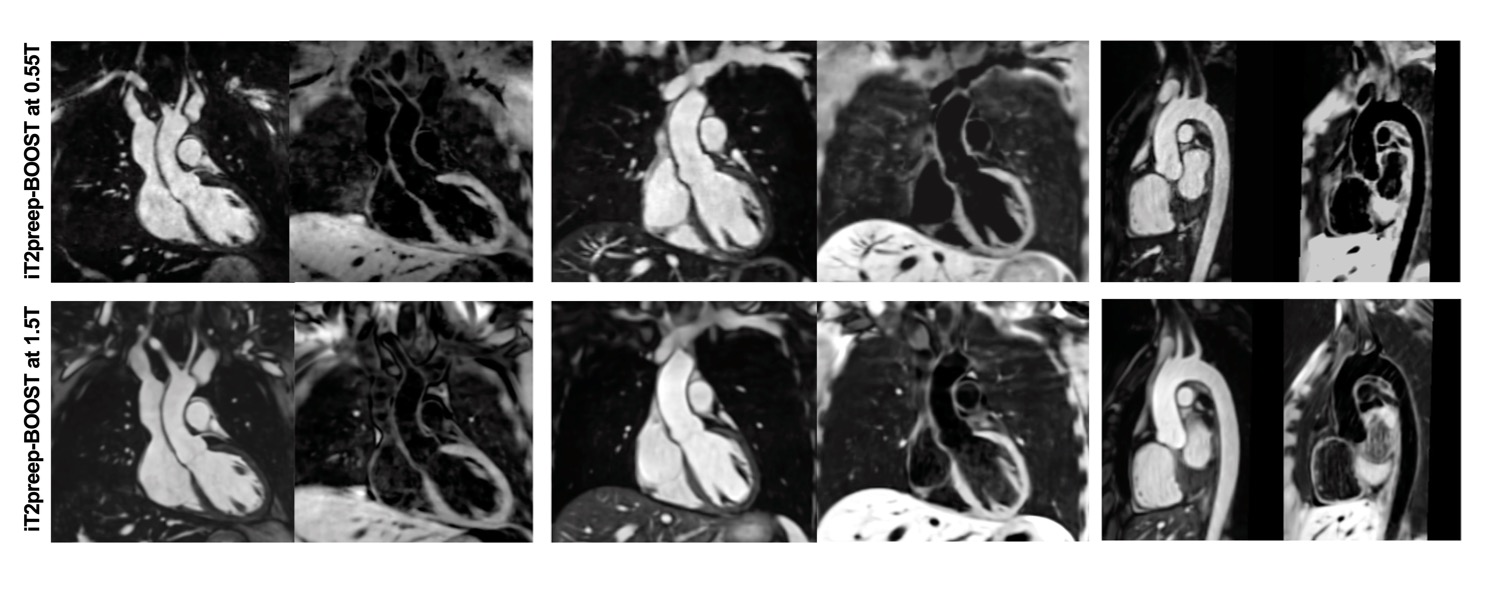
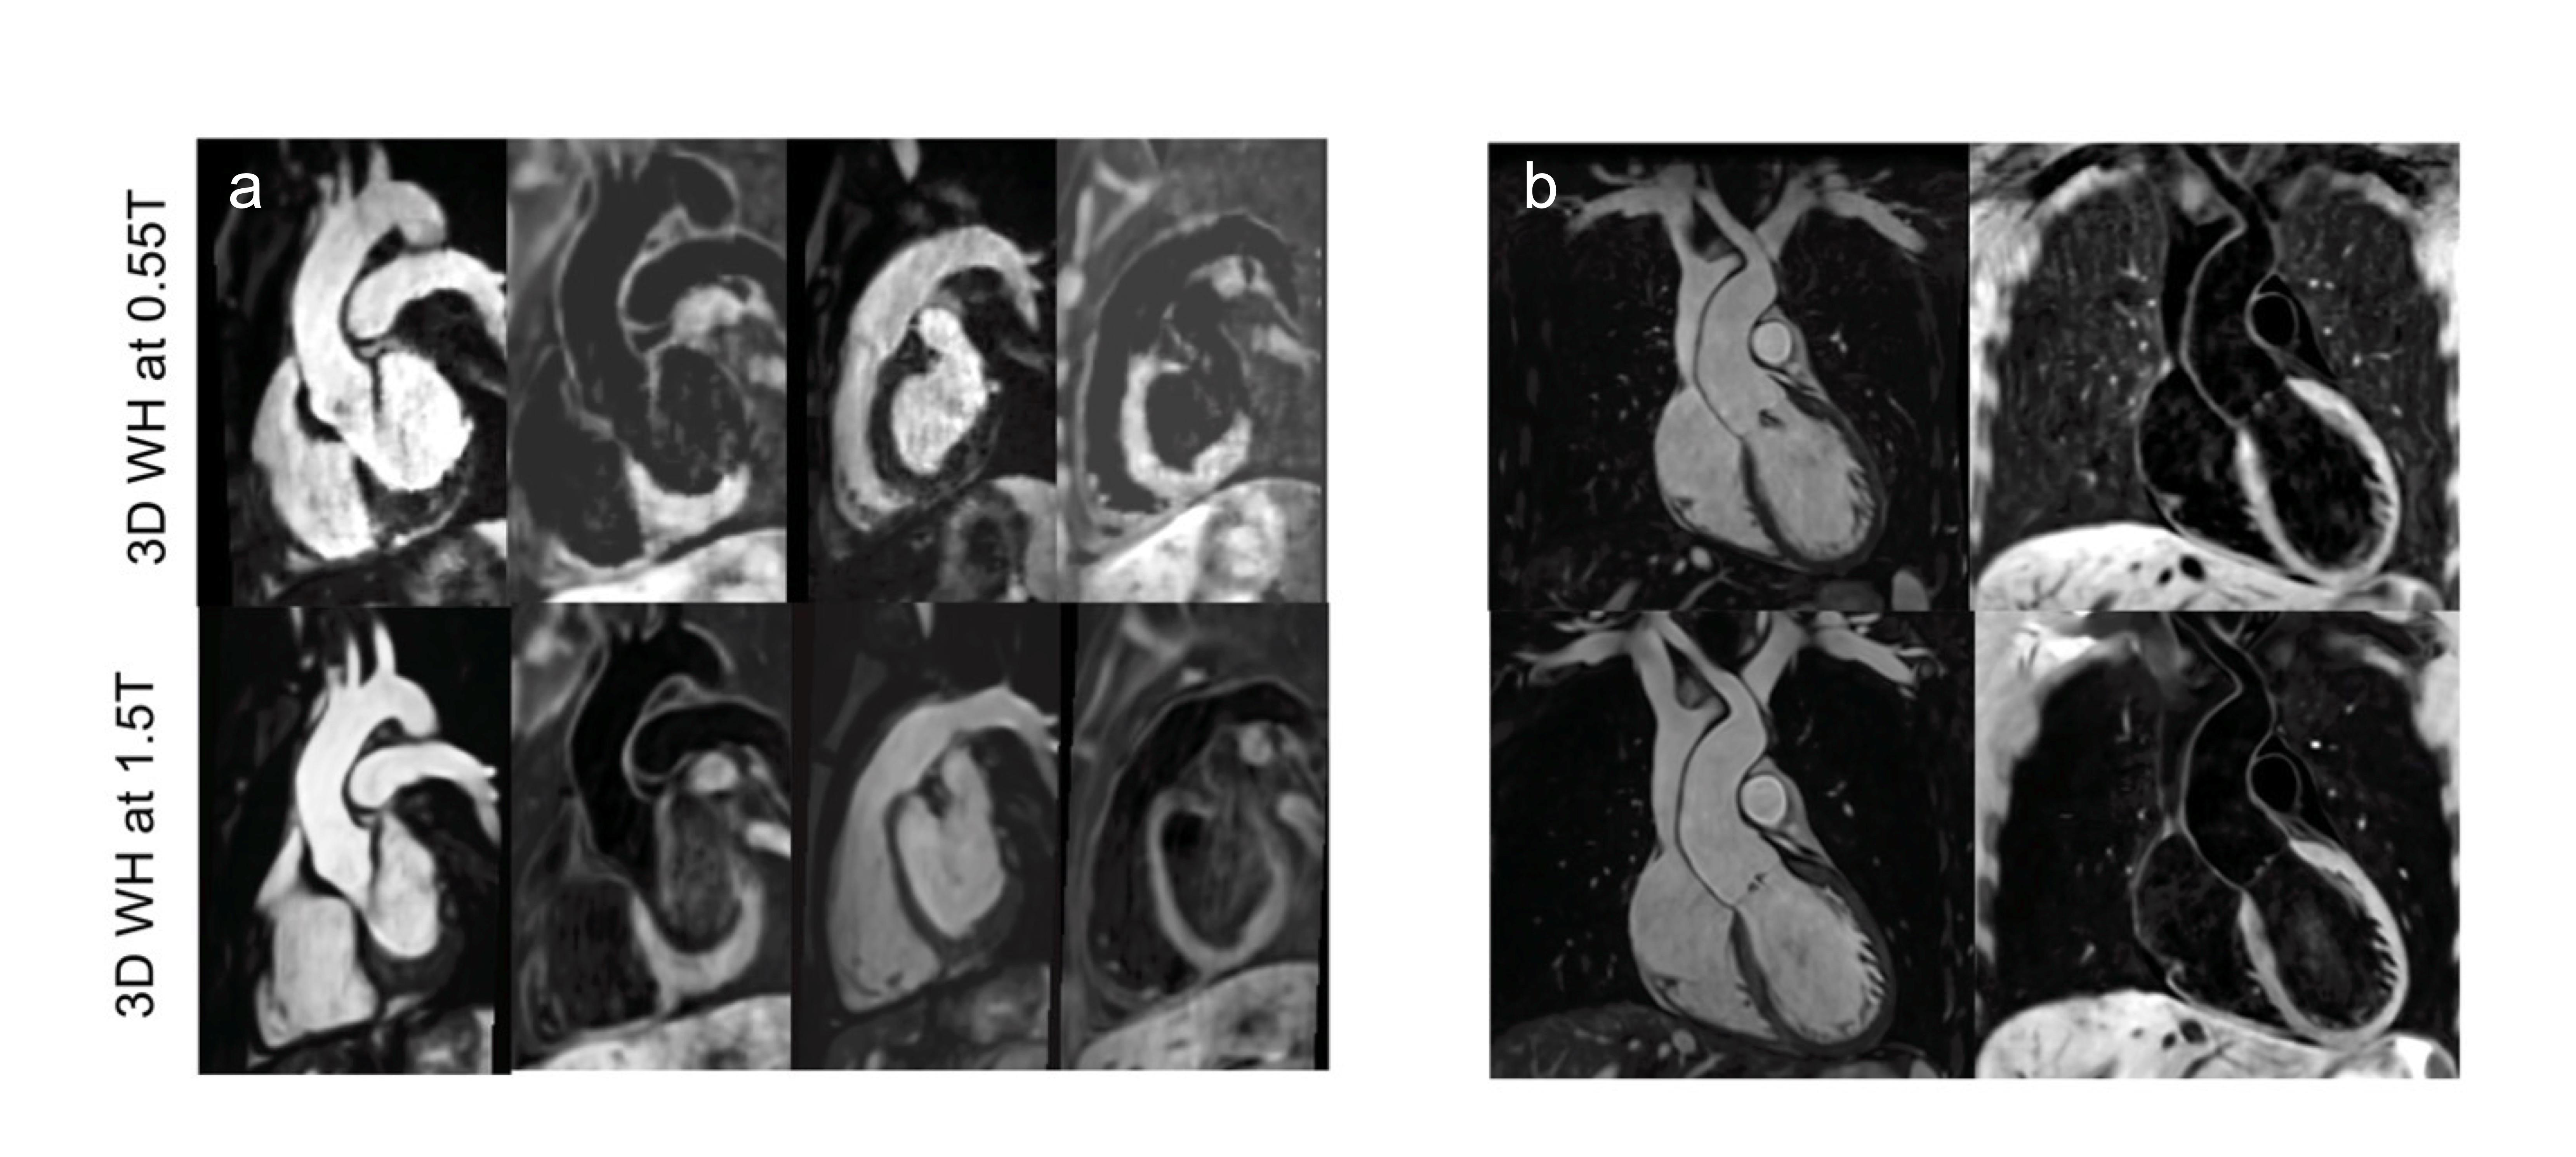
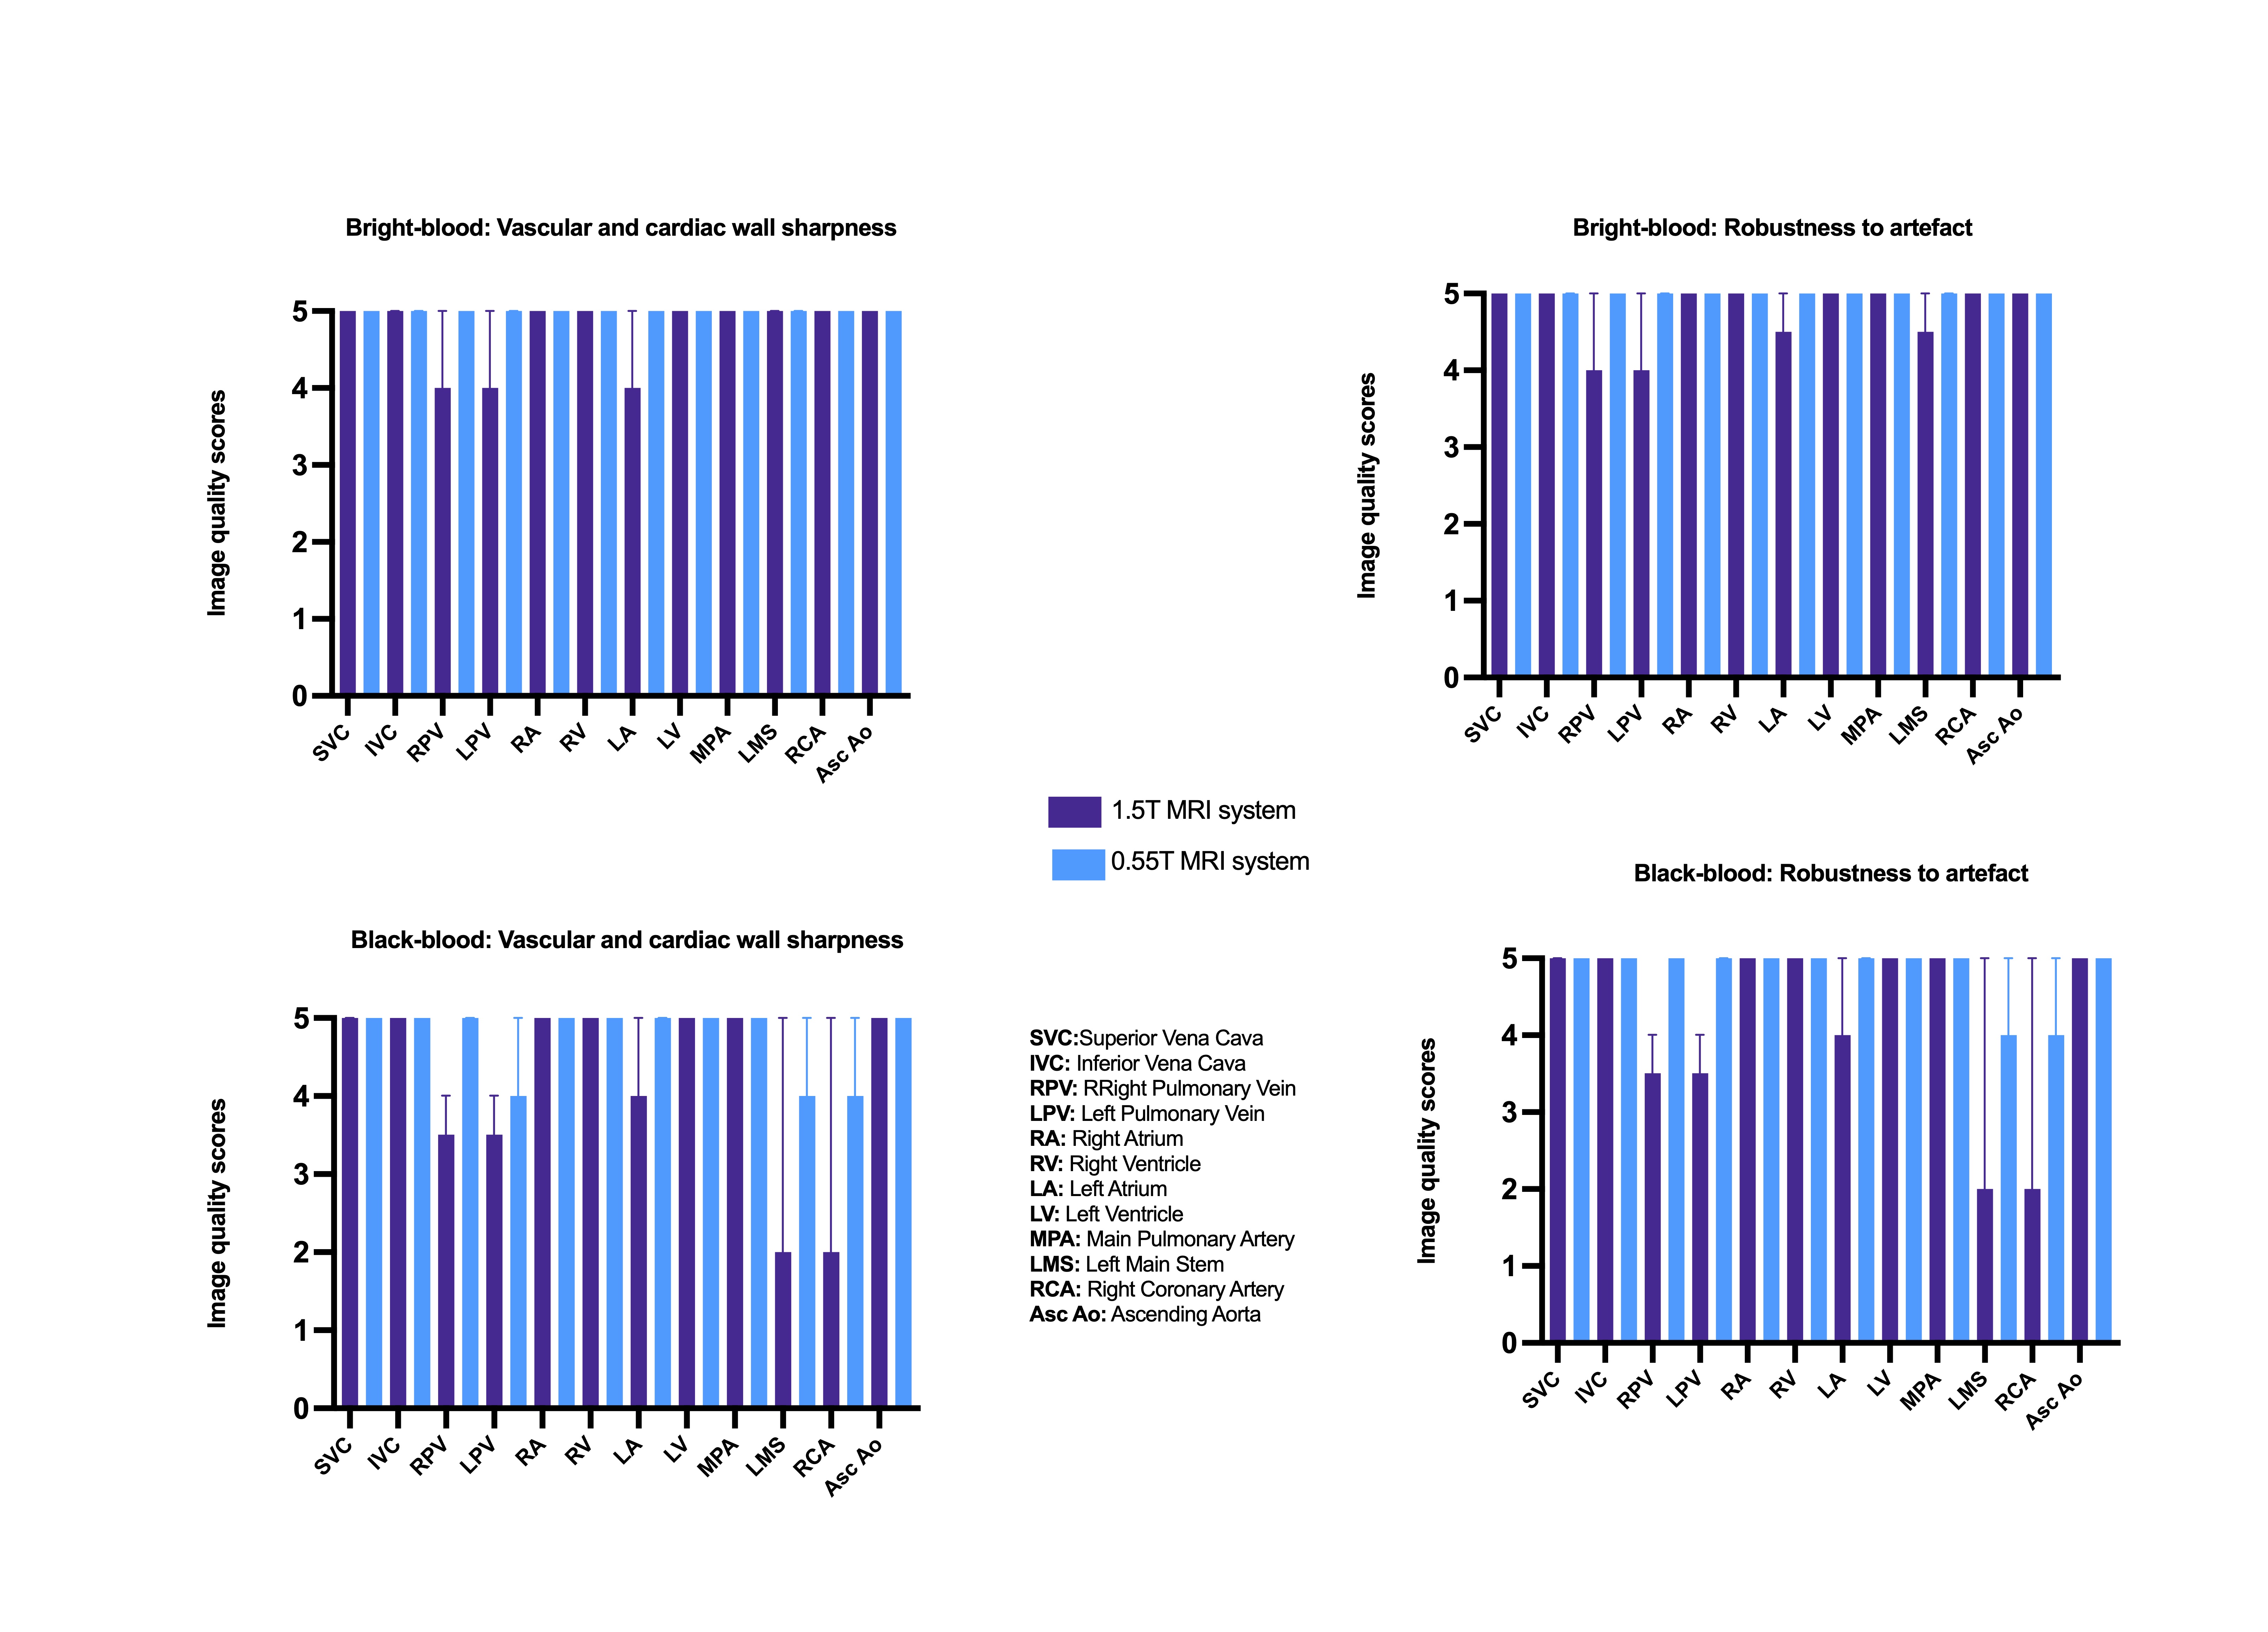
Ten healthy subjects and 2 patients (mean age 30±2 years, 7 female) were scanned. Scan time was shorter at 1.5T, 5.1(4.8, 5.2)min vs 7(6.1, 8.9)min,p=0.03. Good image quality for all cardiovascular segments was achieved with the proposed 3D iT2prep-BOOST framework at 0.55T with both contrasts, as shown in Figures 1 and 2 for healthy subjects and patients respectively. Image quality scores were comparable between the two approaches (Figure 3) for the majority of the intrapericardiac structures. Delineation of the pulmonary veins and coronary arteries for black-blood imaging was superior at 0.55T. Signal ratio comparison demonstrated comparable results with both approaches for all structures, except the pulmonary and the systemic veins and left atrium where the proposed approach at 0.55T was superior (Figure 4). Narrow limits of agreement were found between the 0.55T and the 1.5T for the aortic root measurements and strong correlation with R2 = 0.94 for the aortic wall measurements (Figure 5).Discussion
The motion-corrected free-breathing 3D iT2prep-BOOST sequence was implemented at 0.55T and demonstrated comparable or superior image and diagnostic quality to the respective sequence at 1.5T in a clinically feasible scan time. The increased field homogeneity at 0.55T diminishes off-resonance artefacts in anatomical landmarks at the lung-vascular interface, such as pulmonary veins and left atrium. Additionally, the low-rank patch-based denoising has potentially superior performance in the 0.55T dataset of increased homogeneity, improving the delineation of systemic veins and coronary arteries [7]. Further evaluation in a larger cohort of patients with congenital heart disease is required to evaluate and establish 3D iT2prep-BOOST imaging at 0.55T.Conclusion
High-quality 3D iT2prep-BOOST imaging is feasible at 0.55T. Further evaluation in a larger cohort of patients with congenital heart disease is required to evaluate and establish its application.Acknowledgements
No acknowledgement found.References
1.Campbell-Washburn, A.E., et al., Opportunities in Interventional and Diagnostic Imaging by Using High-Performance Low-Field-Strength MRI. Radiology, 2019. 293(2): p. 384-393.
2.Kramer, C.M., et al., Standardized cardiovascular magnetic resonance imaging (CMR) protocols: 2020 update. Journal of Cardiovascular Magnetic Resonance, 2020. 22(1): p. 17.
3.Chaturvedi, A., et al., MRI evaluation prior to Transcatheter Aortic Valve Implantation (TAVI): When to acquire and how to interpret. Insights Imaging, 2016. 7(2): p. 245-54.
4.Fotaki, A., et al., Free-breathing, Contrast Agent–free Whole-Heart MTC-BOOST Imaging: Single-Center Validation Study in Adult Congenital Heart Disease. Radiology: Cardiothoracic Imaging, 2023. 5(1): p. e220146.
5.Munoz, C., et al., Simultaneous Highly Efficient Contrast-Free Lumen and Vessel Wall MR Imaging for Anatomical Assessment of Aortic Disease. Journal of Magnetic Resonance Imaging, 2023. 58(4): p. 1110-1122. 6. Castillo-Passi C, Crabb MG, Muñoz C et al, Simultaneous 3D Whole-Heart Bright-Blood and Black-Blood Imaging with iNAV-based Non-Rigid Motion-Corrected Reconstruction at 0.55T, 3-8 June 2023, Toronto, Canada.
7.Prieto, C., et al., Highly efficient respiratory motion compensated free-breathing coronary MRA using golden-step Cartesian acquisition. J Magn Reson Imaging, 2015. 41(3): p. 738-46.
8.Simonetti, O.P. and R. Ahmad, Low-Field Cardiac Magnetic Resonance Imaging: A Compelling Case for Cardiac Magnetic Resonance's Future. Circ Cardiovasc Imaging, 2017. 10(6).
Figures
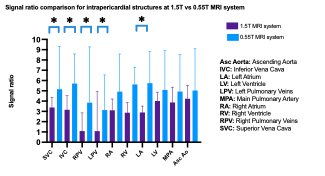
Signal ratio comparison demonstrates comparable results at 0.55T and 1.5T for the right heart chambers, the left ventricle and the great arteries. The systemic veins, the pulmonary veins and left atrium had superior signal ratio with iT2prep-BOOST at 0.55T.
asterisks (*) indicate P<0.05 in signal ratio comparison