0275
Robust measurement of T2 relaxation time in the developing fetal brain using ultrafast MOLED technique1Department of Electronic Science, Xiamen University, Xiamen, China, 2Department of Magnetic Resonance Imaging, The First Affiliated Hospital of Zhengzhou University, Zhengzhou University, Zhengzhou, China, 3Clinical & Technical Solutions, Philips Healthcare, Shenzhen, China, 4Department of Imaging Sciences, University of Rochester, Rochester, NY, United States
Synopsis
Keywords: Quantitative Imaging, Relaxometry, Fetal Brain, T2 mapping
Motivation: Unpredictable and intense motion poses serious challenges to quantitative imaging of the fetal brain.
Goal(s): To evaluate the value of single-shot multiple overlapping-echo detachment acquisition (MOLED) imaging technique in accurately T2 mapping the developing fetal brain.
Approach: Single-shot MOLED imaging was utilized for motion-robust T2 mapping in the developing fetal brain. The method was tested on phantom and in vivo, and a scan-rescan assessment was performed on nine fetuses.
Results: MOLED T2 mapping strongly agreed with single-echo spin echo T2 (r = 0.996 in phantom). The median intra-subject coefficient of variation of T2 values between scan-rescan tests across the nine subjects is 1.385%.
Impact: MOLED is a motion-robust, accurate, and repeatable method for T2 mapping of the whole developing fetal brain in only a few seconds. This method makes it feasible to use T2 maps to quantify early myelination in the fetal brain.
Introduction
Fetal brain T2 values derived from in-utero MRI have the potential to elucidate the development of early brain and monitor myelination progression.1,2 However, a reliable method is needed for acquiring fetal brain T2 values due to unconstrained fetal movements, maternal respiration interference, and long relaxation time. To address these challenges, we utilized the single-shot multiple overlapping-echo detachment (MOLED) imaging method proposed by our group3,4 to obtain fetal brain T2 maps. Our previous studies have demonstrated the robustness of MOLED against patient motion5 and inhomogeneous B1 field, and its ability to quantify large T2 values in a single shot at 200 ms-level using multi-echo-train acquisition6.Methods
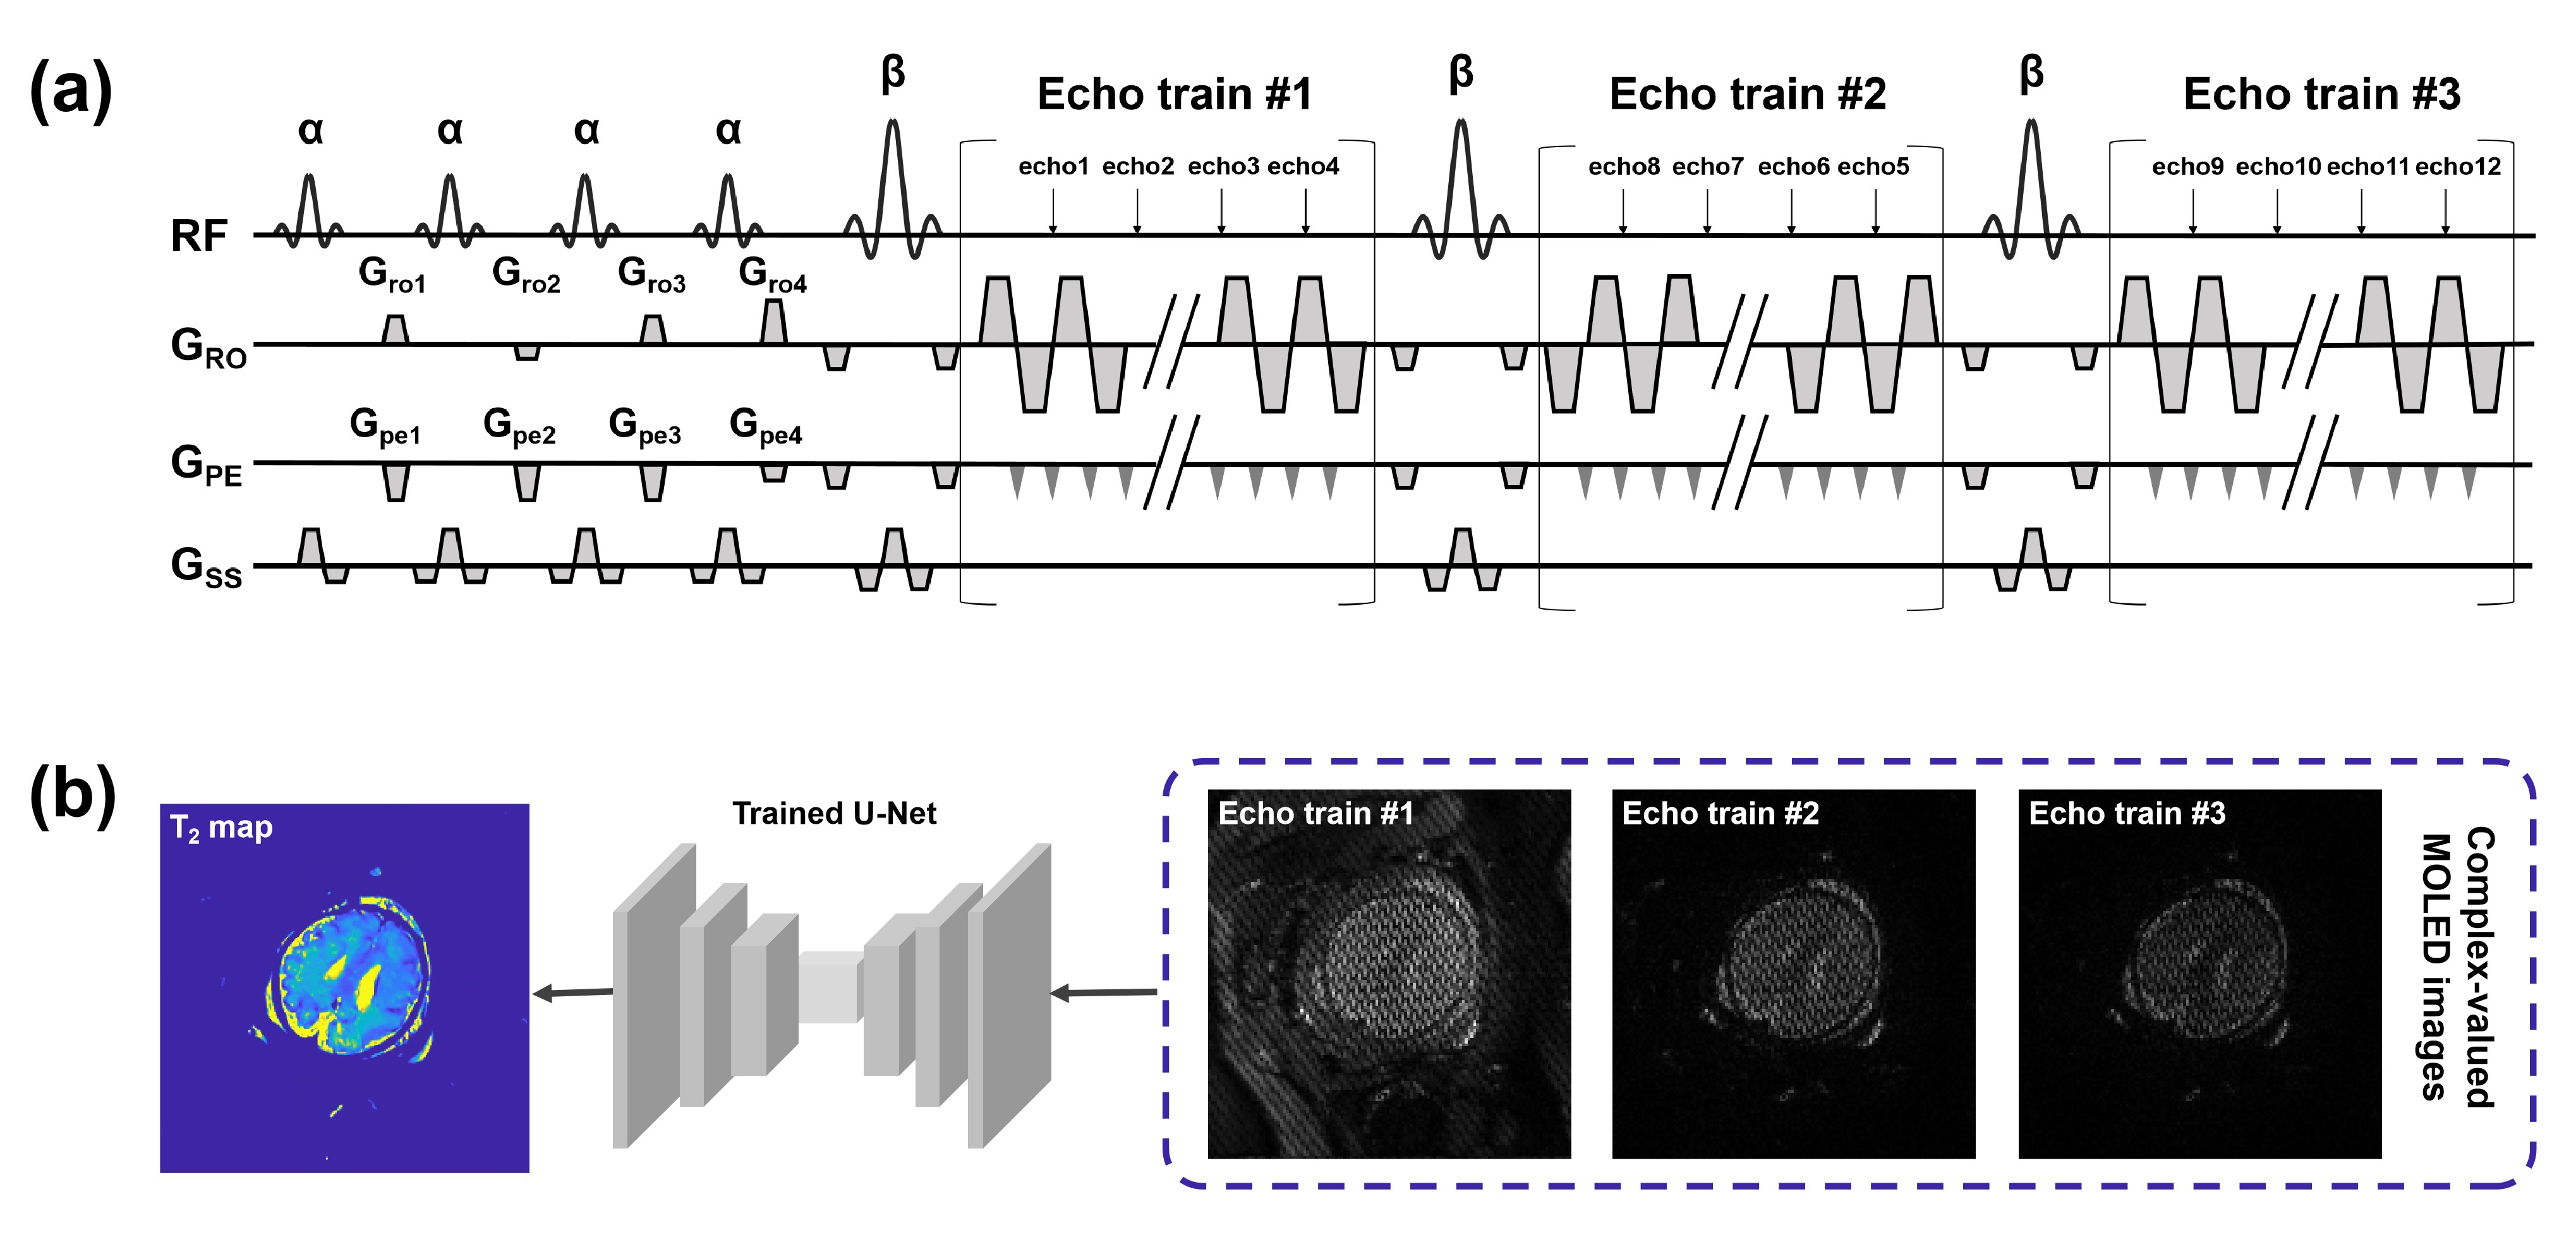
Data acquisition and reconstruction: MRI data of phantom and in vivo experiments were acquired from a whole-body MRI system at 3T (Magnetom Prisma TIM; Siemens Healthineers, Erlangen, Germany) with a 32-channel abdomen coil. The MOLED sequence is shown in Figure 1a, in which four excitation pulses and paired echo-shifting gradients were used to generate multiple distinct T2-weighted echoes in a continuous EPI readout. Twelve main echoes were collected from three echo trains, encompassing nine different echo times (TEs), which were fixed to 22, 52, 82, 110, 132, 156, 186, 215, and 244 ms to accurately quantify the T2 value of the fetal brain. The four excitation pulses had the same flip angle α = 30°, and the flip angle of refocusing pulse β = 180°. As shown in Figure 1b, a U-Net was trained on synthetic data generated through Bloch simulation.5 Real MOLED images were fed into the well-trained U-Net to get T2 maps.Phantom experiments: Based on the range of preterm infant brain T2 values previously reported,7 the T2 range of the MnCl2 solution was designed to be 80-300 ms. The MOLED acquisition parameters were as follows: field of view = 230 × 230 mm2, matrix size = 128 × 128, slice number = 21, slice thickness = 3 mm, slice gap = 1 mm, TR = 8000 ms, GRAPPA factor = 2. The scan took about 250 ms per slice. To test the accuracy of our method, a single-echo spin echo sequence was implemented with seven TEs (40, 80, 100, 120, 160, 200, 240 ms) to provide reference T2 maps, and the total scan time was 1 hour and 24 minutes.
In vivo fetal brain experiments: The MOLED acquisition parameters of the in-vivo study were the same as those used in the phantom experiment. Nine fetuses underwent a scan-rescan test of the MOLED sequence. The time interval between the two scans was 3-5 minutes.
Results
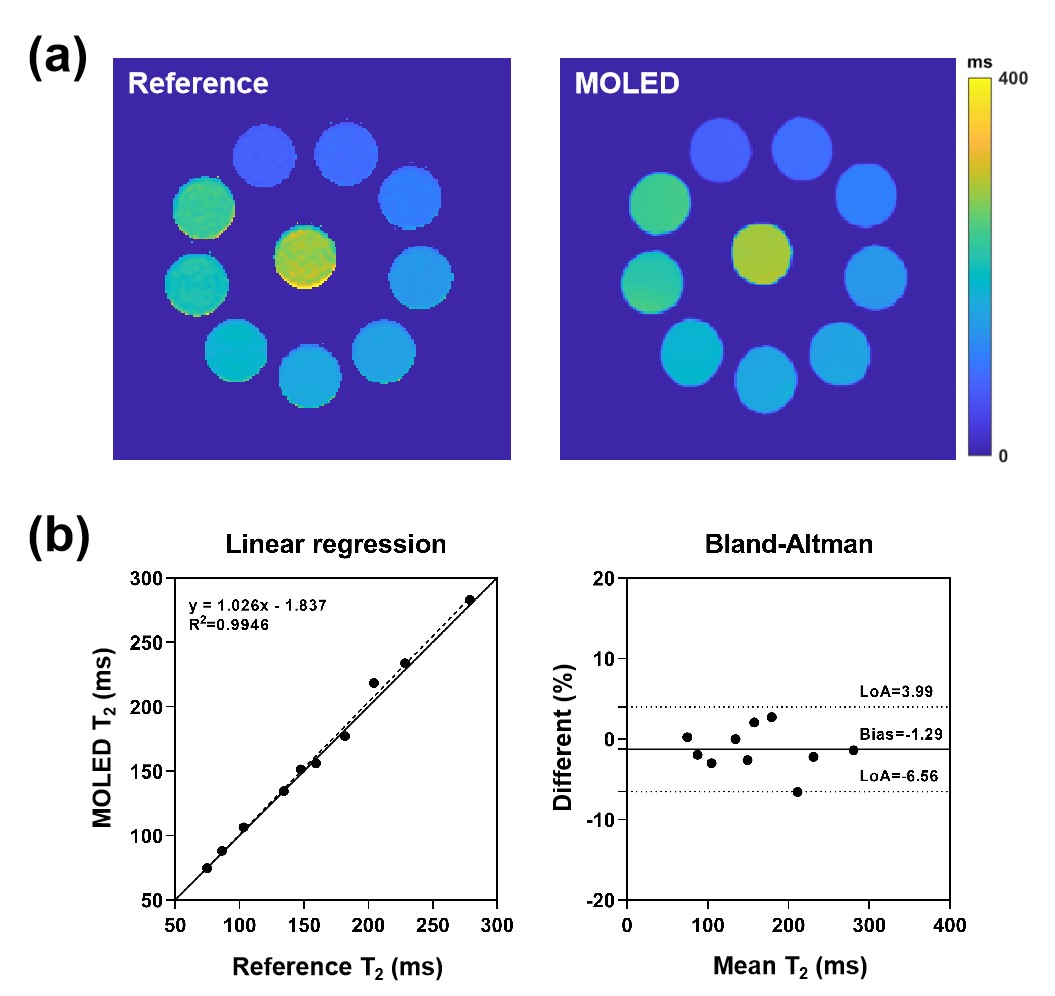
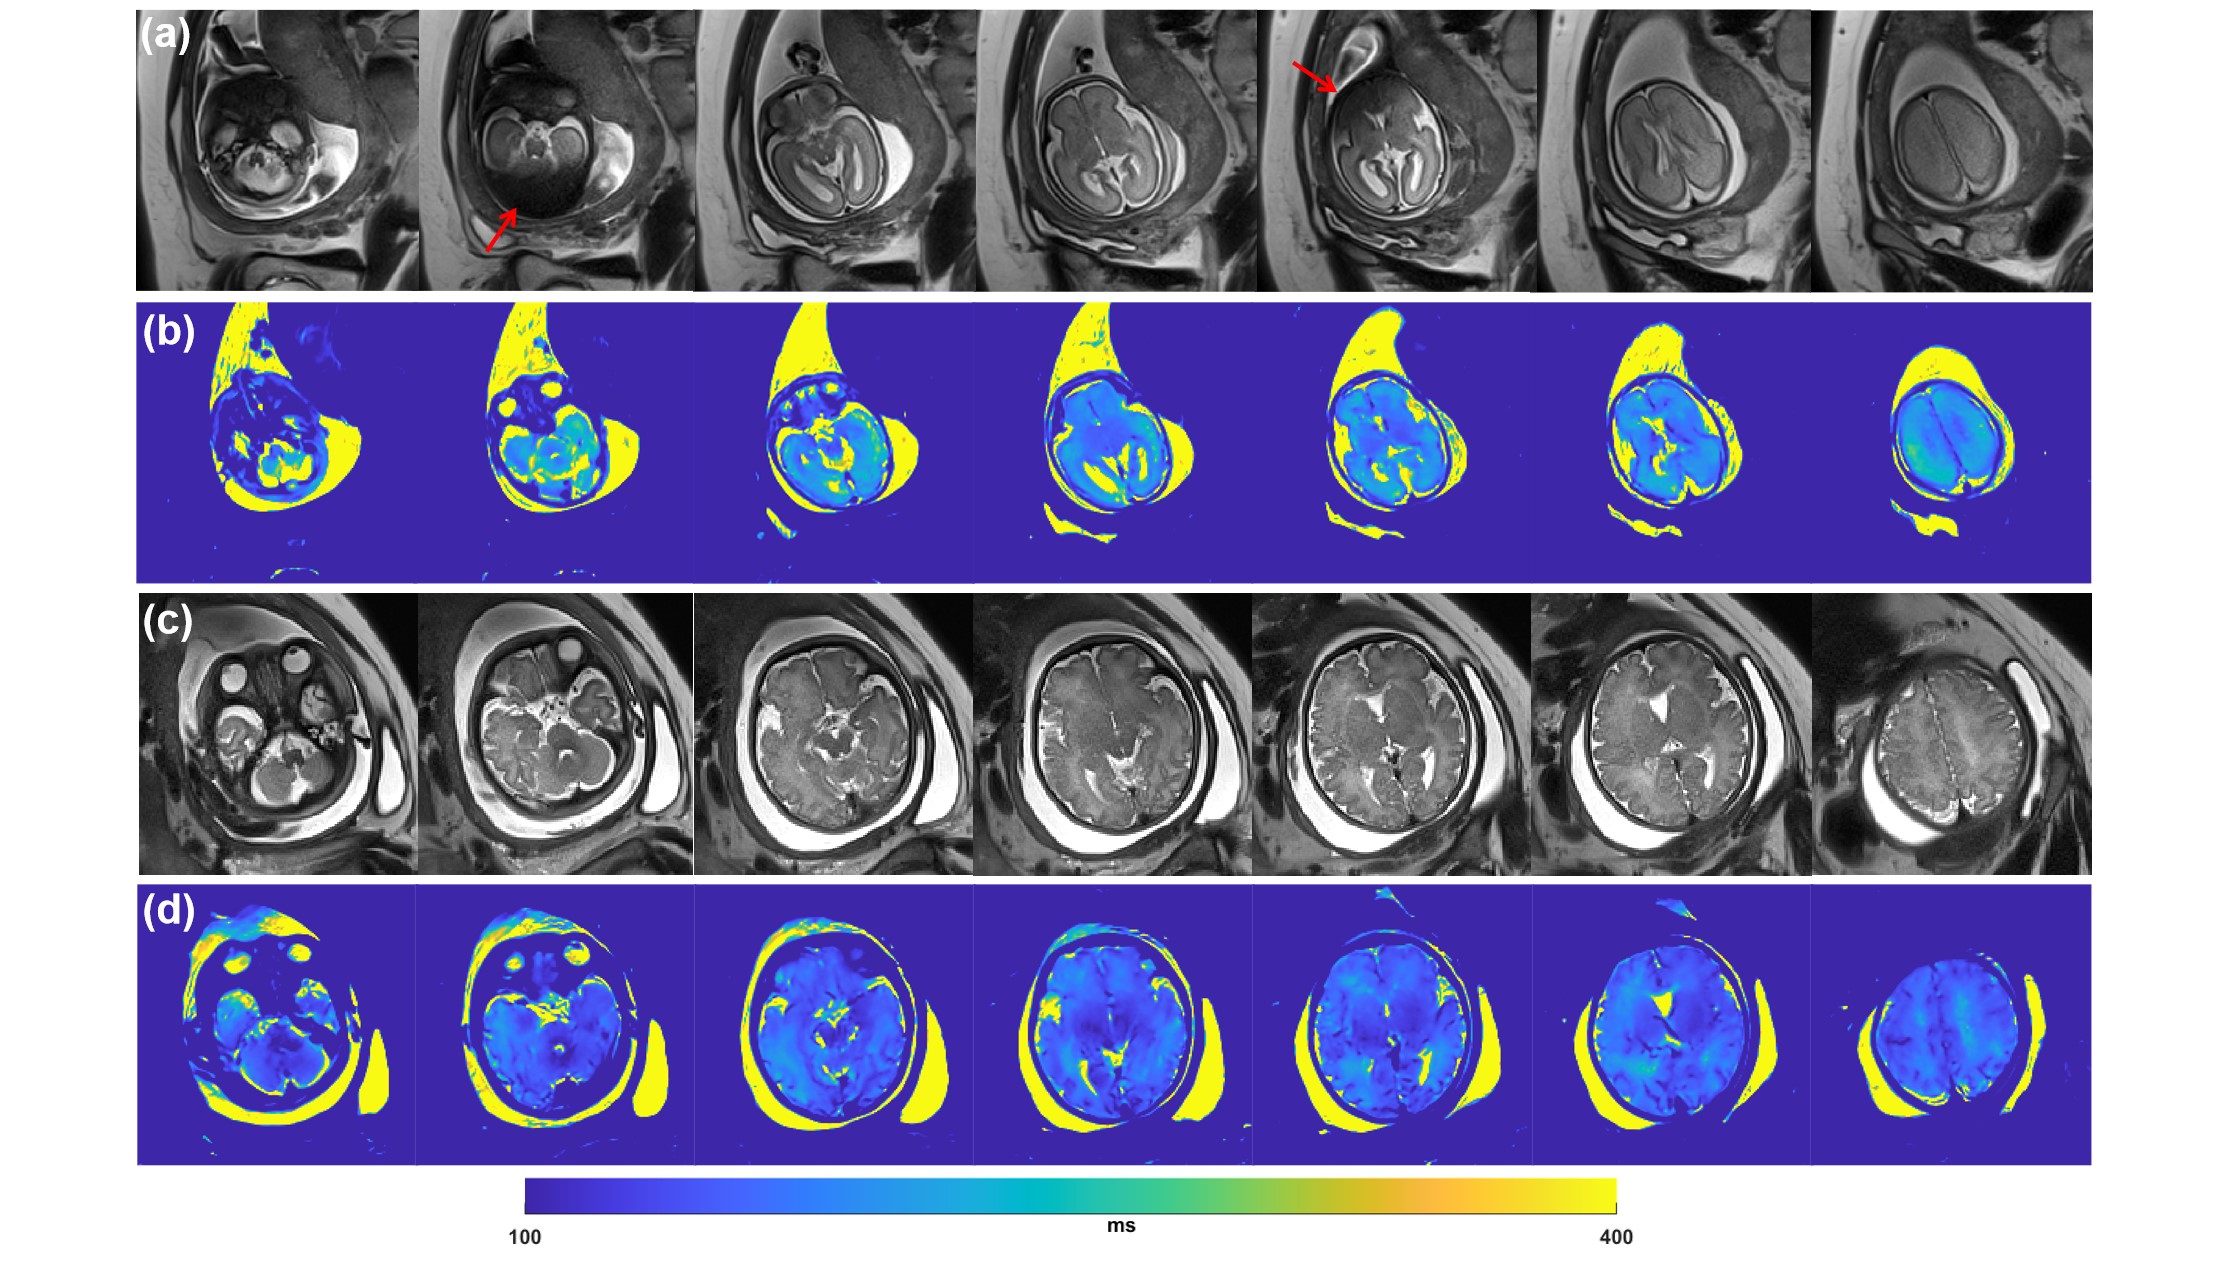
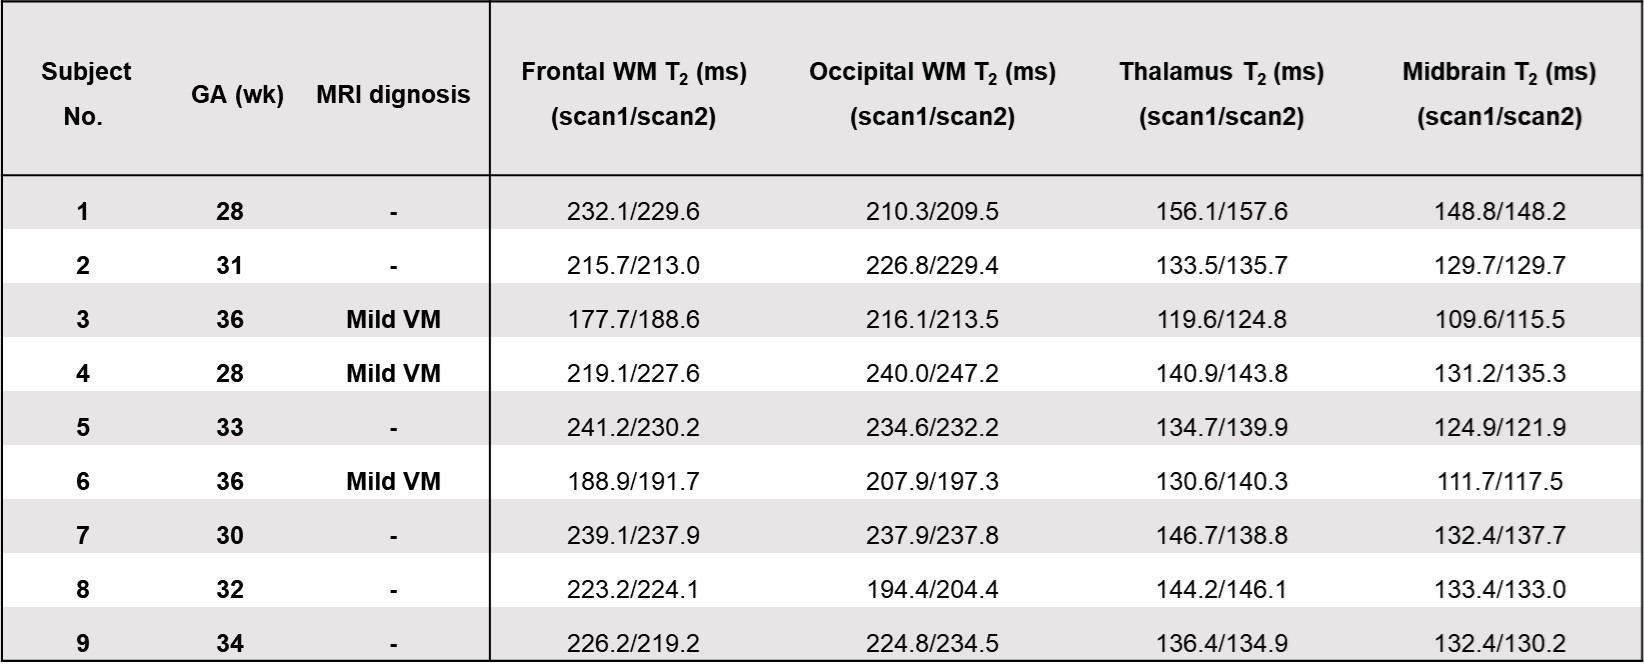
Figure 2 shows the T2 mapping results of the phantom. A close match was observed visually and quantitatively between MOLED T2 and reference T2 values. In the quantitative comparison, the Pearson’s correlation coefficient was 0.996, R2 was 0.994 (p < 0.0001), and the bias was -1.29%. Figure 3 shows representative T2 maps acquired from a healthy 25-week gestational fetal brain and a 36-week gestational fetal brain with slight enlargement of the cavum septi pellucidi. Compared with the clinical T2-weighted image (Figure 3c), evident and similar structures were observed in the MOLED T2 maps (Figure 3d). Although partial signal loss was observed in the T2-weighted images due to intra-slice motion (Figure 3a), no clear variation was noticed in the T2 maps (Figure 3b and Figure 3d). The T2 maps of the 36-week gestational fetal brain reveal decreased T2 values in white matter, deep gray matter, and brainstem, along with a more intricate morphology of sulci and gyri, in contrast to the 25-week one. A detailed overview of the demographic and clinical characteristics of the nine fetuses undergone scan-rescan tests and their T2 values of various regions are presented in Figure 4. It shows that high intrasubject repeatability (median CV is 1.385%) was achieved in the scan-rescan test.Discussion and conclusion
In this study, we have demonstrated that single-shot MOLED is a motion-robust, accurate, and repeatable method for T2 mapping of the whole developing fetal brain. The results show that the MOLED T2 method has excellent accuracy in phantom imaging and better performance against fetal motion than the conventional T2-weighted imaging. Notably, the T2 maps of different gestational ages present reduced T2 values both visually and quantitatively. Future work includes exploring the feasibility of T2 mapping via MOLED method in quantifying early myelination of the fetal brain.Acknowledgements
This work was supported in part by the National Natural Science Foundation of China under grant numbers 12375291, 82071913 and 22161142024.References
1. Prayer D, Kasprian G, Krampl E, et al. MRI of normal fetal brain development. Eur J Radiol. 2006;57(2):199-216.
2. Moltoni G, Talenti G, Righini A. Brain fetal neuroradiology: a beginner’s guide. Translational Pediatrics. 2021;10(4):1065-1077.
3. Zhang J, Wu J, Chen SJ, et al. Robust single-shot T2 mapping via multiple overlapping-echo acquisition and deep neural network. IEEE Trans Med Imaging. 2019;38(8):1801-1811.
4. Cai CB, Wang C, Zeng YQ, et al. Single-shot T2 mapping using overlapping-echo detachment planar imaging and a deep convolutional neural network. Magn Reson Med. 2018;80:2202-2214.
5. Yang QQ, Lin YH, Wang JC, et al. Model-based synthetic data-driven learning (MOST-DL): Application in single-shot T2 mapping with severe head motion using overlapping-echo acquisition. IEEE Trans Med Imaging. 2022;41:3167-3181.
6. Ouyang BY, Yang QZ, Wang XY, et al. Single-shot T2 mapping via multi-echo-train multiple overlapping-echo detachment planar imaging and multitask deep learning. Med Phys. 2022;49:7095-7107.
7. Williams LA, Gelman N, Picot PA, et al. Neonatal brain: Regional variability of in vivo MR imaging relaxation rates at 3.0 T — Initial experience. Radiology. 2005;235(2):595-603.
Figures