0274
Robust water-only liver T1 mapping with Look-Locker spiral out-in-out-in imaging at 0.55T1Ming Hsieh Department of Electrical and Computer Engineering, University of Southern California, Los Angeles, CA, United States, 2Clinical Medicine, University of Southern California, Los Angeles, CA, United States
Synopsis
Keywords: Quantitative Imaging, Low-Field MRI, liver
Motivation: Evaluation of patients with fatty liver disease can benefit from low-field scanners due to their larger bore size and reduced cost. However, fat is a cofounding factor for liver T1 mapping, and there is currently no reliable water-only T1 mapping method for low B0 field strengths.
Goal(s): To develop a practical water-only liver T1 mapping method at 0.55T.
Approach: Inversion recovery preparation combined with a 3-echo bSSFP spiral out-in-out-in (OIOI) readout was used to obtain water/fat separated images and quantify water-only T1.
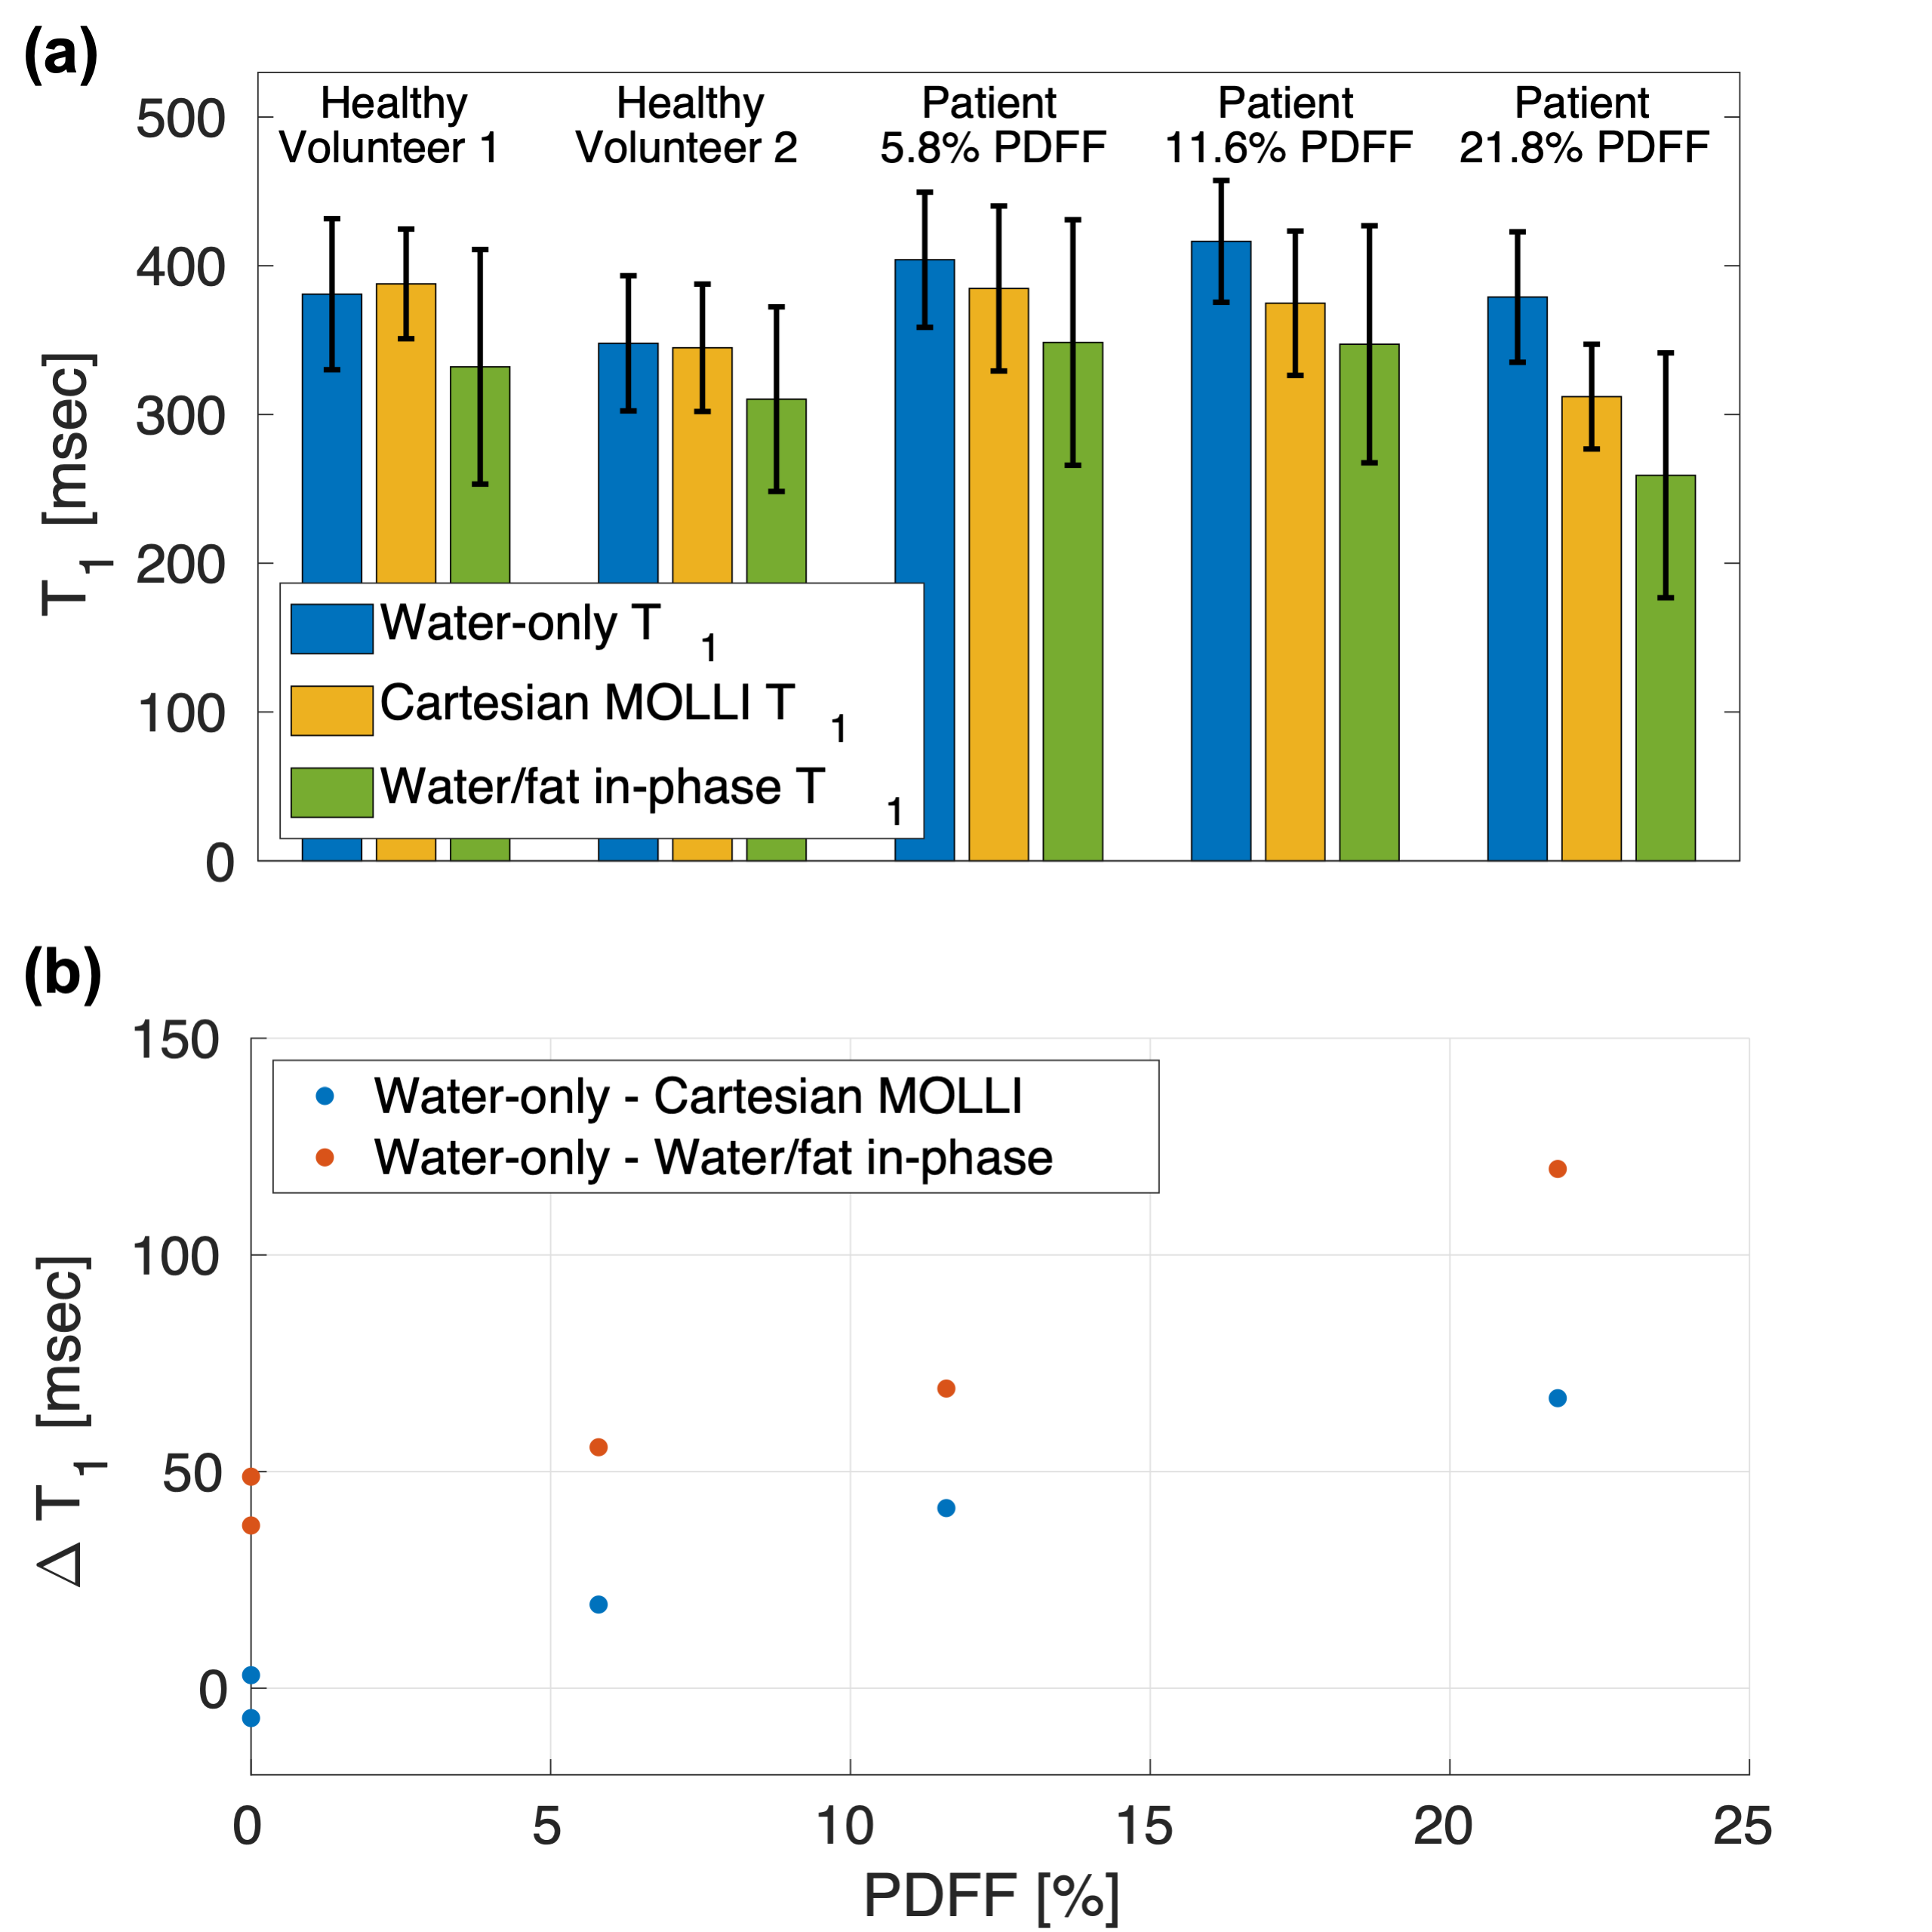
Results: The proposed water-only T1 mapping method is insensitive to liver PDFF, compared to Cartesian MOLLI and water-fat in-phase T1 values.
Impact: For patients with fatty liver disease, this new method provides reliable water-only T1 mapping at low field strength (0.55T). This method may be incorporated into clinical protocols as an indicator of liver inflammation, fibrosis, and stiffness.
Introduction
Fatty liver disease affects approximately 25% of the global population and is often accompanied by liver inflammation or fibrosis, where T1 mapping serves as a valuable diagnostic biomarker (1-3). Traditional T1 mapping methods are adversely affected by the presence of lipid, and are only able to estimate an “apparent T1” that also depends on the liver’s proton density fat fraction (PDFF).In recent years, researchers have developed methods to quantify water-only T1 values in the liver by using water/fat separation methods predominantly on 3T systems (4-7). Emerging mid-field strength scanners (0.1-1.0 T) could provide improved care for fatty liver patients because of the larger bore size, reduced acoustic noise (8), and improved access due to reduced ownership cost (9). However, water-only T1 methods are challenging to implement at low field due to the lower intrinsic SNR or ineffective water/fat separation. Recently, a spiral out-in-out-in (OIOI) sampling has been proposed to perform time- and SNR-efficient water/fat separated imaging at 0.55T (10).
Here we propose a water-only liver T1 mapping sequence at 0.55T, combining inversion recovery prepared bSSFP with the spiral OIOI readout. This approach achieves SNR efficiency using long spiral readouts and bSSFP acquisitions and achieves excellent water/fat separation with multiple echoes. We demonstrate reliable water-only T1 mapping of the liver even in the presence of significant lipid content.
Methods
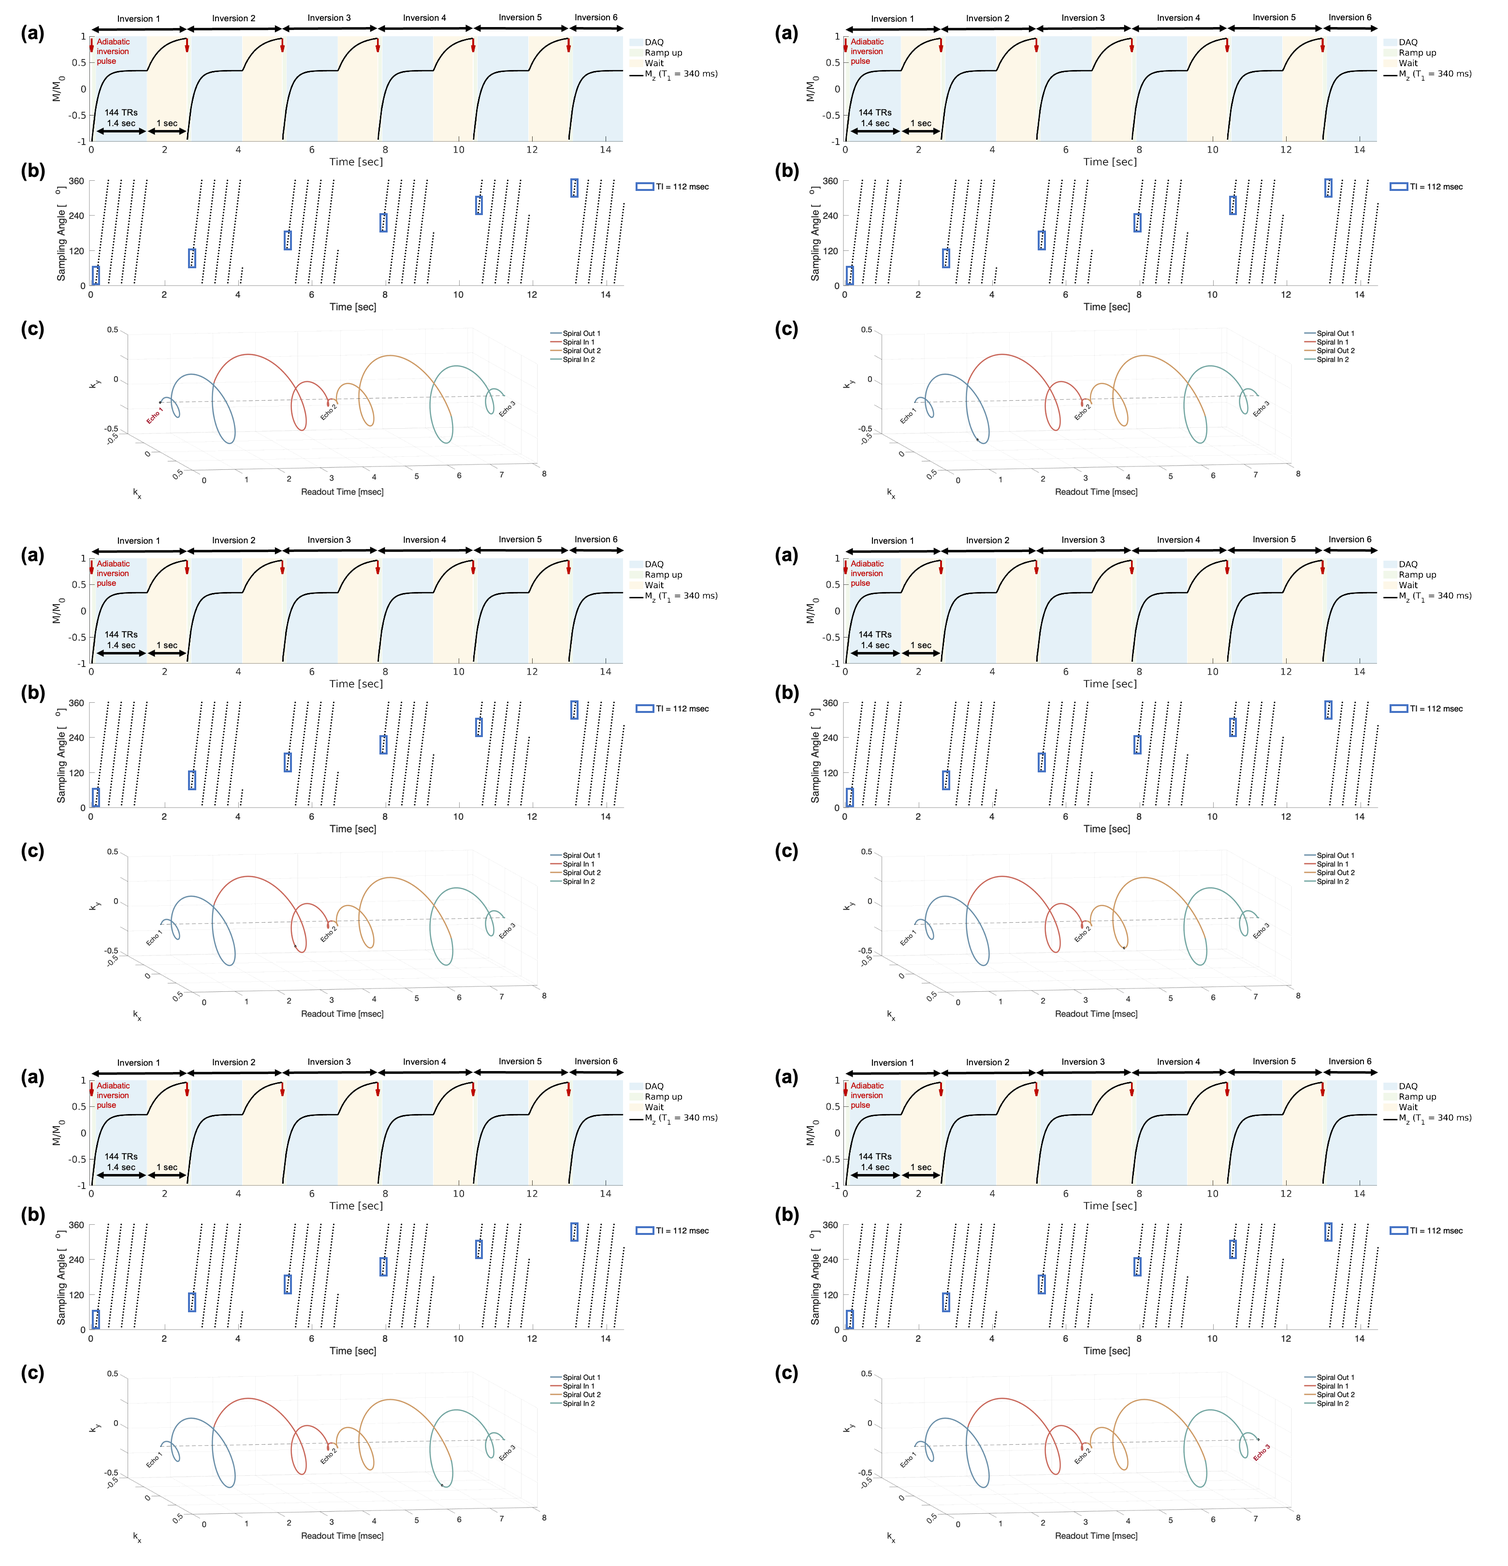
Pulse sequenceLook-Locker spiral OIOI pulse sequence is illustrated in Figure 1. Data acquisition (DAQ) is from 6 inversions and with a segmented bSSFP spiral OIOI sampling for water/fat separation.
Image Reconstruction
Data are binned to a group of 6 TRs, and all groups from 6 inversions with the same inversion time (TI) are combined to form 24 images at different TIs, with 36 spirals/image. Four spiral arms of spiral OIOI are separated, resulting in 3 echo times (2nd and 3rd spiral arms have the same TE). SAKE (11) is applied to mitigate aliasing arising from the arms. Phase sensitive reconstruction is performed to obtain the correct Mz polarity. Water/fat separation (10) is then performed, with the off-resonance map estimated from an averaged image of the three largest TIs. T1 maps are generated using pixelwise fitting using a 3-parameter model with Look-Locker correction (12).
Experiments
Experiments were performed on a whole-body 0.55T system (prototype MAGNETOM Area, Siemens Healthineers, Erlangen Germany) with high-performance shielded gradients (45 mT/m amplitude, 200 T/m/s slew rate). RTHawk real-time interactive platform (Vista.ai, Palo Alto, California) was used for data collection. Two healthy volunteers (1M/1F, age 21-35) and three fatty liver patients (2M/1F, age 37-69) were scanned after providing written informed consent under a protocol approved by our IRB. Imaging parameters were: three echoes at 0.79ms, 4.84ms, and 8.9ms, TR = 9.7ms, FOV = 38cm2, voxel size = 2x2x6mm3, flip angle = 60o, 16 seconds breath-hold, three axial slices. Cartesian MOLLI T1 mapping was acquired for comparison, with a slightly different voxel size 2.4x1.5x8mm3and TE/TR = 1.08/2.32ms.
Analysis
Water-only T1 maps from spiral OIOI are compared with Cartesian MOLLI and T1 maps estimated from the first spiral-out of spiral OIOI (water/fat in-phase). A large liver ROI, excluding vessels, was manually drawn to obtain average T1 values. PDFF was estimated with a 3D DIXON method (13, 14).
Results
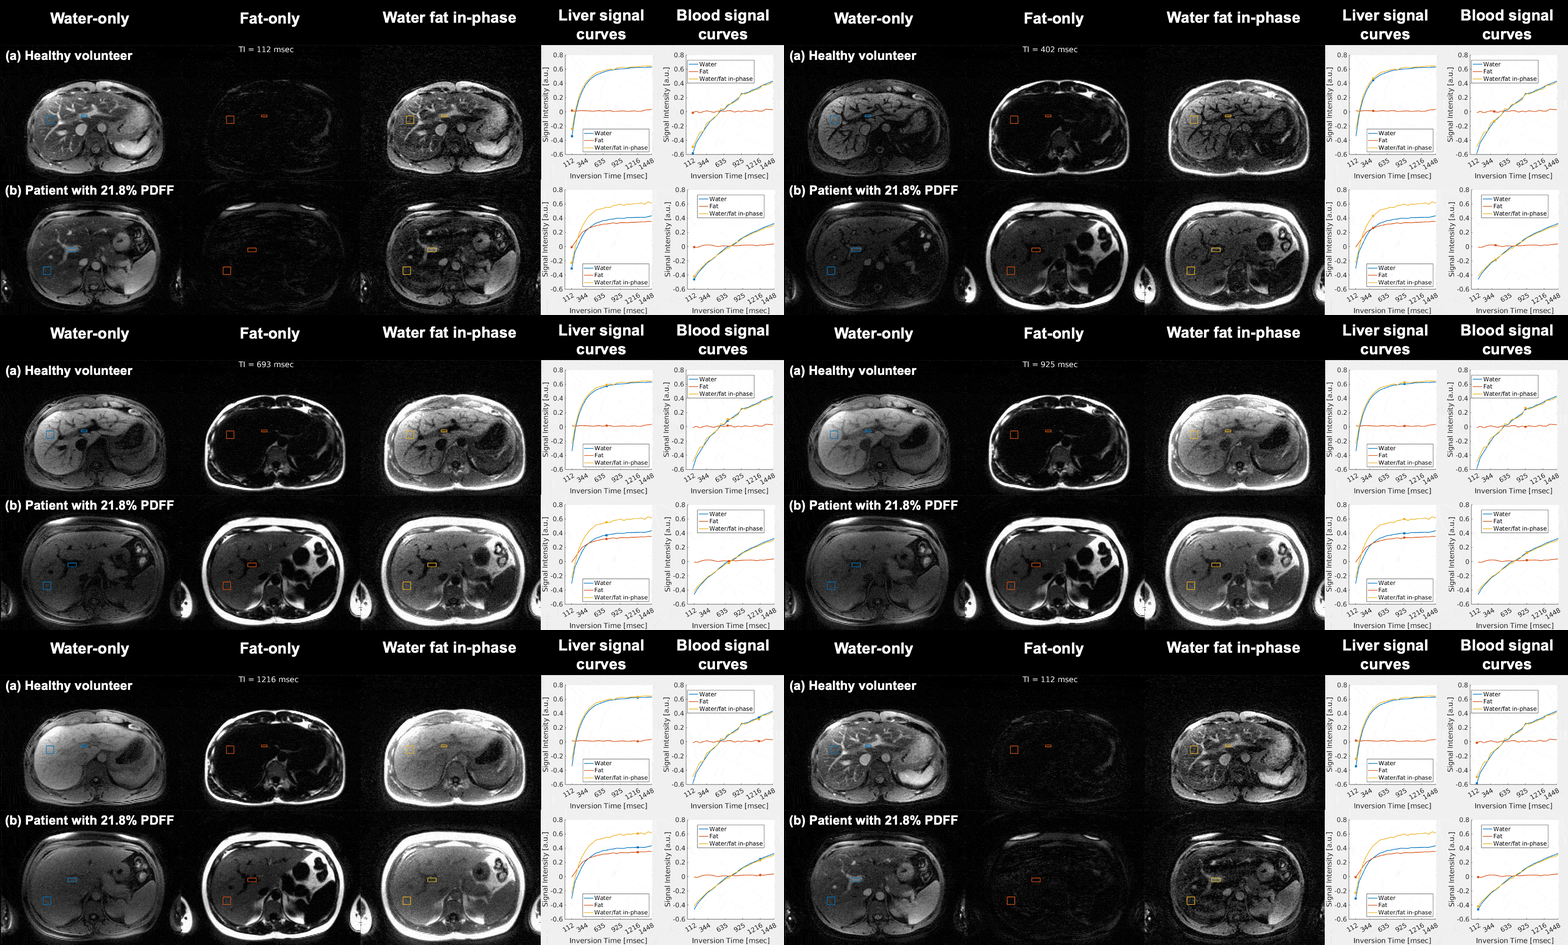
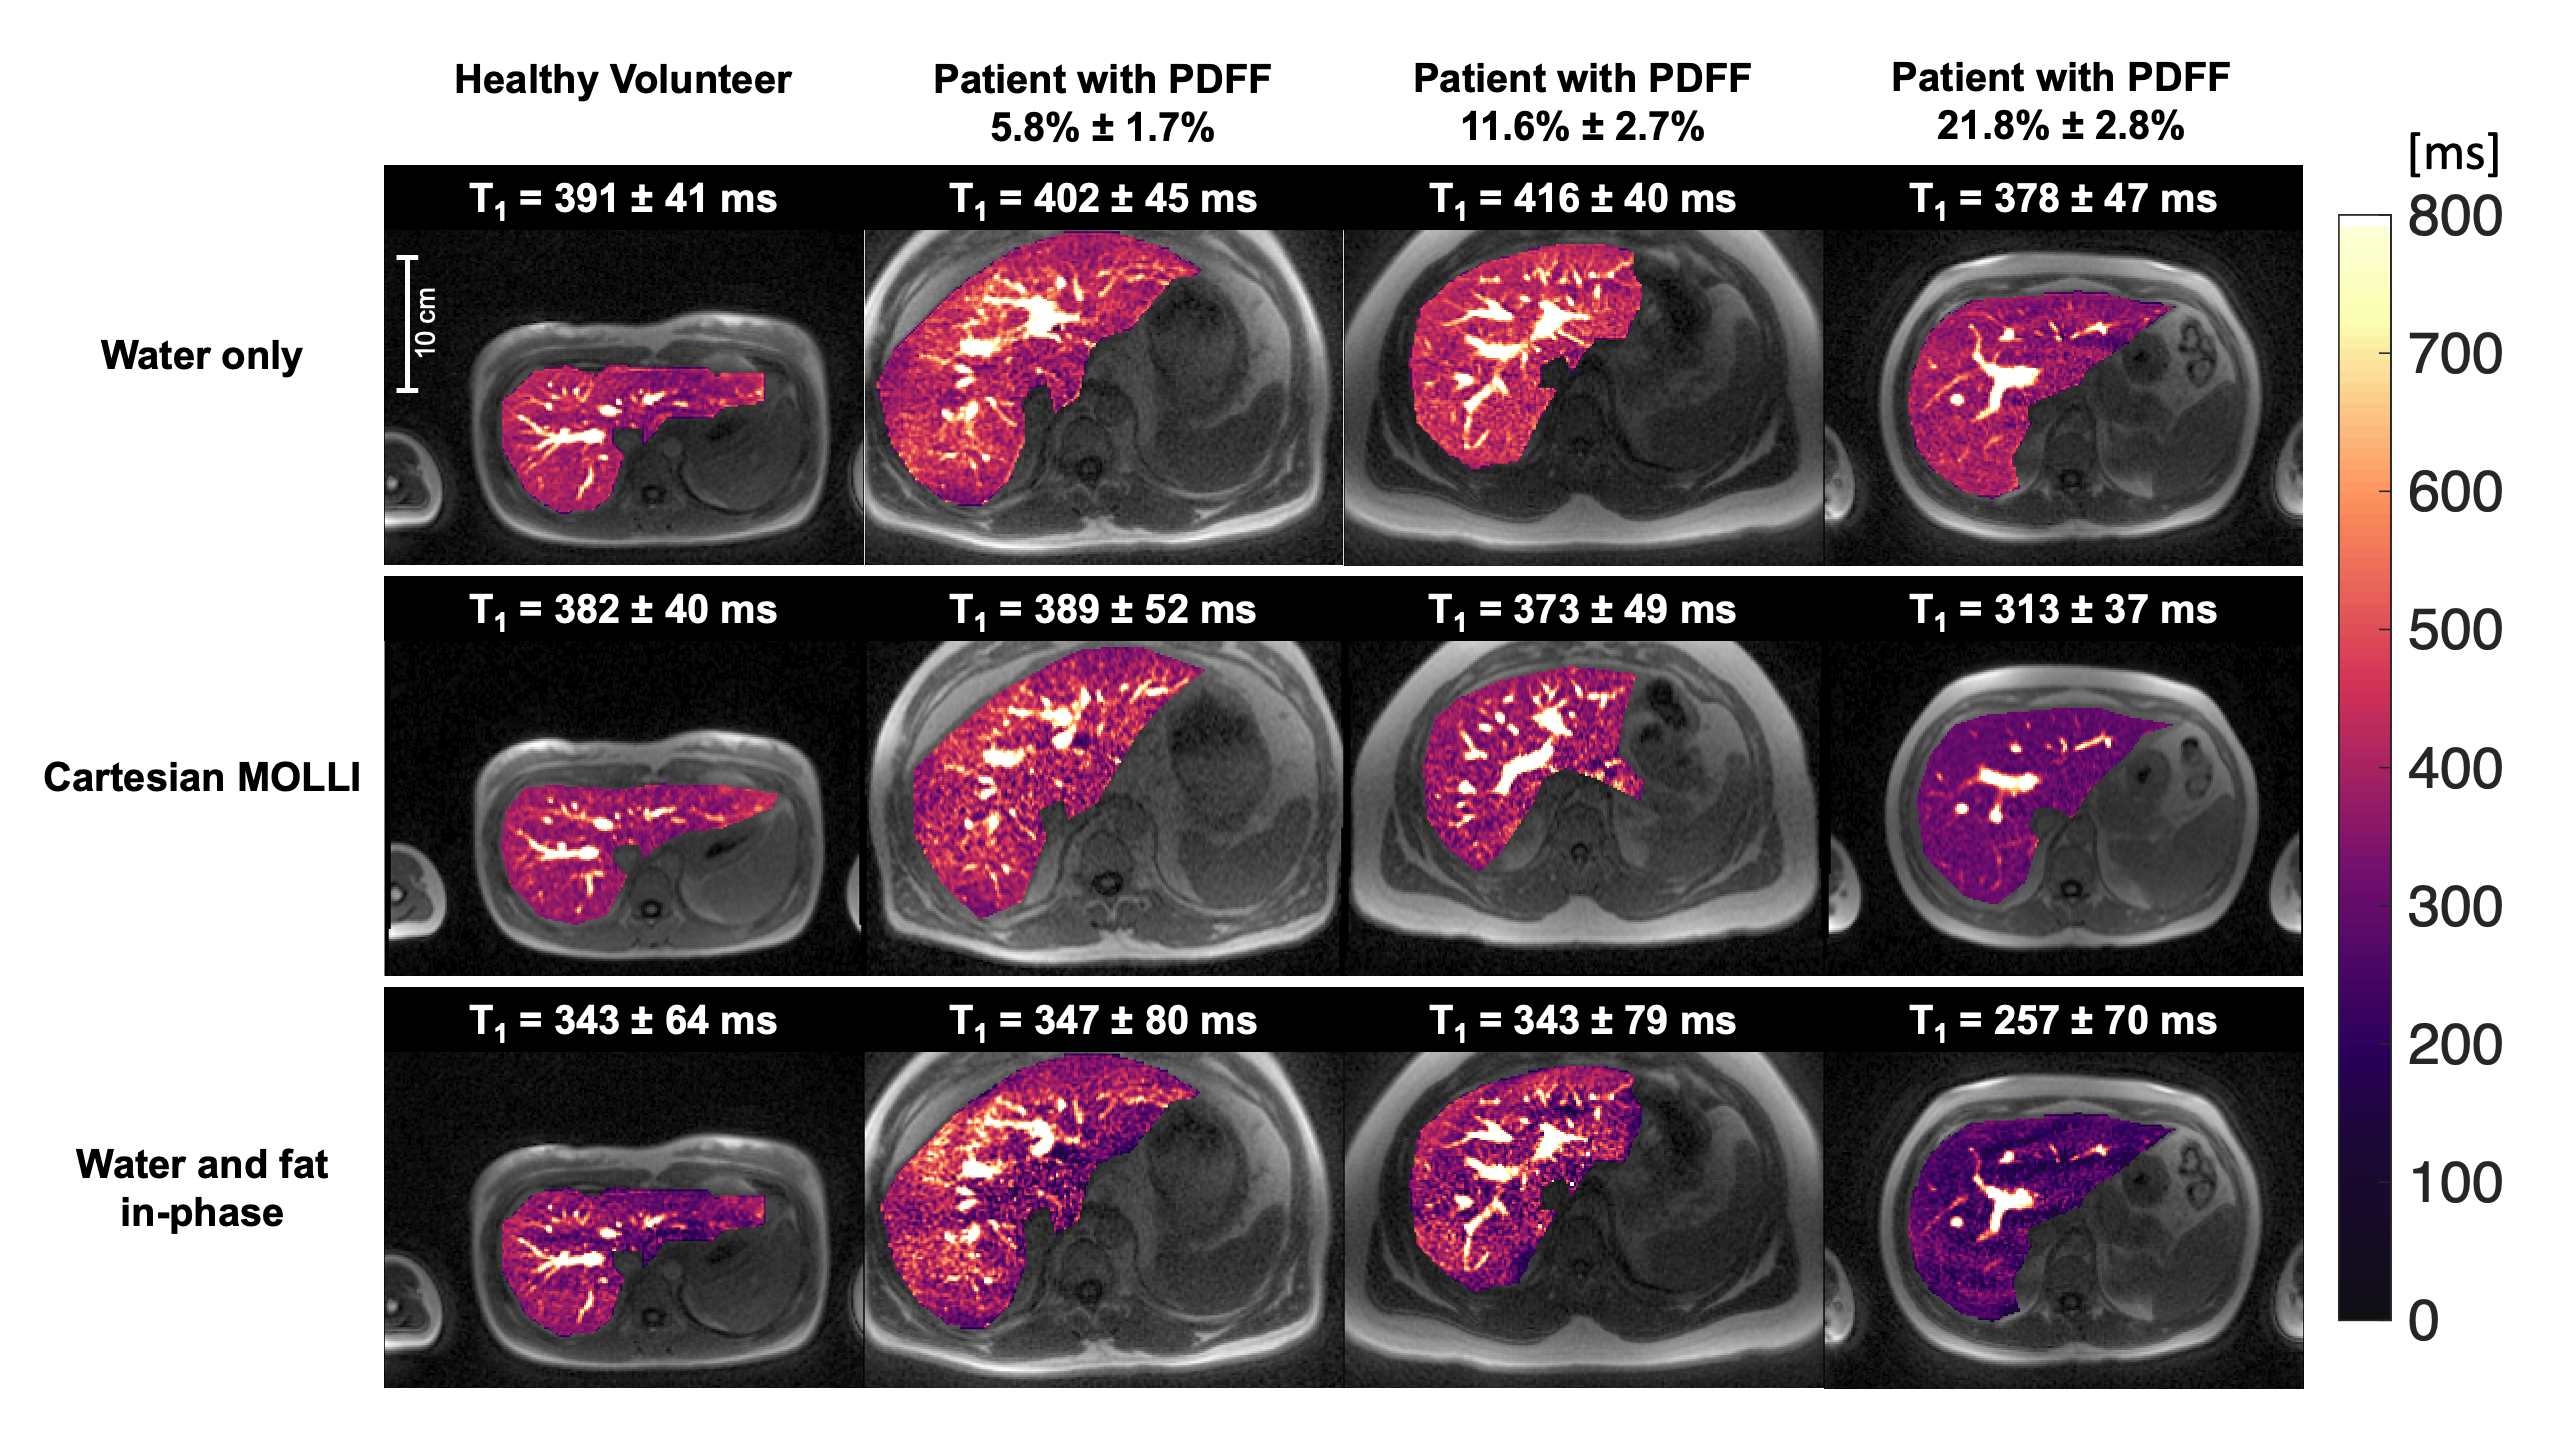
Figure 2 illustrates the effectiveness of water/fat separation with the proposed spiral OIOI acquisition. Figure 3 compares the T1 maps acquired in subjects with different liver PDFF. Figure 4 compares the T1 values in all subjects estimated with different methods. We observed an increased negative bias in Cartesian MOLLI T1 and water/fat in-phase T1 with increased PDFF.Discussion
We demonstrate water-only liver T1 mapping at 0.55T that is fast and robust to liver PDFF. In comparison, Cartesian MOLLI T1 and T1 estimated from water/fat in-phase echo times both have substantial negative bias that scales with PDFF. This bias is caused by the superposition of water and fat signals. With the sequences’ TE times (0.79ms and 1.08ms for first spiral-out and Cartesian, respectively), the water and fat are largely in-phase, which resulted in the apparent T1 being in between water T1 and fat T1 (i.e., shorter).We demonstrate initial feasibility in 5 subjects. A larger cohort study will a broader range of BMI and PDFF is required to further evaluate the method and to establish reference values for liver water T1 at 0.55T.
Conclusion
We demonstrate water-only liver T1 mapping at 0.55T that is fast and robust to liver PDFF, using Look-Locker spiral OIOI. Alternative methods that do not separate water and fat signals suffer from substantial bias that scales with PDFF.Acknowledgements
We acknowledge research support from Siemens Healthineers, and grant support from the National Institutes of Health (R21 HL159533) and National Science Foundation (Award 1828736).References
1. von Ulmenstein S, Bogdanovic S, Honcharova-Biletska H, Blümel S, Deibel AR, Segna D, et al. Assessment of hepatic fibrosis and inflammation with look-locker T1 mapping and magnetic resonance elastography with histopathology as reference standard. Abdom Radiol (NY). 2022;47(11):3746-57.
2. Hoffman DH, Ayoola A, Nickel D, Han F, Chandarana H, Shanbhogue KP. T1 mapping, T2 mapping and MR elastography of the liver for detection and staging of liver fibrosis. Abdom Radiol (NY). 2020;45(3):692-700.
3. Obmann VC, Berzigotti A, Catucci D, Ebner L, Gräni C, Heverhagen JT, et al. T1 mapping of the liver and the spleen in patients with liver fibrosis-does normalization to the blood pool increase the predictive value? Eur Radiol. 2021;31(6):4308-18.
4. Fellner C, Nickel MD, Kannengiesser S, Verloh N, Stroszczynski C, Haimerl M, et al. Water-Fat Separated T1 Mapping in the Liver and Correlation to Hepatic Fat Fraction. Diagnostics (Basel). 2023;13(2).
5. Wang Y, Qi H, Xiao M, Xiang C, Dong J, Chen H. Free-breathing simultaneous water-fat separation and T1 mapping of the whole liver (SWALI) with isotropic resolution using 3D golden-angle radial trajectory. Quant Imaging Med Surg. 2023;13(2):912-23.
6. Wan Q, Peng H, Lyu J, Liu F, Cheng C, Qiao Y, et al. Water Specific MRI T1 Mapping for Evaluating Liver Inflammation Activity Grades in Rats With Methionine-Choline-Deficient Diet-Induced Nonalcoholic Fatty Liver Disease. J Magn Reson Imaging. 2022;56(5):1429-36.
7. Feng L, Liu F, Soultanidis G, Liu C, Benkert T, Block KT, et al. Magnetization-prepared GRASP MRI for rapid 3D T1 mapping and fat/water-separated T1 mapping. Magn Reson Med. 2021;86(1):97-114.
8. Rusche T, Vosshenrich J, Winkel DJ, Donners R, Segeroth M, Bach M, et al. More Space, Less Noise-New-generation Low-Field Magnetic Resonance Imaging Systems Can Improve Patient Comfort: A Prospective 0.55T-1.5T-Scanner Comparison. J Clin Med. 2022;11(22).
9. Vosshenrich J, Breit HC, Bach M, Merkle EM. [Economic aspects of low-field magnetic resonance imaging : Acquisition, installation, and maintenance costs of 0.55 T systems]. Radiologe. 2022;62(5):400-4.
10. Tian Y, Nayak KS. Real-time water/fat imaging at 0.55T with spiral out-in-out-in sampling. Magn Reson Med. 2023.
11. Shin PJ, Larson PE, Ohliger MA, Elad M, Pauly JM, Vigneron DB, et al. Calibrationless parallel imaging reconstruction based on structured low-rank matrix completion. Magn Reson Med. 2014;72(4):959-70.
12. Deichmann R, Haase A. Quantification of T1 values by SNAPSHOT-FLASH NMR imaging. Journal of Magnetic Resonance (1969). 1992;96(3):608-12.
13. Zhong X, Nickel MD, Kannengiesser SA, Dale BM, Kiefer B, Bashir MR. Liver fat quantification using a multi-step adaptive fitting approach with multi-echo GRE imaging. Magn Reson Med. 2014;72(5):1353-65.
14. Yokoo T, Serai SD, Pirasteh A, Bashir MR, Hamilton G, Hernando D, et al. Linearity, Bias, and Precision of Hepatic Proton Density Fat Fraction Measurements by Using MR Imaging: A Meta-Analysis. Radiology. 2018;286(2):486-98.
Figures