0270
Fast water/fat T2 and PDFF mapping via multiple overlapping‑echo acquisition and deep learning reconstruction1Xiamen University, Xiamen, China, 2Magnetic Resonance Center, Zhongshan Hospital Afflicated to Xiamen University, Xiamen, China, 3Clinical & Technical Support, Philips Healthcare, Beijing, China
Synopsis
Keywords: Quantitative Imaging, Fat, T2 mapping
Motivation: Skeletal muscle inflammation/necrosis and fat infiltration are strong indicators of disease activity and progression in many neuromuscular disorders. They can be assessed by muscle T2 relaxometry and water-fat separation techniques, respectively.
Goal(s): Develop a method for simultaneous water-fat separation and T2 quantification.
Approach: The chemical-shift encoding multiple overlapping-echo detachment (CSE-MOLED) sequence was designed for MRI data acquisition, and synthetic data and deep learning were used for image reconstruction.
Results: The experiments showed that accurate T2 maps of water and fat and proton density fat fraction maps (PDFF) can be fast and simultaneously acquired by CSE-MOLED.
Impact: A new MRI method is proposed for fast and simultaneous T2 and PDFF mapping, which may help improve the clinical diagnosis of neuromuscular diseases.
Introduction
The T2 maps of water and fat (T2,w,T2,f) and proton density fat fraction (PDFF) map can provide valuable information for clinical diagnosis of diseases [1], especially in neuromuscular diseases. A method has been proposed to obtain T2,w and T2,f maps using CPMG-based sequence [1]. However, it requires collection of multiple images with different echo times (TE) to achieve T2 quantification, which results in a long collection time. Here, a method based on the chemical-shift encoding multiple overlapping-echo detachment [2-4] (CSE-MOLED) sequence is proposed. It can quickly obtain T2 and proton density (PD) maps of water and fat respectively, as well as PDFF map.Methods
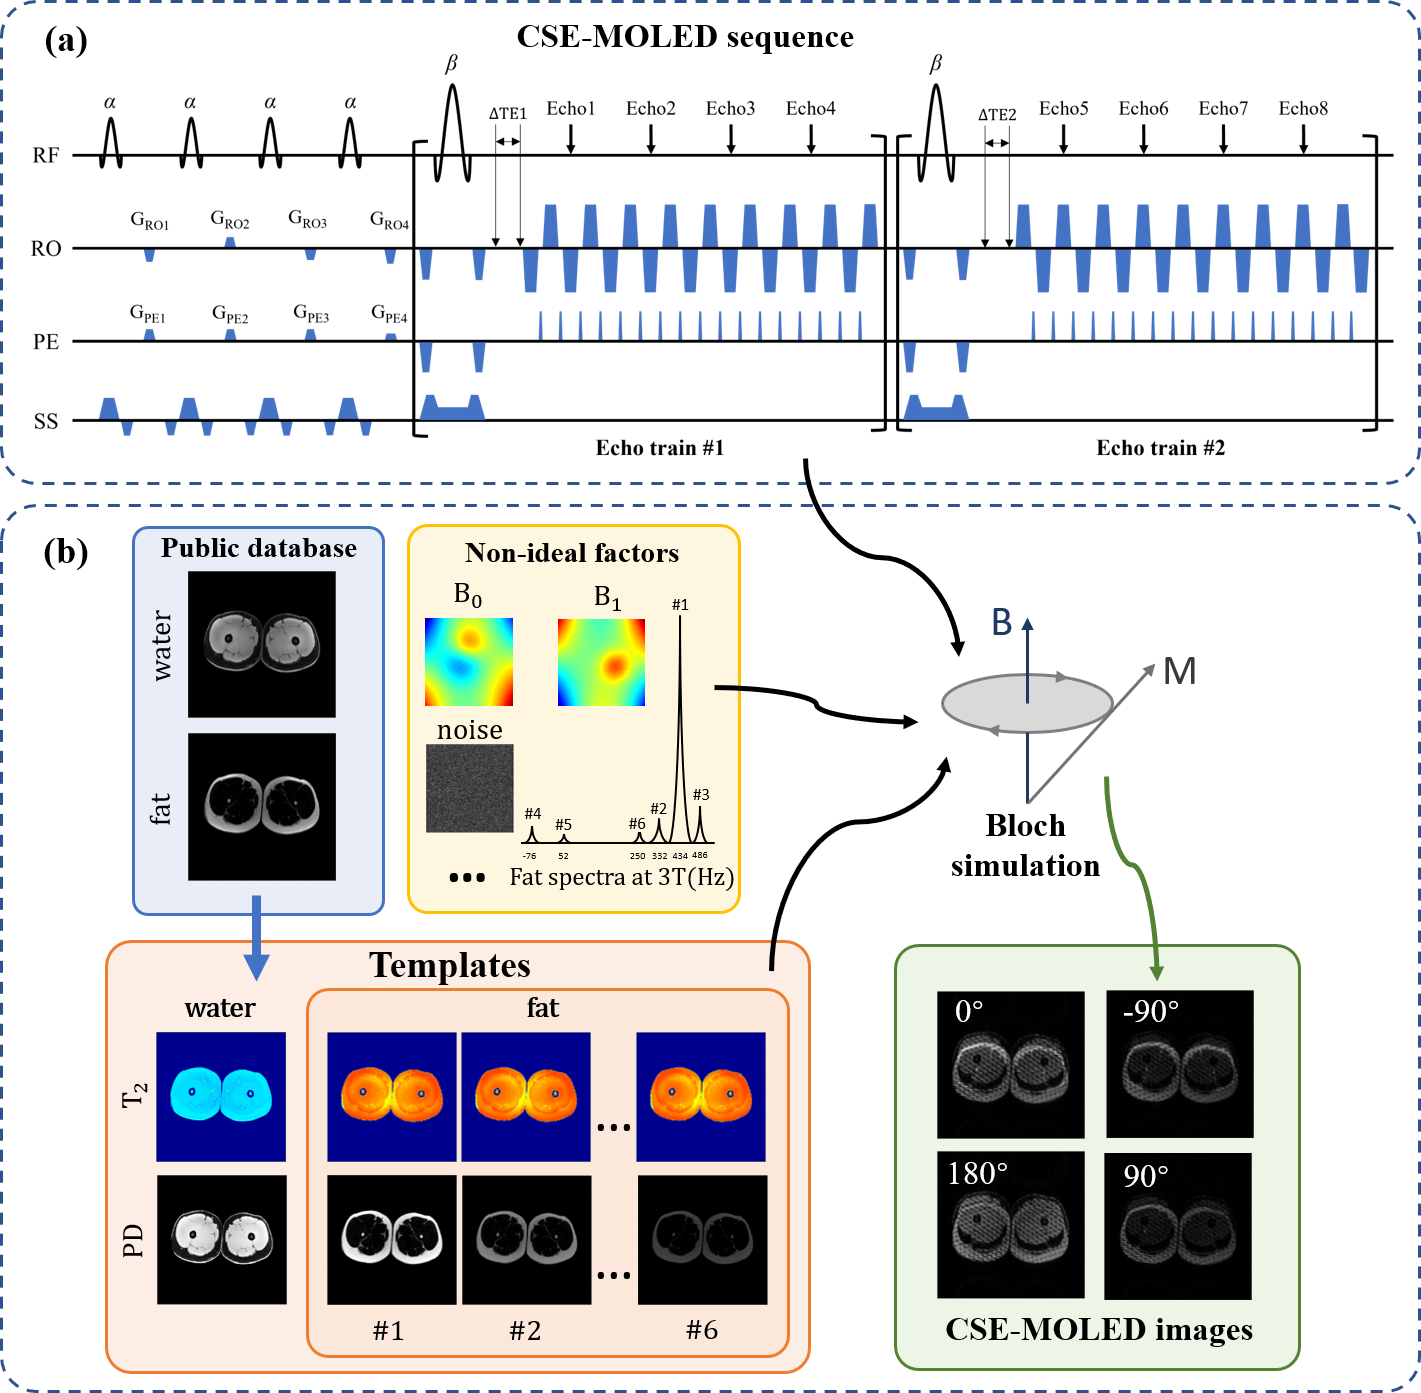
Pulse sequence design: Figure 1(a) shows the CSE-MOLED sequence. It acquires a series of echo signals with different T2 weights by continuously applying small-angle excitation pulses α. To enable water–fat chemical-shift encoding, a time shift is added before each readout module. Assuming that the time shift in the l-th scan and m-th readout module is $$$\Delta TE_{l,m}$$$ , the n-th echo signal of a voxel can be written as:$$S_{l,m,n}(x,y) =\begin{cases}\frac{1}{2^{n} }|\sin\alpha \cos^{4-n}\alpha|(1+\cos\alpha )^{n-1}(1-\cos\beta )\rho_{l,m,n}(x,y)...n\in\left \{1,2,3,4 \right \} \\ \frac{1}{2^{10-n} }|\sin \alpha \cos ^{n-5}\alpha|(1+\cos\alpha)^{8-n}(1-\cos \beta )^{2} \rho _{l,m,n}(x,y)...n\in \left \{ 5,6,7,8 \right \} \end{cases}$$
$$\rho _{l,m,n}(x,y) =\rho _{w} (x,y)e^{-TE_{n}/T_{2,w}(x,y) }e^{i2\pi f_{B0}(x,y)\Delta TE_{l,m} }+\sum_{j=1}^{6}c_{j}\rho _{f}(x,y+\Delta y_{j} )e^{-TE_{n}/T_{2,f}(x,y+\Delta y_{j}) }e^{i2\pi f_{j}\Delta TE_{l,m}}e^{i2\pi f_{B0}(x,y+\Delta y_{j})\Delta TE_{l,m}} $$
where $$$\rho _{w}$$$ and $$$\rho _{f}$$$ denote the complex-valued water and fat components, $$$c_{j}$$$and$$$f_{j}$$$ (Hz) are relative amplitude and chemical-shift of j-th fat peak respectively[5],$$$\Delta y_{j}$$$ is the position offset of the j-th fat peak in the phase encoding direction, and$$$f_{B0}$$$ (Hz) is the off-resonance frequency of the B0 field.
Synthetic Data:Figure 1(b) shows the process of data synthesis. The water and fat images from public database [6] were nonlinearly transformed and assigned with appropriate T2 and PD values, and then synthesized into T2 and PD maps of water and fat. The final templates contained water and six fat peak components, and each fat peak component was assumed to have the same T2. The Bloch simulation was performed to synthesize CSE-MOLED images using MRiLab [7], and multiple non-ideal factors were considered.
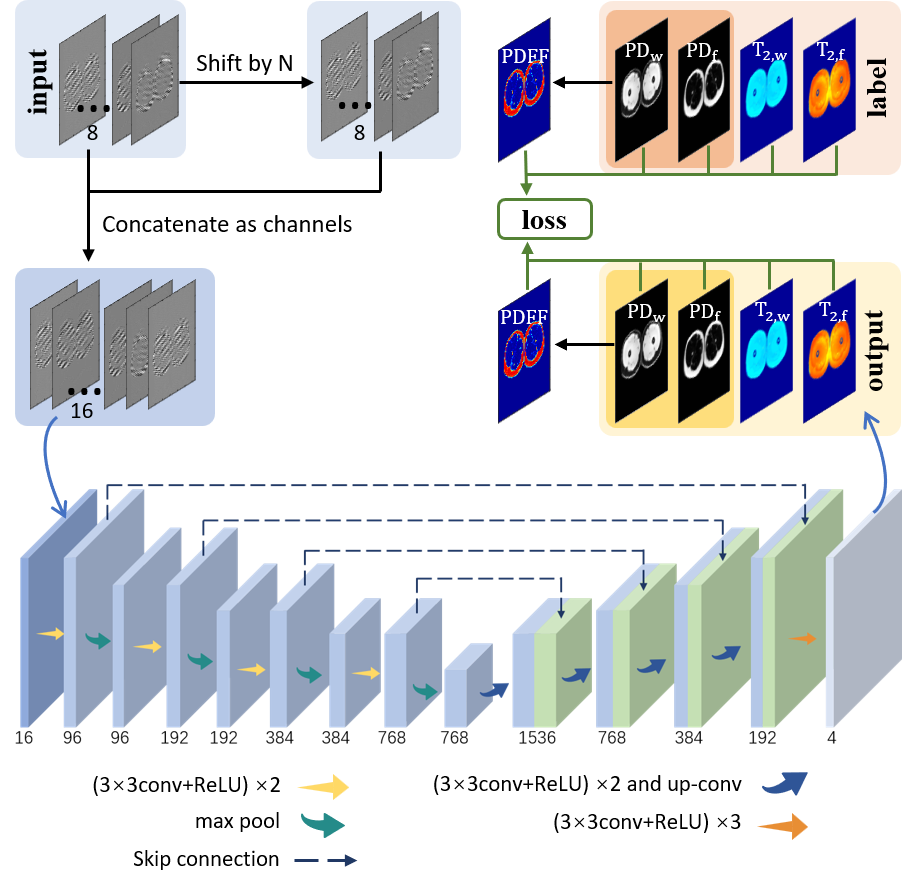
Network training:Figure 2 shows the process of network training. The inputs of U-Net were the real and imaginary parts of CSE-MOLED images. The outputs were T2 and PD maps of water and fat, respectively. During the network training, a loss constraint was added to PDFF to make it more accurate.
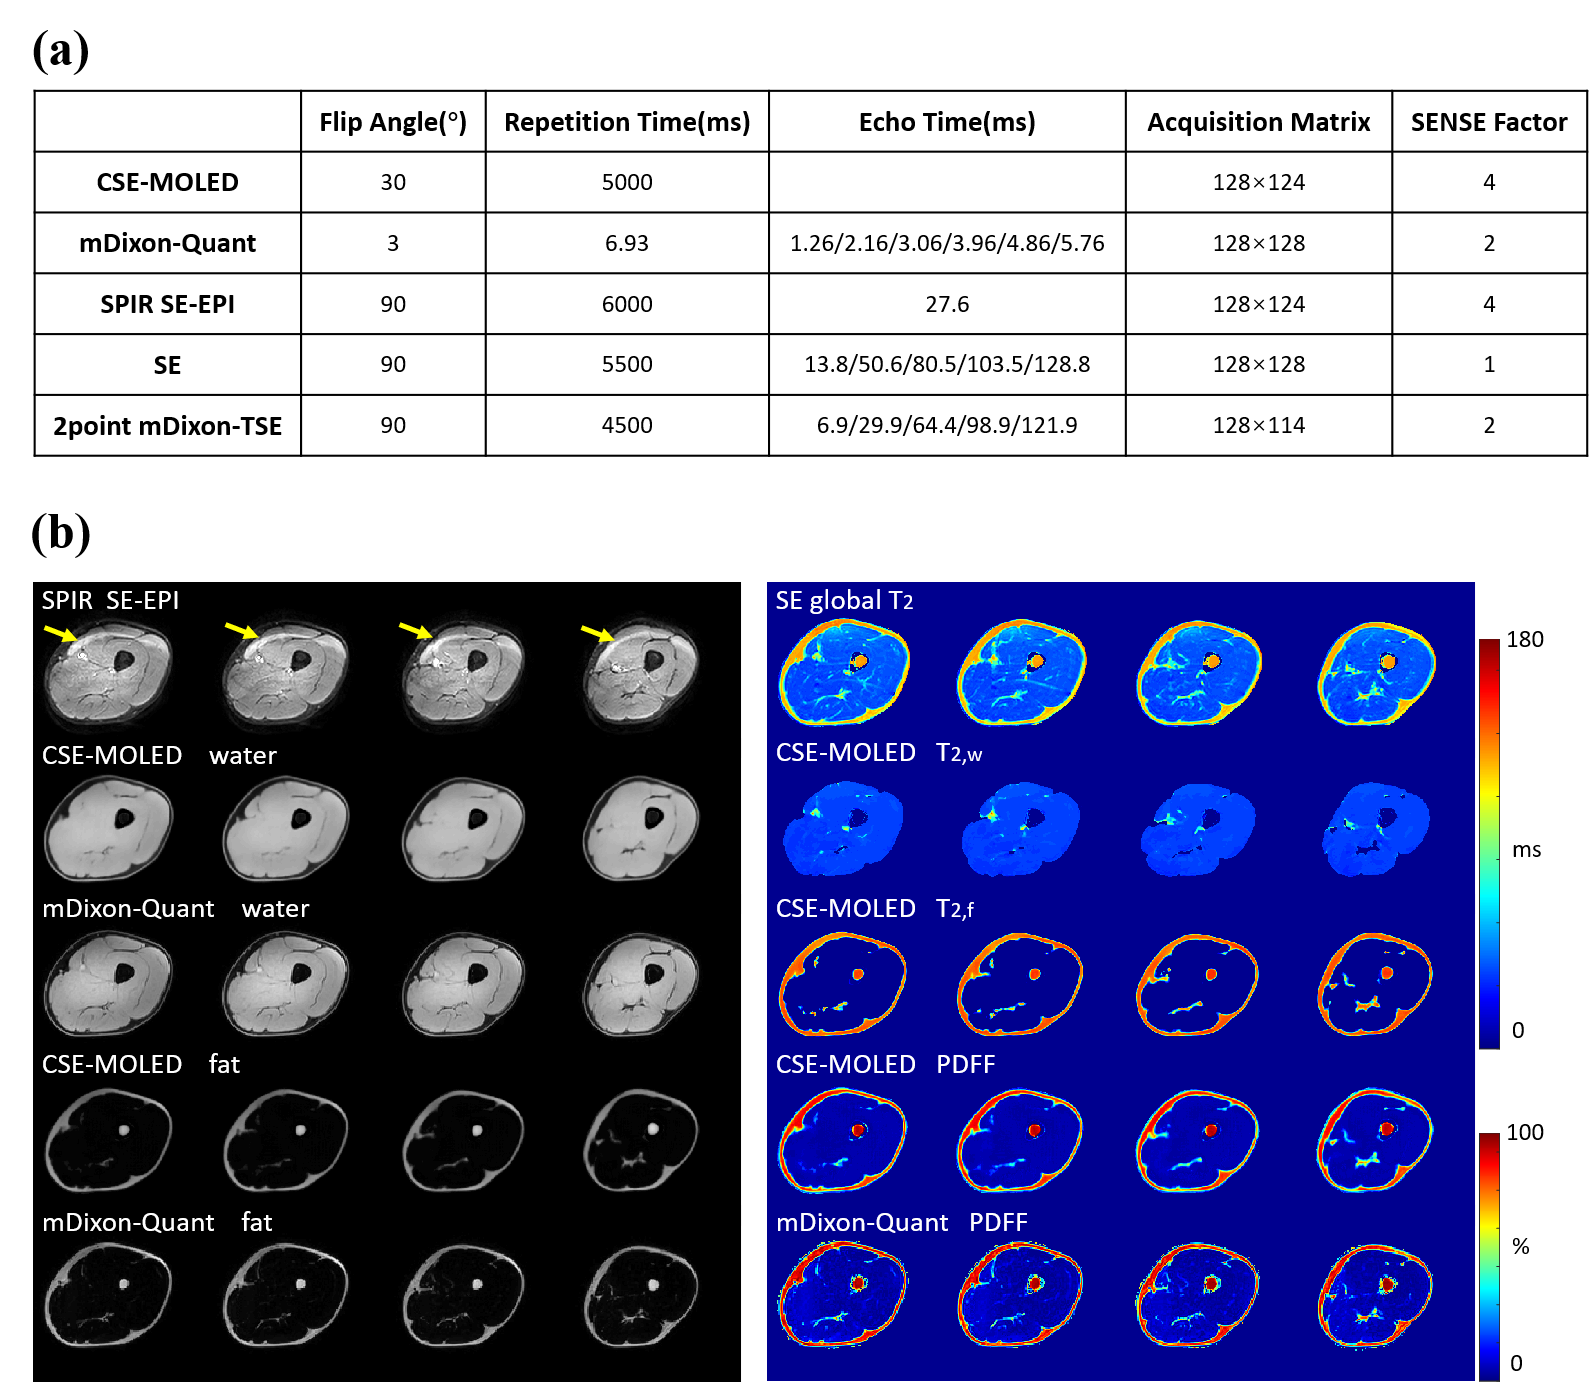
Experiments:This study was approved by the IRB at Zhongshan Hospital of Xiamen University. All experiments were carried out on a 3T scanner (Ingenia CX, Philips Healthcare), using a 32-channel abdomen receive coil. Four healthy volunteers were enrolled in the in vivo scans. A custom-made phantom with 13 small tubes was used in the phantom experiments. The traditional SPIR and mDixon-Quant technique were used to obtain contrast images. Reference T2 maps were acquired with SE sequence. Reference PDFF maps, T2 maps of water and fat, were obtained by 2point mDixon-TSE. Figure 3(a) shows the imaging parameters of different sequences. The field of view was 22×22 cm2 and slice thickness was 5 mm for all sequence. CSE-MOLED was performed for two times with different ∆TEs(∆TE1,1=0ms, ∆TE1,2=-5.75ms, ∆TE2,1=1.15ms, ∆TE2,2=0.575ms), corresponding to different water–fat phase shifts of 0°,-90°,180°,90°. Single slice scan time of CSE-MOLED was 162 ms.
Results
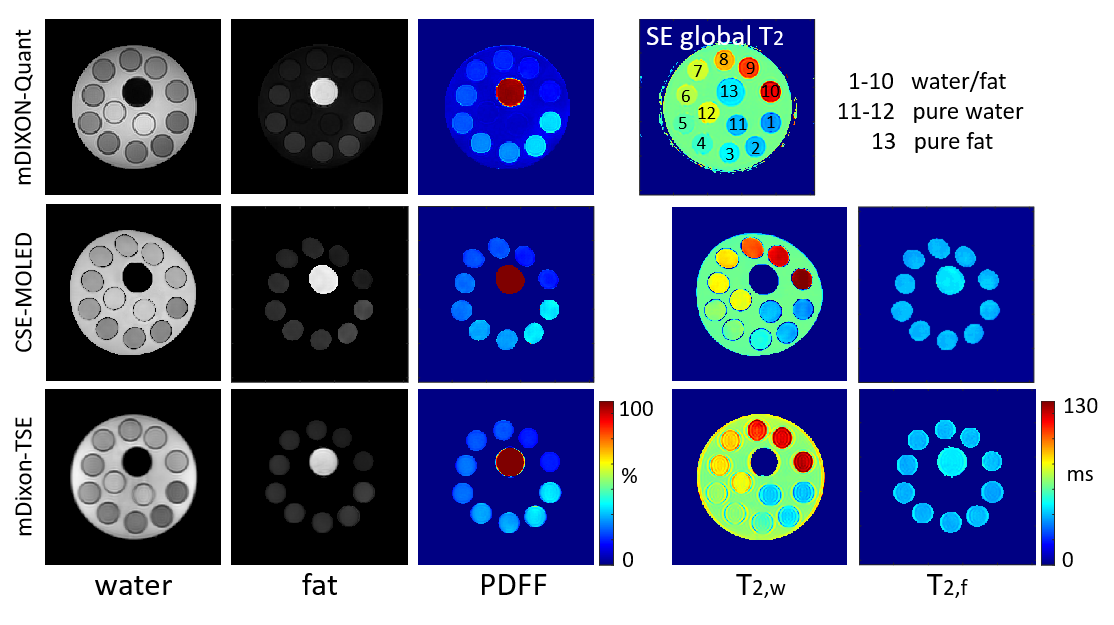
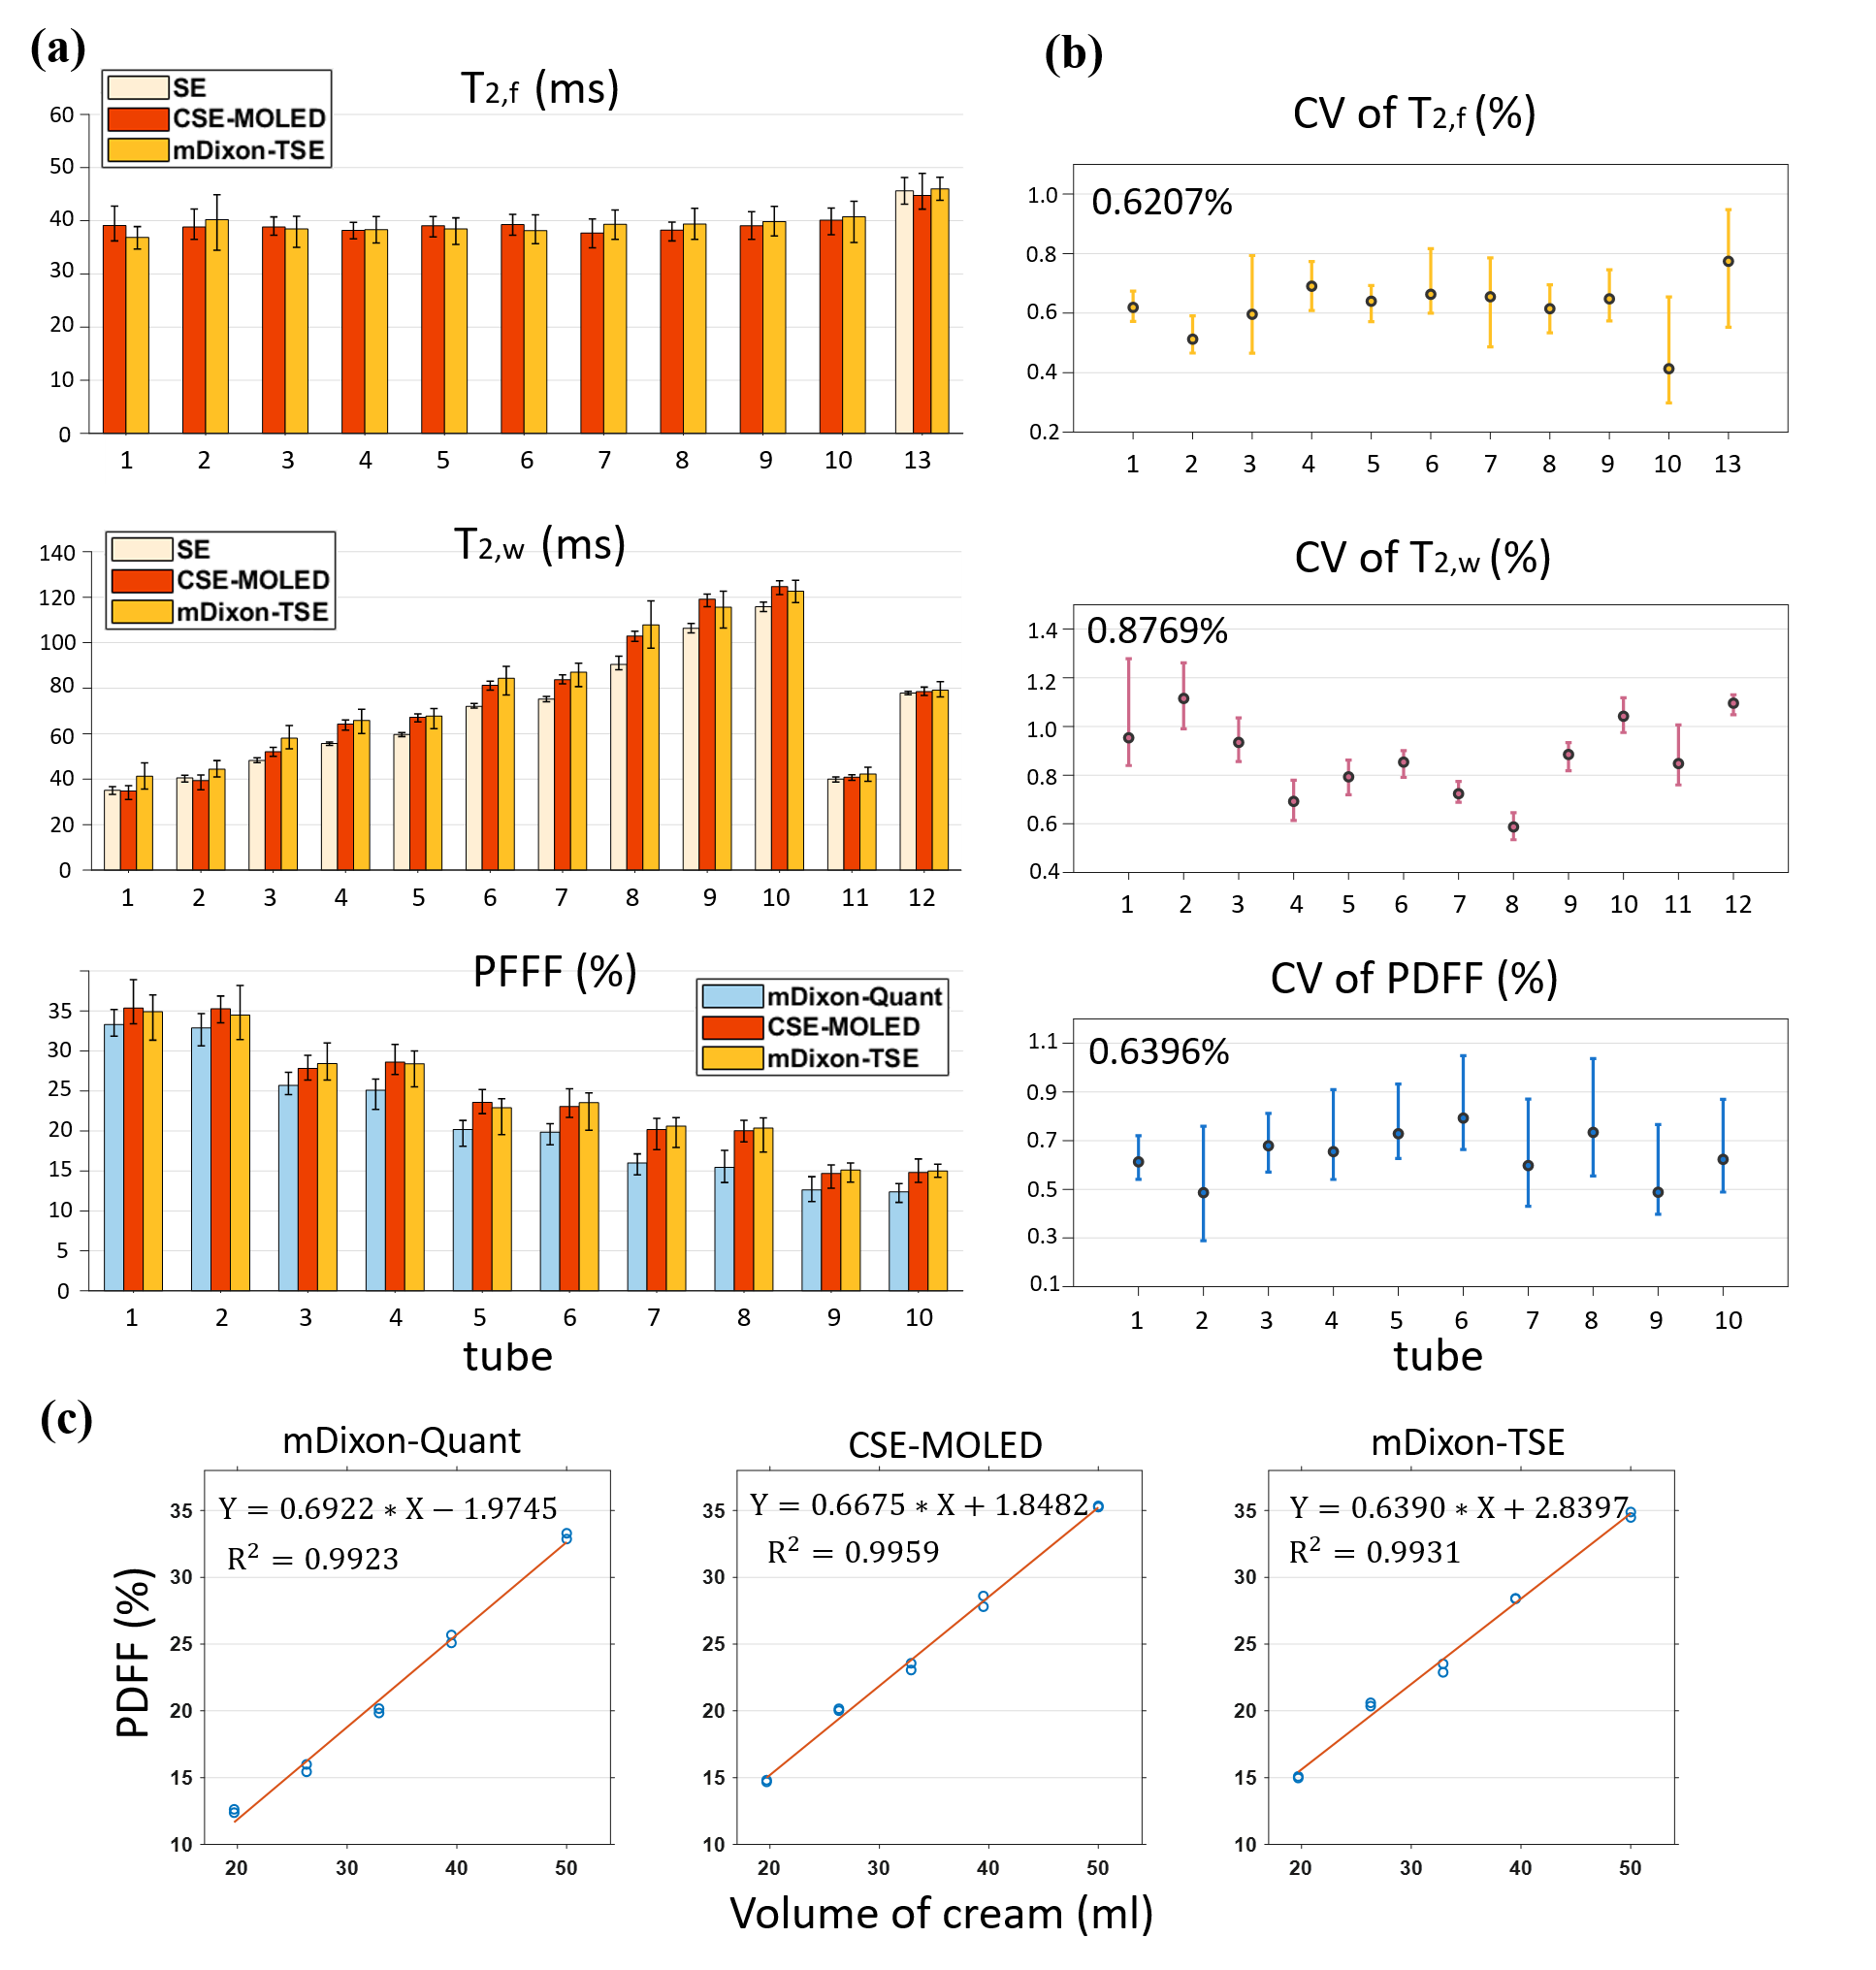
Figure 3 shows the results of one healthy volunteer. As the yellow arrows show, the water images obtained by SPIR SE-EPI still remained fat-related artifacts. The water/fat images by CSE-MOLED matched well with those by mDixon-Quant. As shown in Figure 4 and Figure 5(a), the T2,f, T2,w, and PDFF measured by CSE-MOLED were close to those by mDixon-TSE. For tubes composed of both water and fat (1-10), the global T2 measured by SE was shorter than the T2,w measured by mDixon-TSE and CSE-MOLED. The T2* of fat was shorter than water in the phantom, however mDixon-Quant assumes that water and fat have the same T2*, resulting in an underestimation of PDFF. Figure 5(b) presents the repeatability test results of CSE-MOLED from 8 measurements. The T2,f, T2,w, and PDFF across all tubes remain stable throughout the scan with low CVs (below 1%). Figure 5(c) presents the relationship between the volume of cream and PDFF, where the results by CSE-MOLED show the best proportional relationship.Discussion and conclusion
This study provides a new approach for rapid multi-parametric quantitative imaging of water and fat. The T2 maps of both water and fat, as well as PDFF maps, can be simultaneously acquired, which has significant potential for clinical diagnosis of neuromuscular diseases.Acknowledgements
This work was supported in part by the National Natural Science Foundation of China under grant numbers 82071913, 12375291 and 22161142024.References
1. Janiczek R L, Gambarota G, Sinclair C D J, et al. Simultaneous T2 and lipid quantitation using IDEAL-CPMG. Magn Reson Med. 2011;66(5):1293-1302.
2. Zhang J, Wu J, Chen S, et al. Robust single-shot T2 mapping via multiple overlapping-echo acquisition and deep neural network. IEEE Trans Med Imaging. 2019;38:1801-1811.
3. Yang Q, Lin Y, Wang J, et al. MOdel-Based SyntheTic Data-Driven Learning (MOST-DL): Application in single-shot T2 mapping with severe head motion using overlapping-echo acquisition. IEEE Trans Med Imaging. 2022;41(11):3167-3181.
4. Ma L, Wu J, Yang Q, et al. Single-shot multi-parametric mapping based on multiple overlapping-echo detachment (MOLED) imaging. Neuroimage 2022;263:119645.
5. Yu H, Shimakawa A, McKenzie C, et al. Multiecho water-fat separation and simultaneous R2* estimation with multifrequency fat spectrum modeling. Magnetic resonance in medicine, 2008, 60(5):1122-1134.
6. Schlaeger S, Freitag F, Klupp E, et al. Thigh muscle segmentation of chemical shift encoding-based water-fat magnetic resonance images: The reference database MyoSegmenTUM. PLoS ONE, 2018,13(6):e0198200.
7. Liu F, Velikina JV, Block WF, et al. Fast realistic MRI simulations based on generalized multi-pool exchange tissue model. IEEE Trans Med Imaging. 2016;36:527-537.
Figures