0269
Longitudinal quantitative MRI detects heterogeneity in response to radiation therapy within prostate cancer1Institute of Medical Physics, The University of Sydney, Camperdown, NSW, Australia, 2Sydney West Radiation Oncology, Westmead & Blacktown Hospital, Wentworthville, NSW, Australia, 3Ingham Institute for Applied Medical Research, Liverpool, NSW, Australia, 4Liverpool and Macarthur Cancer Therapy Centre, Liverpool Hospital, Liverpool, NSW, Australia, 5Department of Radiation Oncology, Calvary Mater Newcastle, Newcastle, NSW, Australia
Synopsis
Keywords: Prostate, Quantitative Imaging, Treatment response, tumors, radiotherapy, prostate
Motivation: Tumour heterogeneity can result in a spatial variation in response to radiation. While quantitative MRI (qMRI) shows promise in monitoring treatment response in prostate cancer (PCa), there remains an untapped potential for spatial response mapping to detect radioresistant tumour sub-regions suitable for early salvage therapy.
Goal(s): To assess the feasibility of treatment response mapping in a post-radiation therapy longitudinal qMRI PCa dataset.
Approach: Longitudinal qMRI parameter maps of 16 PCa patients were analysed using voxel-wise and region of interest (ROI) approaches.
Results: Voxel-wise analysis identified heterogeneity in treatment-related changes within PCa that would otherwise be concealed in ROI-based assessments.
Impact: Voxel-wise analysis of longitudinal qMRI parameter maps can detect radiation treatment response in sub-volumes of prostate cancer. Reliable detection and localisation of early treatment response provides an opportunity for adaptive or salvage therapies of treatment-resistant tumours.
Introduction
Inter- and intra-tumour heterogeneity in prostate cancer (PCa) has been previously described [1]. Radiation therapy (RT) is a common treatment for PCa, where conventionally, a homogeneous dose is delivered to the entire prostate. Radioresistant tumour sub-volumes, however, are at risk of disease recurrence under conventional dose prescriptions [2]. Quantitative MRI (qMRI) techniques, including diffusion weighted imaging (DWI), dynamic contrast enhanced MRI (DCE-MRI) and relaxation time mapping, have shown potential to provide imaging biomarkers of response to RT in PCa [3]. Nevertheless, current studies predominantly employ whole region of interest (ROI) based analysis, with limited exploration into spatial mapping of treatment response to locate radioresistant PCa sub-volumes. Here we show that voxel-wise analysis can reveal the heterogenous response within PCa tumours following RT in a comprehensive range of qMRI parametric maps. The identified qMRI parameters can potentially be used to monitor spatial heterogeneity of treatment response in PCa and enable early detection of resistant or recurrent sub-volumes suitable for adaptive or salvage therapies.Methods
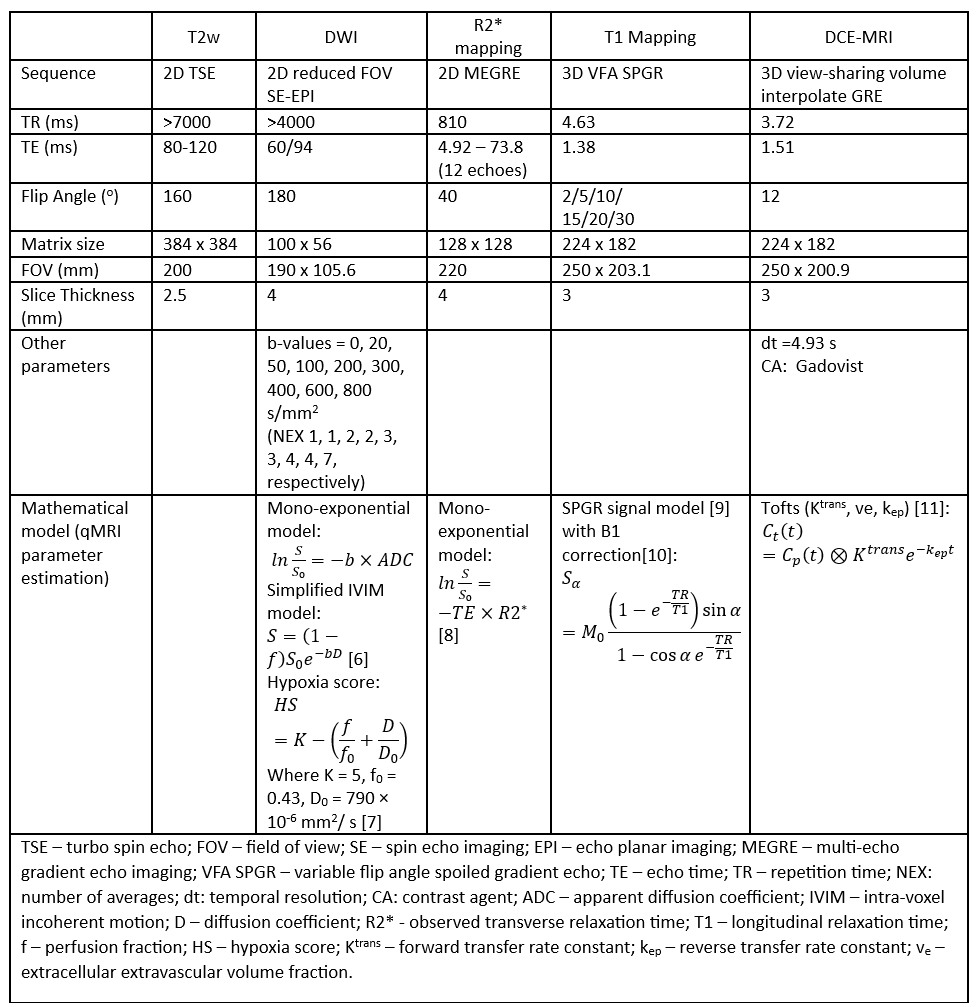
Twenty-one patients were recruited to the Sequential Imaging Biofocussed Radiotherapy multi-centre clinical trial (UTN U1111-1221-9589). Thirteen patients received neoadjuvant androgen deprivation therapy (ADT) before RT, with median (overall) ADT duration of 18 months (range: 4 – 24 months). MRI data was acquired using three 3T scanners (two MAGNETOM Skyra and a MAGNETOM Prisma, Siemens Healthineers, Erlangen, Germany) before RT and at 6, 12, and 18 months post-RT. Patients treated with ADT were also imaged prior to commencing ADT. A multi-parametric MRI protocol was applied (detailed in Table 1) to generate maps of apparent diffusion coefficient (ADC), diffusion coefficient (D), perfusion fraction (f), hypoxia score (HS), T1, R2*, forward and reverse transfer rate constant (Ktrans and kep) and extracellular extravascular space (ve). The parametric maps were deformably registered to the baseline (first) scan. Tumours were segmented using an in-house developed deep learning model [4]. Treatment-related changes in qMRI parameters within the tumour were analysed using both ROI and voxel-wise methods. Previously obtained repeatability coefficients (RC) were used to differentiate treatment-related changes from measurement uncertainty [5]. The statistical significance of changes in tumour sub-volumes at each timepoint was evaluated using repeated measures ANOVA (rANOVA) and post hoc two-tailed t-tests.Results
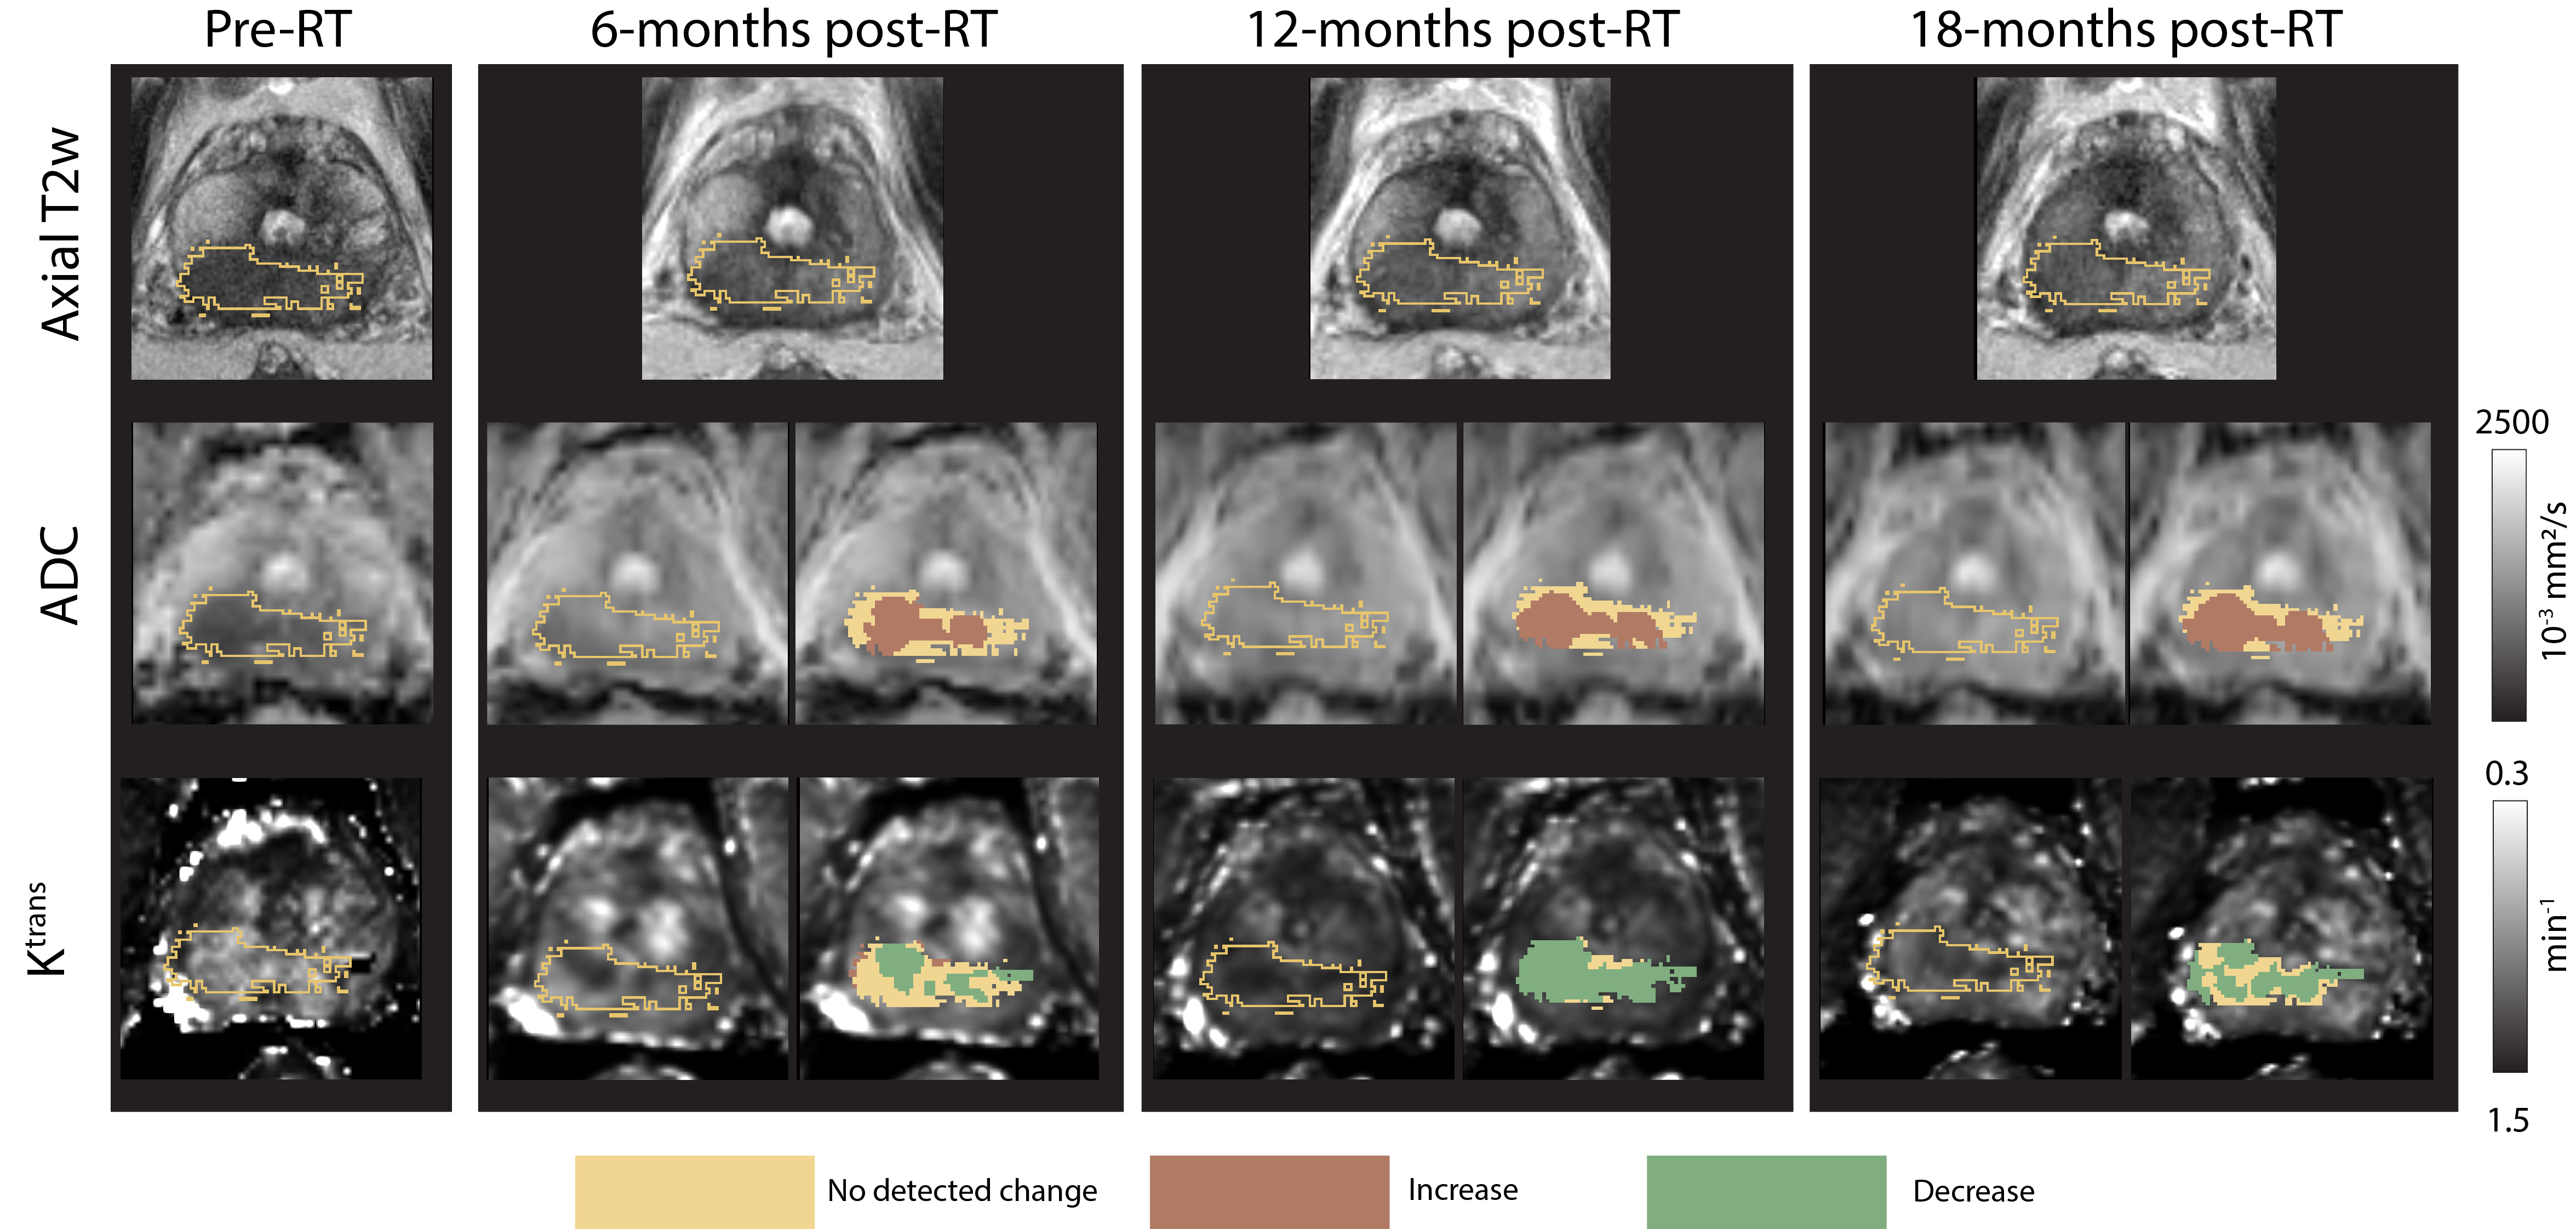
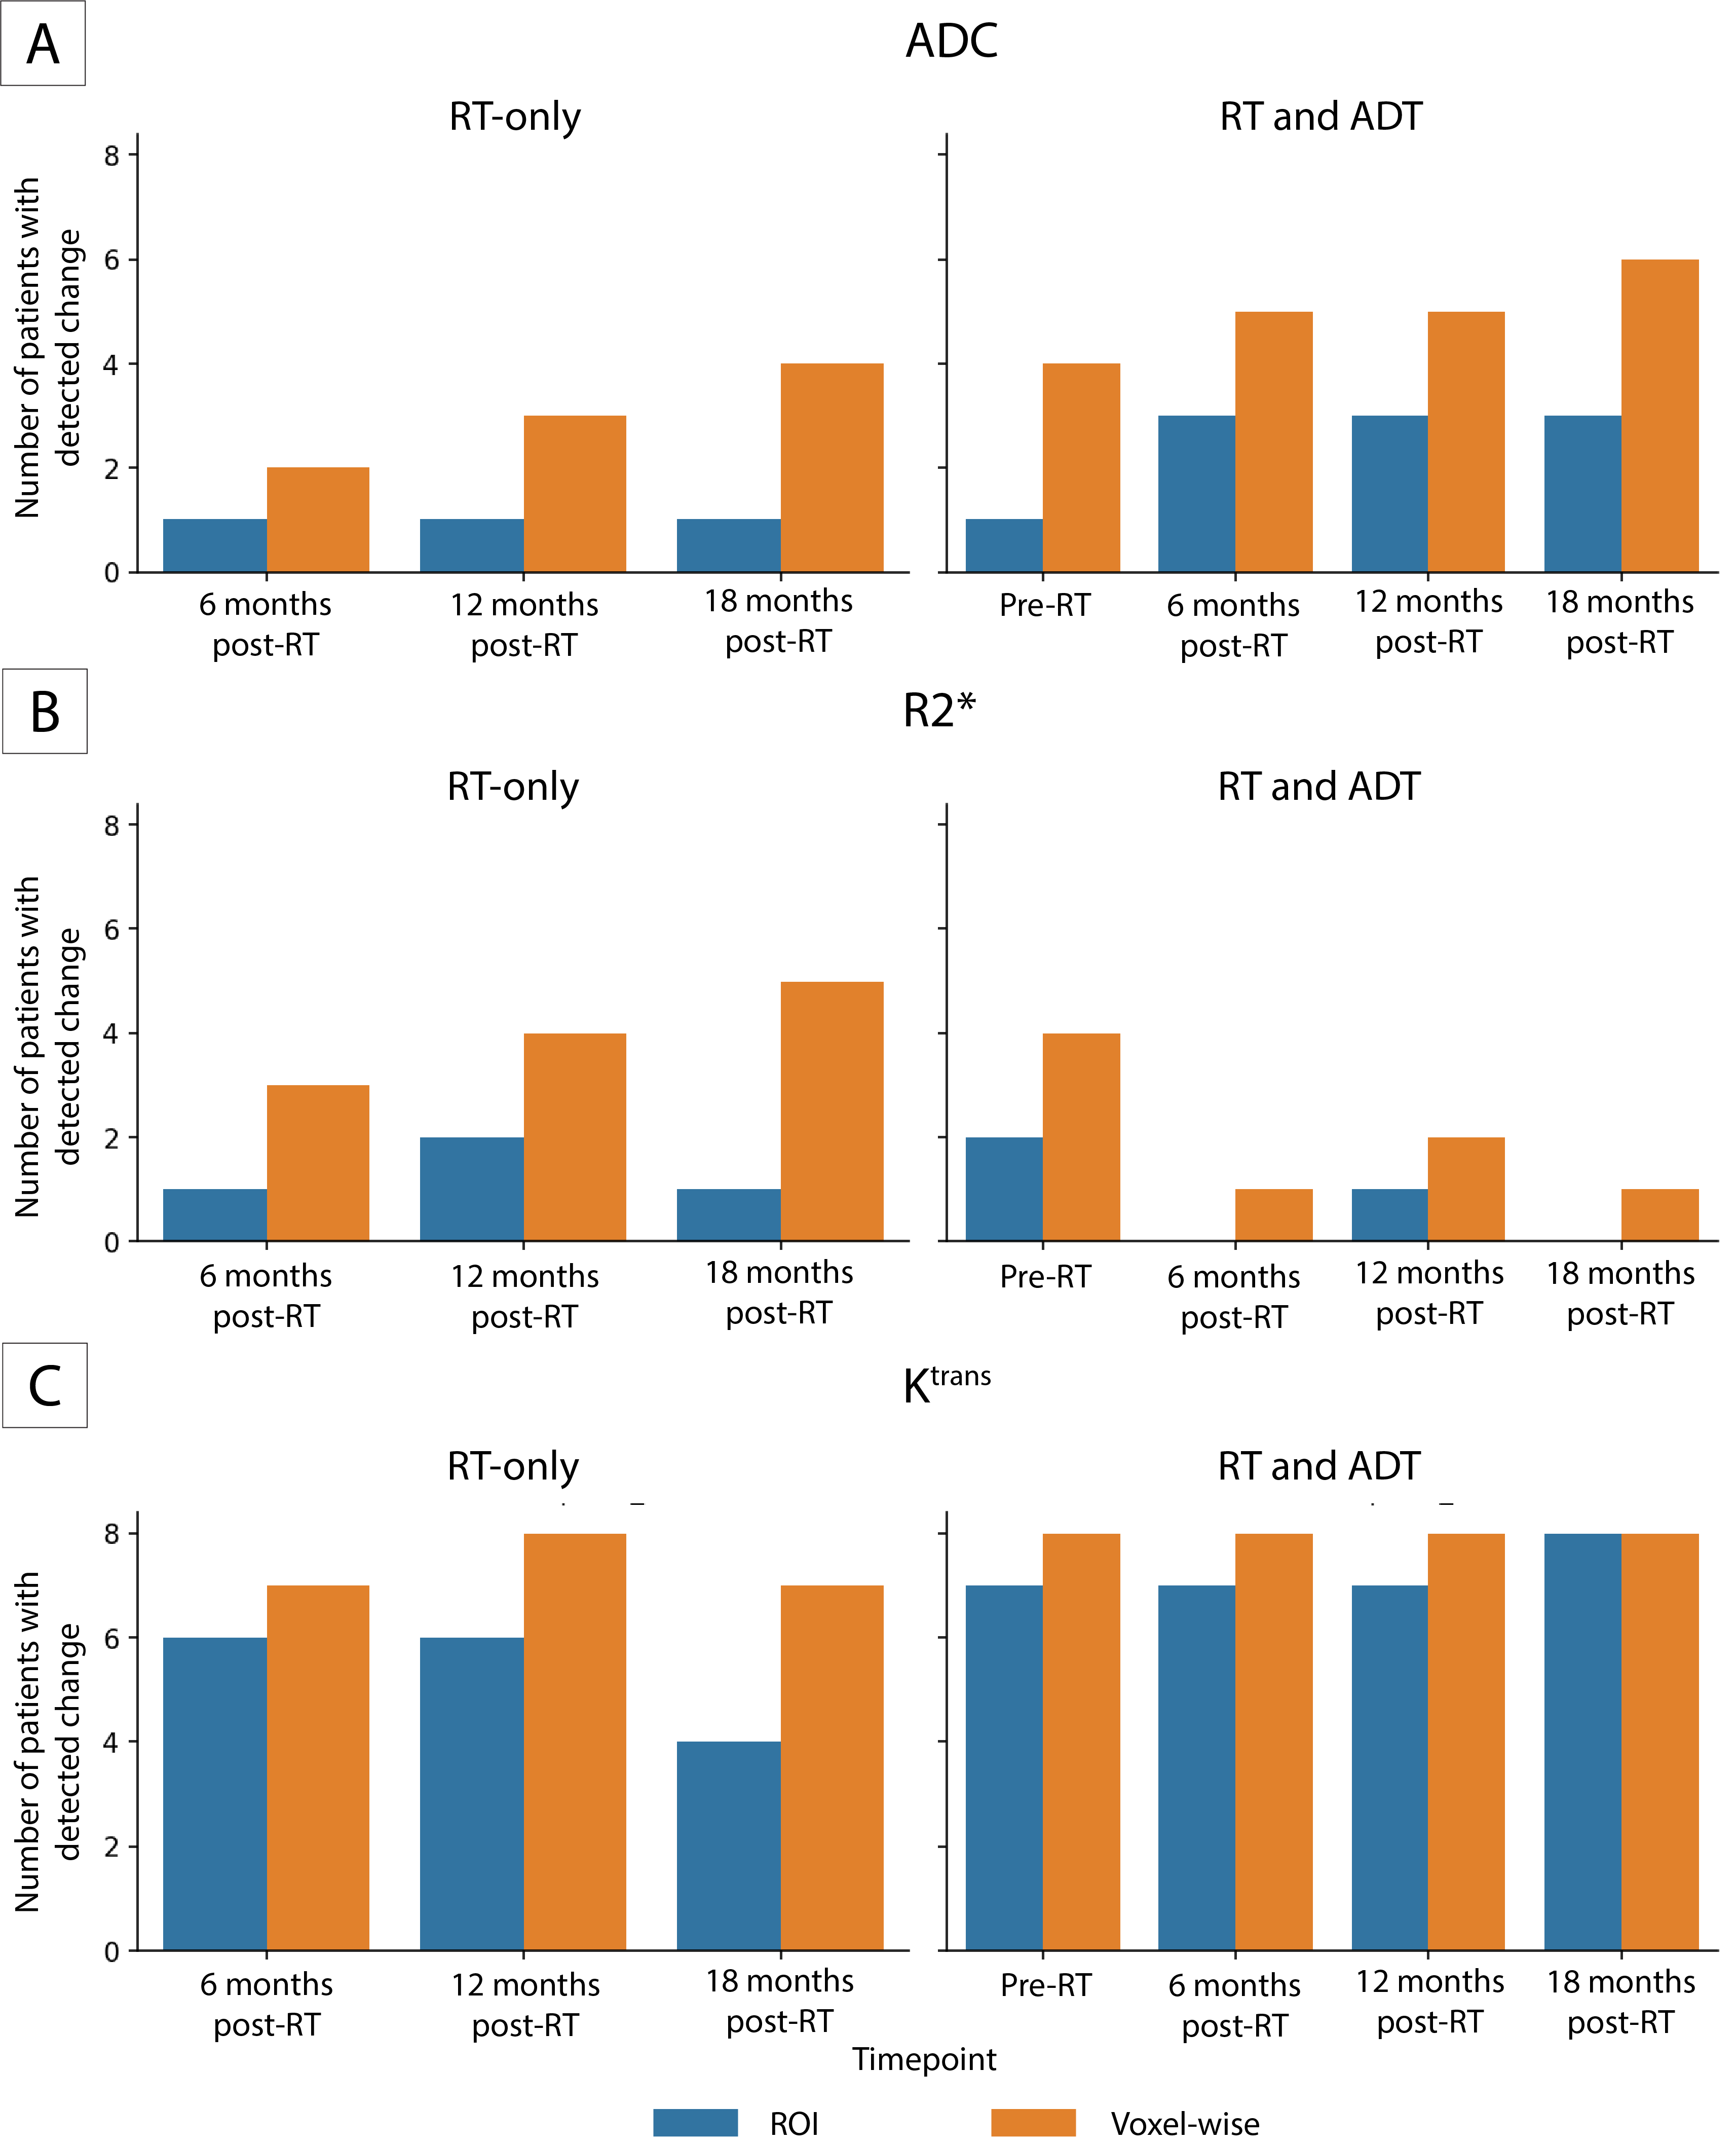
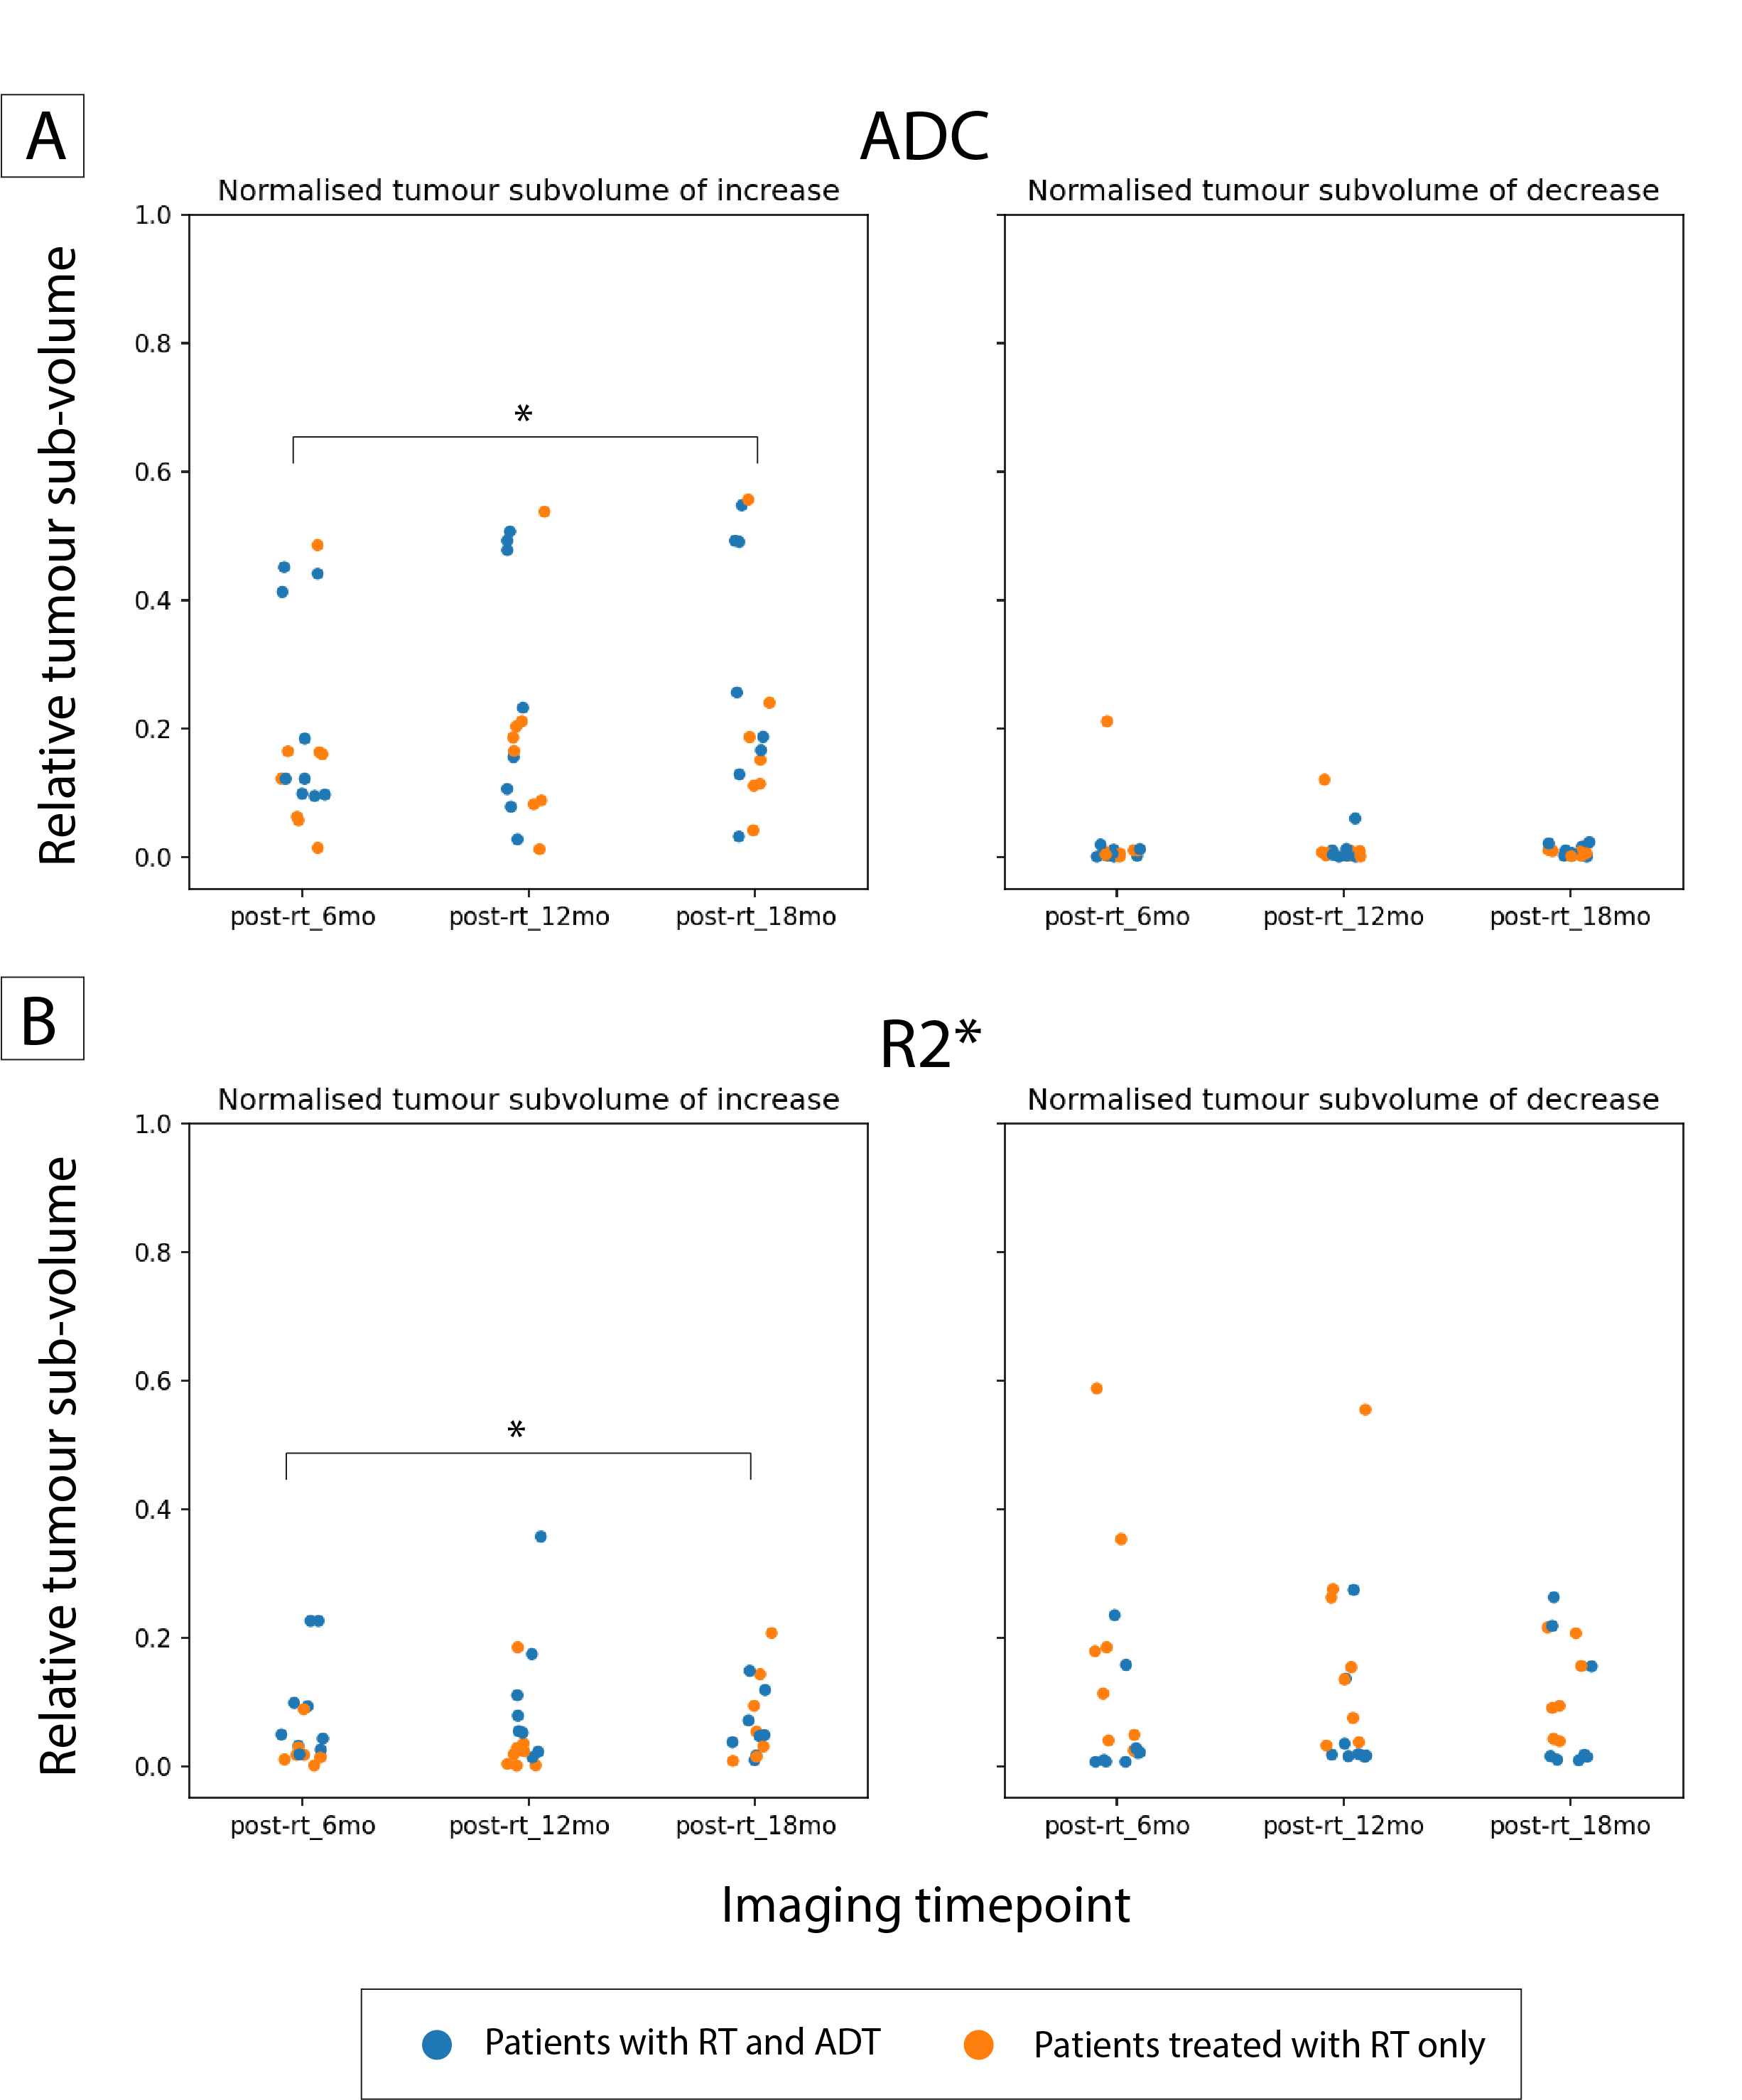
Data from five patients was excluded from the study due to large co-registration errors. Sub-volumes of treatment response were identified using voxel-wise analysis in all qMRI parametric maps. Figure 1 shows example Ktrans and ADC maps with localised changes within the tumour over the follow-up timepoints. While ADC maps showed sub-volumes of increase in ADC at increasing follow-up times, sub-volumes of both increase and decrease were detected in Ktrans and kep maps for 6 of the 16 patients. Voxel-wise analysis of qMRI parameter maps identified a higher number of patients with significant treatment-related changes in the tumour compared to ROI-based approach. Figure 2 shows a comparison of the number of patients identified as showing treatment response using the two approaches. The differences were greatest for ADC and D, with up to 7 patients showing treatment-related changes in voxel-wise analysis, compared to 3 using the ROI-based approach. Significant changes were observed in the size of the sub-volumes relative to the tumour in ADC and R2* maps in non-ADT patients at the 18 month follow-up, indicating the spatial heterogeneity of treatment response (Figure 3). However, in patients treated with ADT and other qMRI parameters, these changes were not significant.Discussion
Generally, ROI-based analysis is the preferred method because it averages out noise in the parametric maps. However, using voxel-wise RC, which takes into account uncertainties associated with image registration, noise in parameter maps and repeatability errors, as a threshold, allows us to identify genuine treatment-induced changes even at the individual voxel level. Results from this study show that voxel-wise analysis is more sensitive to detecting treatment response signals than the ROI-based approach, where changes remain undetected due to averaging. However, oncological outcome data is required to interpret these changes.Conclusion
Voxel-wise analysis reveals heterogeneity in treatment response in qMRI parameter maps, that would otherwise be missed when using ROI-based analysis. Future work in larger cohorts with oncological outcome data is required for clinical validation.Acknowledgements
This work was supported by funding from the National Health and Medical Research Council (NHMRC Project Grant 1126955), Sydney West TCRC Partner Program 2019, and Cancer Institute New South Wales Translational Program Grant (TPG182165). The prototype T1 mapping and DCE-MRI sequence was provided by Siemens, Erlangen, Germany.References
[1] Lee CH, Akin-Olugbade O, Kirschenbaum A. Overview of prostate anatomy, histology, and pathology. Endocrinol Metab Clin North Am 2011;40(3):565-75, viii-ix.[2] O'Connor JPB, Rose CJ, Waterton JC, Carano RAD, Parker GJM, Jackson A. Imaging Intratumor Heterogeneity: Role in Therapy Response, Resistance, and Clinical Outcome. Clin Cancer Res 2015;21(2):249-57.
[3] Wang YF, Tadimalla S, Hayden AJ, Holloway L, Haworth A. Artificial intelligence and imaging biomarkers for prostate radiation therapy during and after treatment. J Med Imaging Radiat Oncol 2021;65(5):612-26.
[4] Sun Y. prostate-mpmri; 2021. Available from: https://github.com/sunyu0410/prostate-mpmri.
[5] Wang Y-F, Tadimalla S, Sun Y, Holloway L, Haworth A. Quantitative MRI: defining measurement uncertainty for detecting treatment response in longitudinal imaging of prostate cancer. Annual Meeting of the ISMRM ANZ Chapter. Sydney, New South Wales, Australia; 2022.
[6] Le Bihan D, Breton E, Lallemand D, Aubin ML, Vignaud J, Laval-Jeantet M. Separation of diffusion and perfusion in intravoxel incoherent motion MR imaging. Radiology 1988;168(2):497-505.
[7] Hompland T, Hole KH, Ragnum HB, Aarnes EK, Vlatkovic L, Lie AK, et al. Combined MR Imaging of Oxygen Consumption and Supply Reveals Tumor Hypoxia and Aggressiveness in Prostate Cancer Patients. Cancer Res 2018;78(16):4774-85.
[8] Hoskin PJ, Carnell DM, Taylor NJ, Smith RE, Stirling JJ, Daley FM, et al. Hypoxia in prostate cancer: correlation of BOLD-MRI with pimonidazole immunohistochemistry-initial observations. Int J Radiat Oncol Biol Phys 2007;68(4):1065-71.
[9] Fennessy FM, Fedorov A, Gupta SN, Schmidt EJ, Tempany CM, Mulkern RV. Practical considerations in T1 mapping of prostate for dynamic contrast enhancement pharmacokinetic analyses. Magn Reson Imaging 2012;30(9):1224-33.
[10] Wang J, Qiu M, Kim H, Constable RT. T1 measurements incorporating flip angle calibration and correction in vivo. J Magn Reson 2006;182(2):283-92.
[11] Tofts PS, Kermode AG. Measurements of the blood-brain barrier permeability and leakage space using dynamic MR imaging. Part 1. Fundamental concepts. Magn Reson Med 1991;17:357.
Figures