0263
Rapid High-Resolution Prostate Diffusion MRI using Eddy Current-Nulled Convex Optimized Diffusion Encoding and Random Matrix Theory Denoising1Department of Radiological Sciences, University of California Los Angeles, Los Angeles, CA, United States, 2Department of Bioengineering, University of California Los Angeles, Los Angeles, CA, United States
Synopsis
Keywords: Prostate, Diffusion/other diffusion imaging techniques, Prostate, Diffusion Denoising
Motivation: High-resolution (HR) DWI, although beneficial for prostate tissue characterization and cancer diagnosis, suffers from low signal-to-noise ratio (SNR). The common strategy of averaging to increase SNR prolongs the acquisition time (TA).
Goal(s): Decreasing the number of repetitions for averaging while maintaining the SNR for HR prostate DWI.
Approach: Eddy Current-Nulled Convex Optimized Diffusion Encoding (ENCODE) combined with random matrix theory (RMT)-based denoising to reduce the repetitions while maintaining SNR.
Results: HR-ENCODE-RMT (TA=2 min 30 sec) improved SNR for rapid prostate HR-DWI, and achieved consistent and precise apparent diffusion coefficient (ADC) mapping compared to standard-resolution bipolar DWI (TA=5 min 50 sec).
Impact: Eddy Current-Nulled Convex Optimized Diffusion Encoding combined with Random Matrix Theory-based denoising enables rapid high-resolution prostate DWI using fewer repetitions while maintaining the signal-to-noise ratio and robustness of apparent diffusion coefficient maps. This method could improve characterization of prostate cancer.
Introduction
High-resolution (HR; e.g., in-plane 1.0x1.0 mm2) diffusion-weighted imaging (DWI) can characterize prostate tissue on a finer scale than standard-resolution DWI and improve the diagnosis and grading of prostate cancer (PCa)1-7 . However, increasing the resolution penalizes the signal-to-noise ratio (SNR), which degrades image quality and causes errors in the apparent diffusion coefficient (ADC) 8,9. DWI commonly acquires multiple repetitions for signal averaging to increase SNR, but this prolongs acquisition time (TA).Reduced field-of-view (rFOV) Eddy Current-Nulled Convex Optimized Diffusion Encoding (ENCODE) minimizes the echo time (TE) to improve the SNR and compensates for eddy current effects and susceptibility-induced distortions 10-15. On the other hand, Random Matrix Theory (RMT)-based denoising techniques such as Marchenko-Pastur principal component analysis (MP-PCA) suppresses noise by exploiting the redundancy across diffusion encodings and leveraging noise statistics predicted by RMT.16-19 RMT-based denoising can potentially reduce the number of repetitions for averaging while maintaining SNR.
We propose combining rFOV-ENCODE and RMT-based denoising to reduce TA using fewer repetitions than standard acquisitions, while maintaining the SNR and robustness of ADC maps to enable rapid HR prostate DWI.
Methods
Data AcquisitionIn an IRB-approved and HIPAA-compliant study, 11 males (age: 63±11; body-mass index: 25.3±6.5 kg/m2; prostate-specific antigen levels: 5.8±2.4 ng/ml) with clinical suspicion of PCa were scanned at 3T (6 on Prisma, 5 on Vida; Siemens). The protocol consisted of a rFOV HR-ENCODE (1.0x1.0 mm2) DWI sequence15, a standard-resolution (1.6x2.2 mm2) clinical bipolar DWI sequence with matched parameters, including TA of 5:50 (min:sec) (Table 1), and a T2-weighted TSE sequence (0.6x0.6 mm2). The ENCODE data were retrospectively undersampled from 7 to 3 repetitions, reducing the effective TA to 2:30 (Fig. 1a).
RMT Denoising and Reconstruction
The proposed pipeline is shown in Fig. 1(b). After signal decorrelation, linear phase correction was performed.20 The diffusion directions for each b-value in each repetition were concatenated into a joint diffusion-repetition dimension (Ndiff= 30: 3 repetitions, 10 diffusion encodings). MP-PCA denoising with a patch size of 3x3 was applied to the Ndiff aliased complex-valued DW images for each slice. The images were reconstructed using GRAPPA and coil-combined.22 Trace-weighted DW images were generated for ADC calculation.
Analysis and Evaluation
The complex residuals (i.e., differences) between the HR-ENCODE and HR-ENCODE-RMT images were compared to a zero-mean Gaussian distribution.16,17 In the prostate peripheral zone (PZ) and transition zone (TZ) on mid-gland slices, the apparent SNR (aSNR)21 was calculated using the trace-weighted b=800s/mm2 DW images from the two sets (each with 3 repetitions; Fig. 1a). The coefficient of variation of the ADC maps (ADC-CoV) between the 2 sets were evaluated. The medians of the differences were compared using two-sided-Wilxocon signed rank tests (p<0.05 considered significant). The agreement between the ADC maps of HR-ENCODE and HR-ENCODE-RMT compared to the standard-resolution bipolar DWI (7 repetitions) was assessed through Bland-Altman analyses; the mean differences (MD) were reported.
Results
No identifiable anatomical tissue features were present in the residuals (Fig. 2a). The regression line had a close agreement with the reference line, showing that the removed noise resembled a zero-mean Gaussian distribution (Fig.2b).Figure 3 shows that RMT produced sharp ENCODE images, with denoising effects becoming more apparent for b ≥ 400 s/mm2. The representative maps in Fig. 3b-c show the improvement of aSNR and reduction in ADC-CoV by RMT denoising. HR-ENCODE-RMT yielded 62% and 56% higher median aSNR (Fig. 4a), and 63% and 70% lower ADC-CoV, than HR-ENCODE in PZ and TZ, respectively (Fig. 4b). ENCODE-RMT mitigated the bias in ADC by reducing the noise floor. HR-ENCODE-RMT and bipolar ADC had low MD (Fig. 4c-d).
Discussion
HR-ENCODE-RMT enabled rapid HR prostate DWI (3 repetitions; TA=2:30) from both the acquisition and reconstruction aspects. rFOV-ENCODE reduced TE by ~20 ms compared to standard-resolution bipolar DWI (7 repetitions; TA=5:50), increasing the aSNR and geometric fidelity of the prostate.12 RMT-based denoising further suppressed noise and improved the SNR. Even for high b-values (b ≥400 s/mm2) and reduced averaging, which intrinsically have low SNR, the technique improved aSNR and ADC mapping. An average of 1.6-fold improvement of aSNR for HR-ENCODE-RMT was observed in PZ and TZ, which translated into reductions in the ADC-CoV maps and the low MD in ADC measurements. This suggests that the acquisition time can be potentially decreased with fewer number of repetitions using RMT-based denoising. The technique enables HR-DWI for prostate without sacrificing the number of b-values, diffusion directions, or SNR.Conclusion
ENCODE DWI combined with RMT-based denoising can maintain SNR and ADC accuracy for rapid high-resolution prostate DWI.Acknowledgements
This work was supported in part by the National Cancer Institute under award number R01CA248506, the Jonsson Comprehensive Cancer Center at UCLA, and the Integrated Diagnostics Program in the Departments of Radiological Sciences and Pathology of the David Geffen School of Medicine at UCLA. The content is solely the responsibility of the authors and does not necessarily represent the official views of the National Institutes of Health.References
1. Fütterer JJ. High-Resolution Diffusion-weighted Imaging Increases Prostate Cancer Visibility? EBioMedicine. 2016;7:12.2. Medved M, Soylu-Boy FN, Karademir I, et al. High-resolution diffusion-weighted imaging of the prostate. American Journal of Roentgenology. 2014;203(1):85-90.
3. Nguyen C, Sharif‐Afshar AR, Fan Z, et al. 3 D high‐resolution diffusion‐weighted MRI at 3 T: Preliminary application in prostate cancer patients undergoing active surveillance protocol for low‐risk prostate cancer. Magnetic resonance in medicine. 2016;75(2):616-626.
4. Reischauer C, Wilm BJ, Froehlich JM, et al. High-resolution diffusion tensor imaging of prostate cancer using a reduced FOV technique. European journal of radiology. 2011;80(2):e34-e41.
5. Sharif-Afshar A-R, Nguyen C, Feng TS, et al. Prospective pilot trial to evaluate a high resolution diffusion-weighted MRI in prostate cancer patients. EBioMedicine. 2016;7:80-84.
6. Bourne R, Panagiotaki E. Limitations and prospects for diffusion-weighted MRI of the prostate. Diagnostics. 2016;6(2):21.
7. Langer DL, van der Kwast TH, Evans AJ, et al. Intermixed normal tissue within prostate cancer: effect on MR imaging measurements of apparent diffusion coefficient and T2—sparse versus dense cancers. Radiology. 2008;249(3):900-908.
8. Wu W, Miller KL. Image formation in diffusion MRI: a review of recent technical developments. Journal of Magnetic Resonance Imaging. 2017;46(3):646-662.
9. Jambor I (2017) Optimization of prostate MRI acquisition and post-processing protocol: a pictorial review with access to acquisition protocols. Acta Radiologica Open 6:2058460117745574
10. Jambor I. Optimization of prostate MRI acquisition and post-processing protocol: a pictorial review with access to acquisition protocols. Acta Radiologica Open. 2017;6(12):2058460117745574.
11. Aliotta E, Moulin K, Ennis DB. Eddy current–nulled convex optimized diffusion encoding (EN‐CODE) for distortion‐free diffusion tensor imaging with short echo times. Magnetic resonance in medicine. 2018;79(2):663-67212.
12. Zhang Z, Moulin K, Aliotta E, et al. Prostate diffusion MRI with minimal echo time using eddy current nulled convex optimized diffusion encoding. Journal of Magnetic Resonance Imaging. 2020;51(5):1526-1539.
13. Kyriazi S, Blackledge M, Collins DJ, Desouza NM. Optimising diffusion-weighted imaging in the abdomen and pelvis: comparison of image quality between monopolar and bipolar single-shot spin-echo echo-planar sequences. European radiology. 2010;20:2422-2431.
14. Reese TG, Heid O, Weisskoff R, Wedeen V. Reduction of eddy‐current‐induced distortion in diffusion MRI using a twice‐refocused spin echo. Magnetic Resonance in Medicine. 2003;49(1):177-182.
15. Wilm BJ, Svensson J, Henning A, Pruessmann KP, Boesiger P, Kollias SS. Reduced field‐of‐view MRI using outer volume suppression for spinal cord diffusion imaging. Magnetic Resonance in Medicine. 2007;57(3):625-630
16. Marchenko VA, Pastur LA. Distribution of eigenvalues for some sets of random matrices. Matematicheskii Sbornik. 1967;114(4):507-536.
17. Veraart J, Novikov DS, Christiaens D, Ades-Aron B, Sijbers J, Fieremans E. Denoising of diffusion MRI using random matrix theory. Neuroimage. 2016;142:394-406.
18. Gavish M, Donoho DL. Optimal shrinkage of singular values. IEEE Transactions on Information Theory. 2017;63(4):2137-2152.
19. Lemberskiy G, Mazaheri Y, Vargas HA, Otazo R, Fieremans E, Novikov DS. Reducing scan time of routine prostate diffusion-weighted imaging using random matrix theory reconstruction. Proceedings of the 28th Annual Meeting of ISMRM. 2020
20. Lemberskiy G, Baete S, Veraart J, Shepherd TM, Fieremans E, Novikov DS. Achieving sub-mm clinical diffusion MRI resolution by removing noise during reconstruction using random matrix theory. Proceedings of the 27th Annual Meeting of ISMRM, 2019.
21. Dietrich O, Raya JG, Reeder SB, Reiser MF, Schoenberg SO. Measurement of signal‐to‐noise ratios in MR images: influence of multichannel coils, parallel imaging, and reconstruction filters. Journal of Magnetic Resonance Imaging. 2007;26(2):375-385.
22. Walsh DO, Gmitro AF, Marcellin MW. Adaptive reconstruction of phased array MR imagery. Magnetic Resonance in Medicine. 2000;43(5):682-690.
Figures
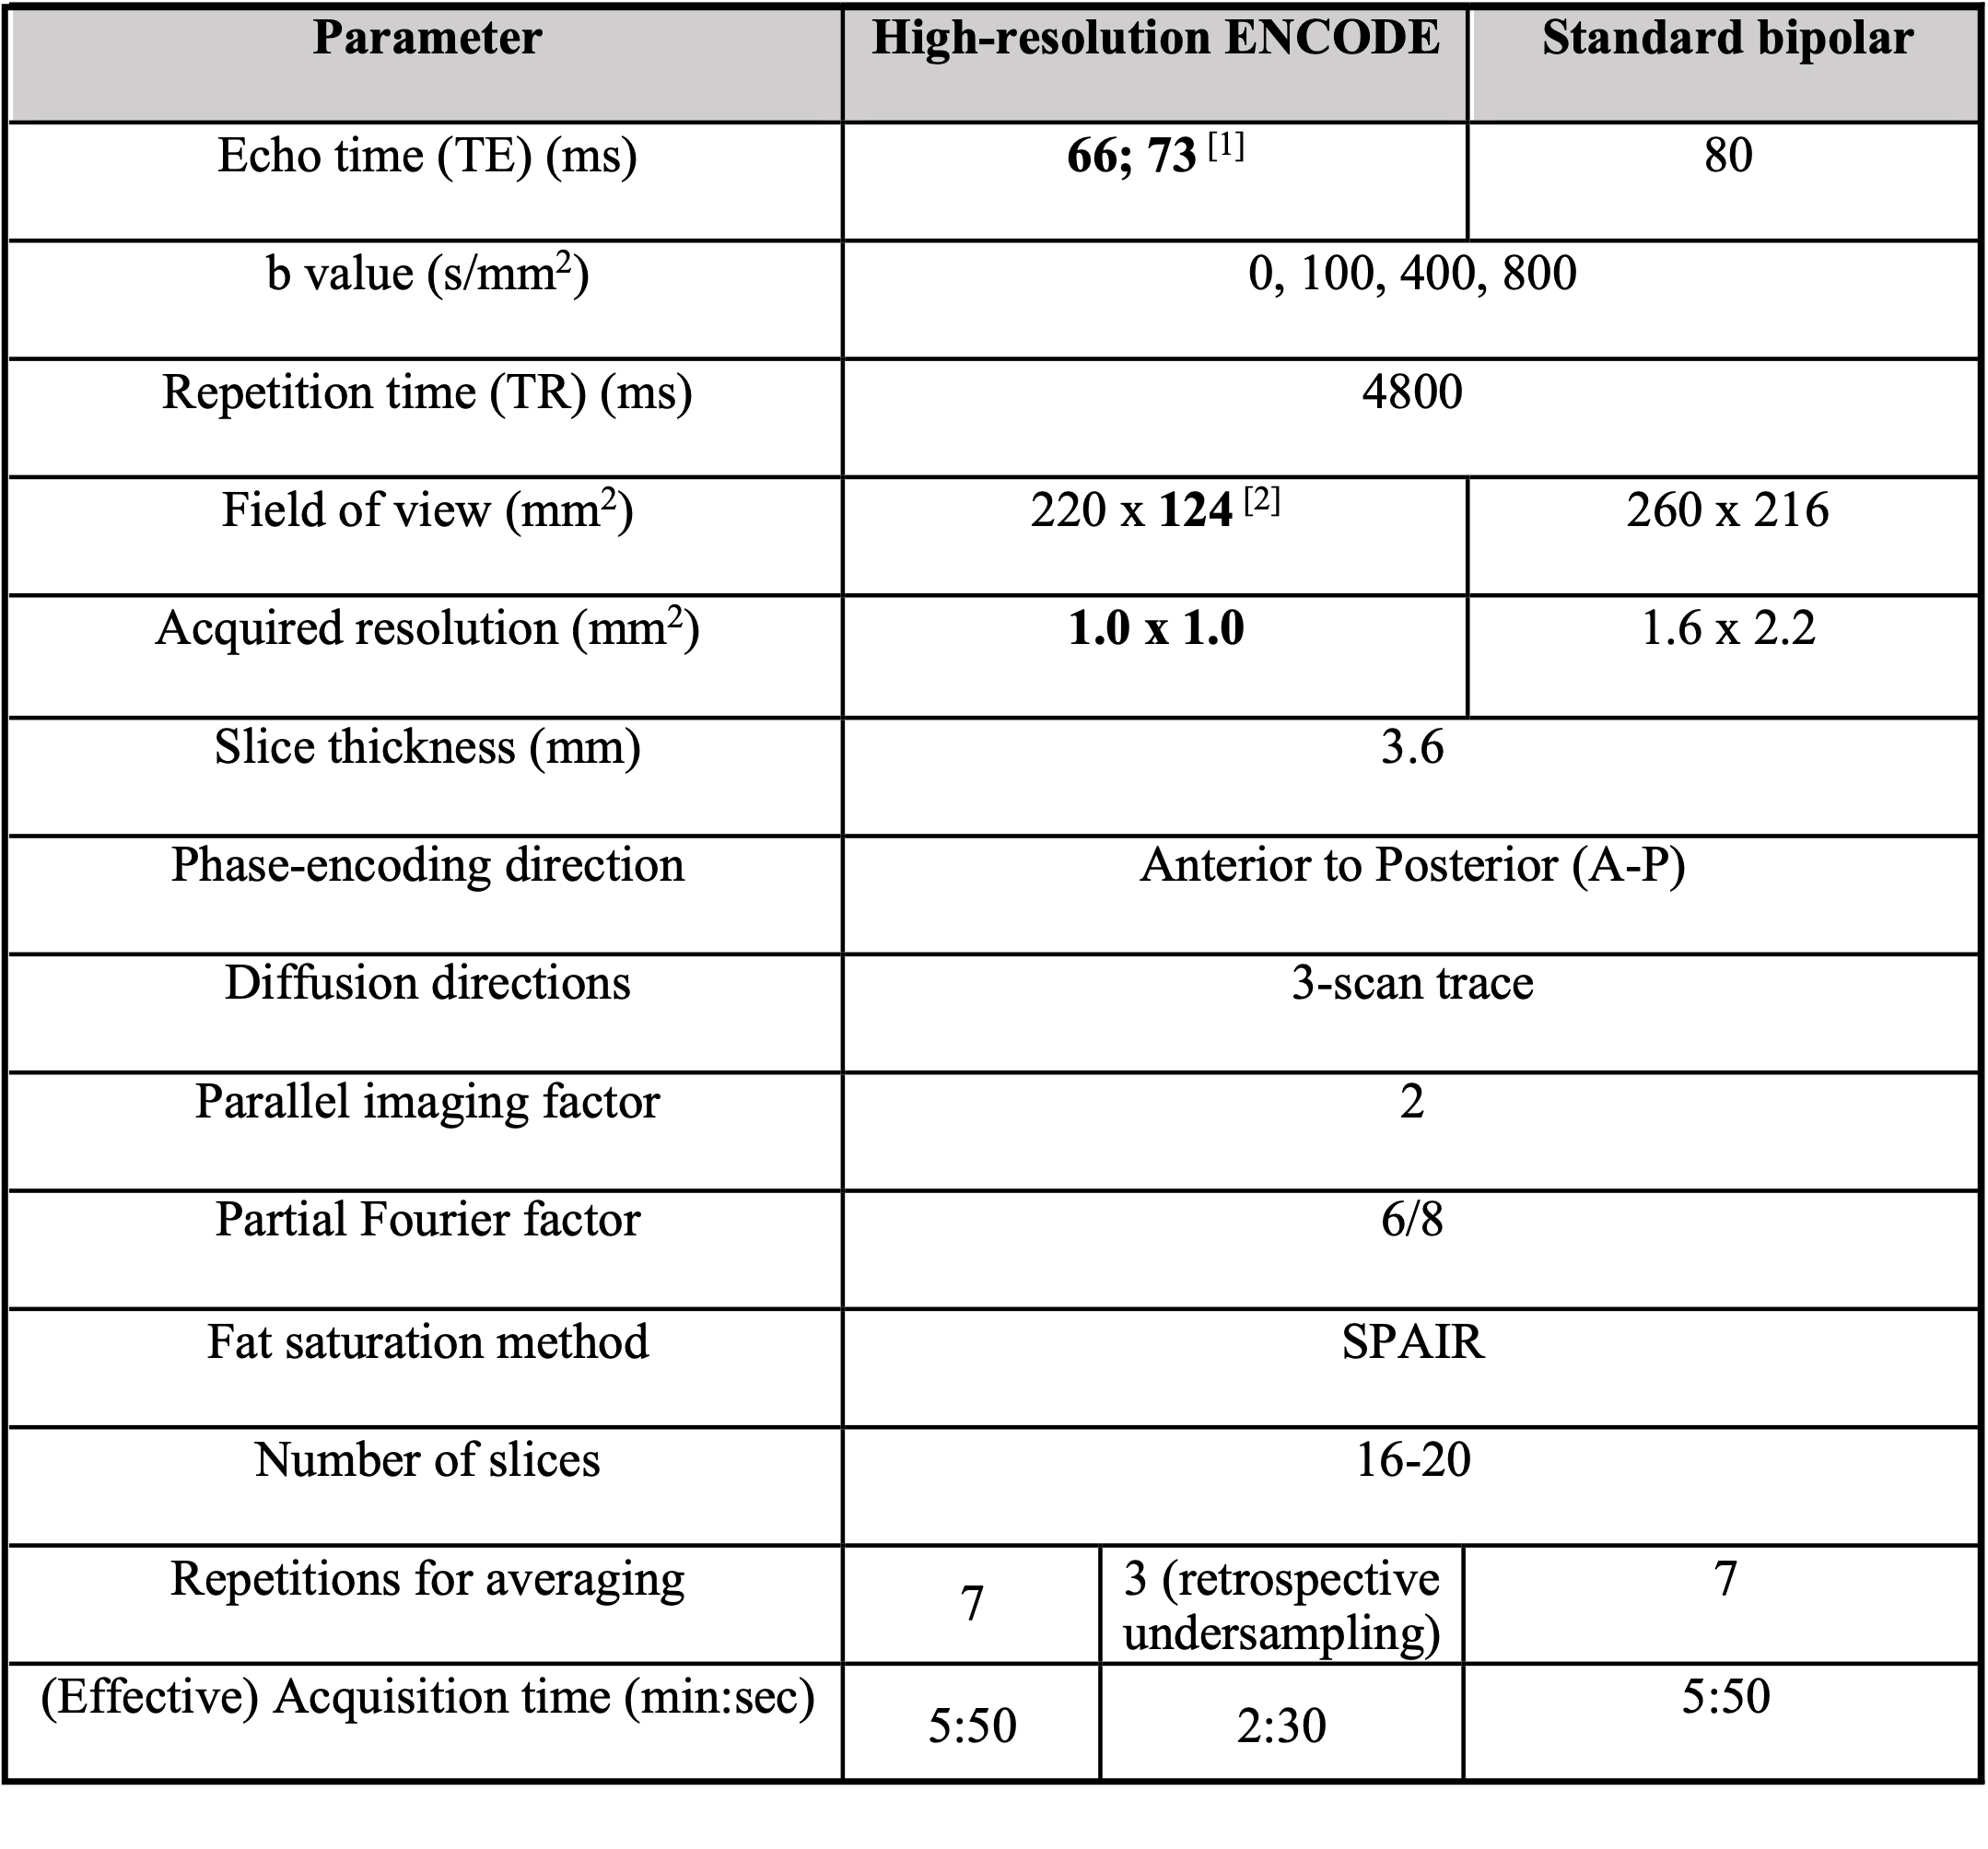

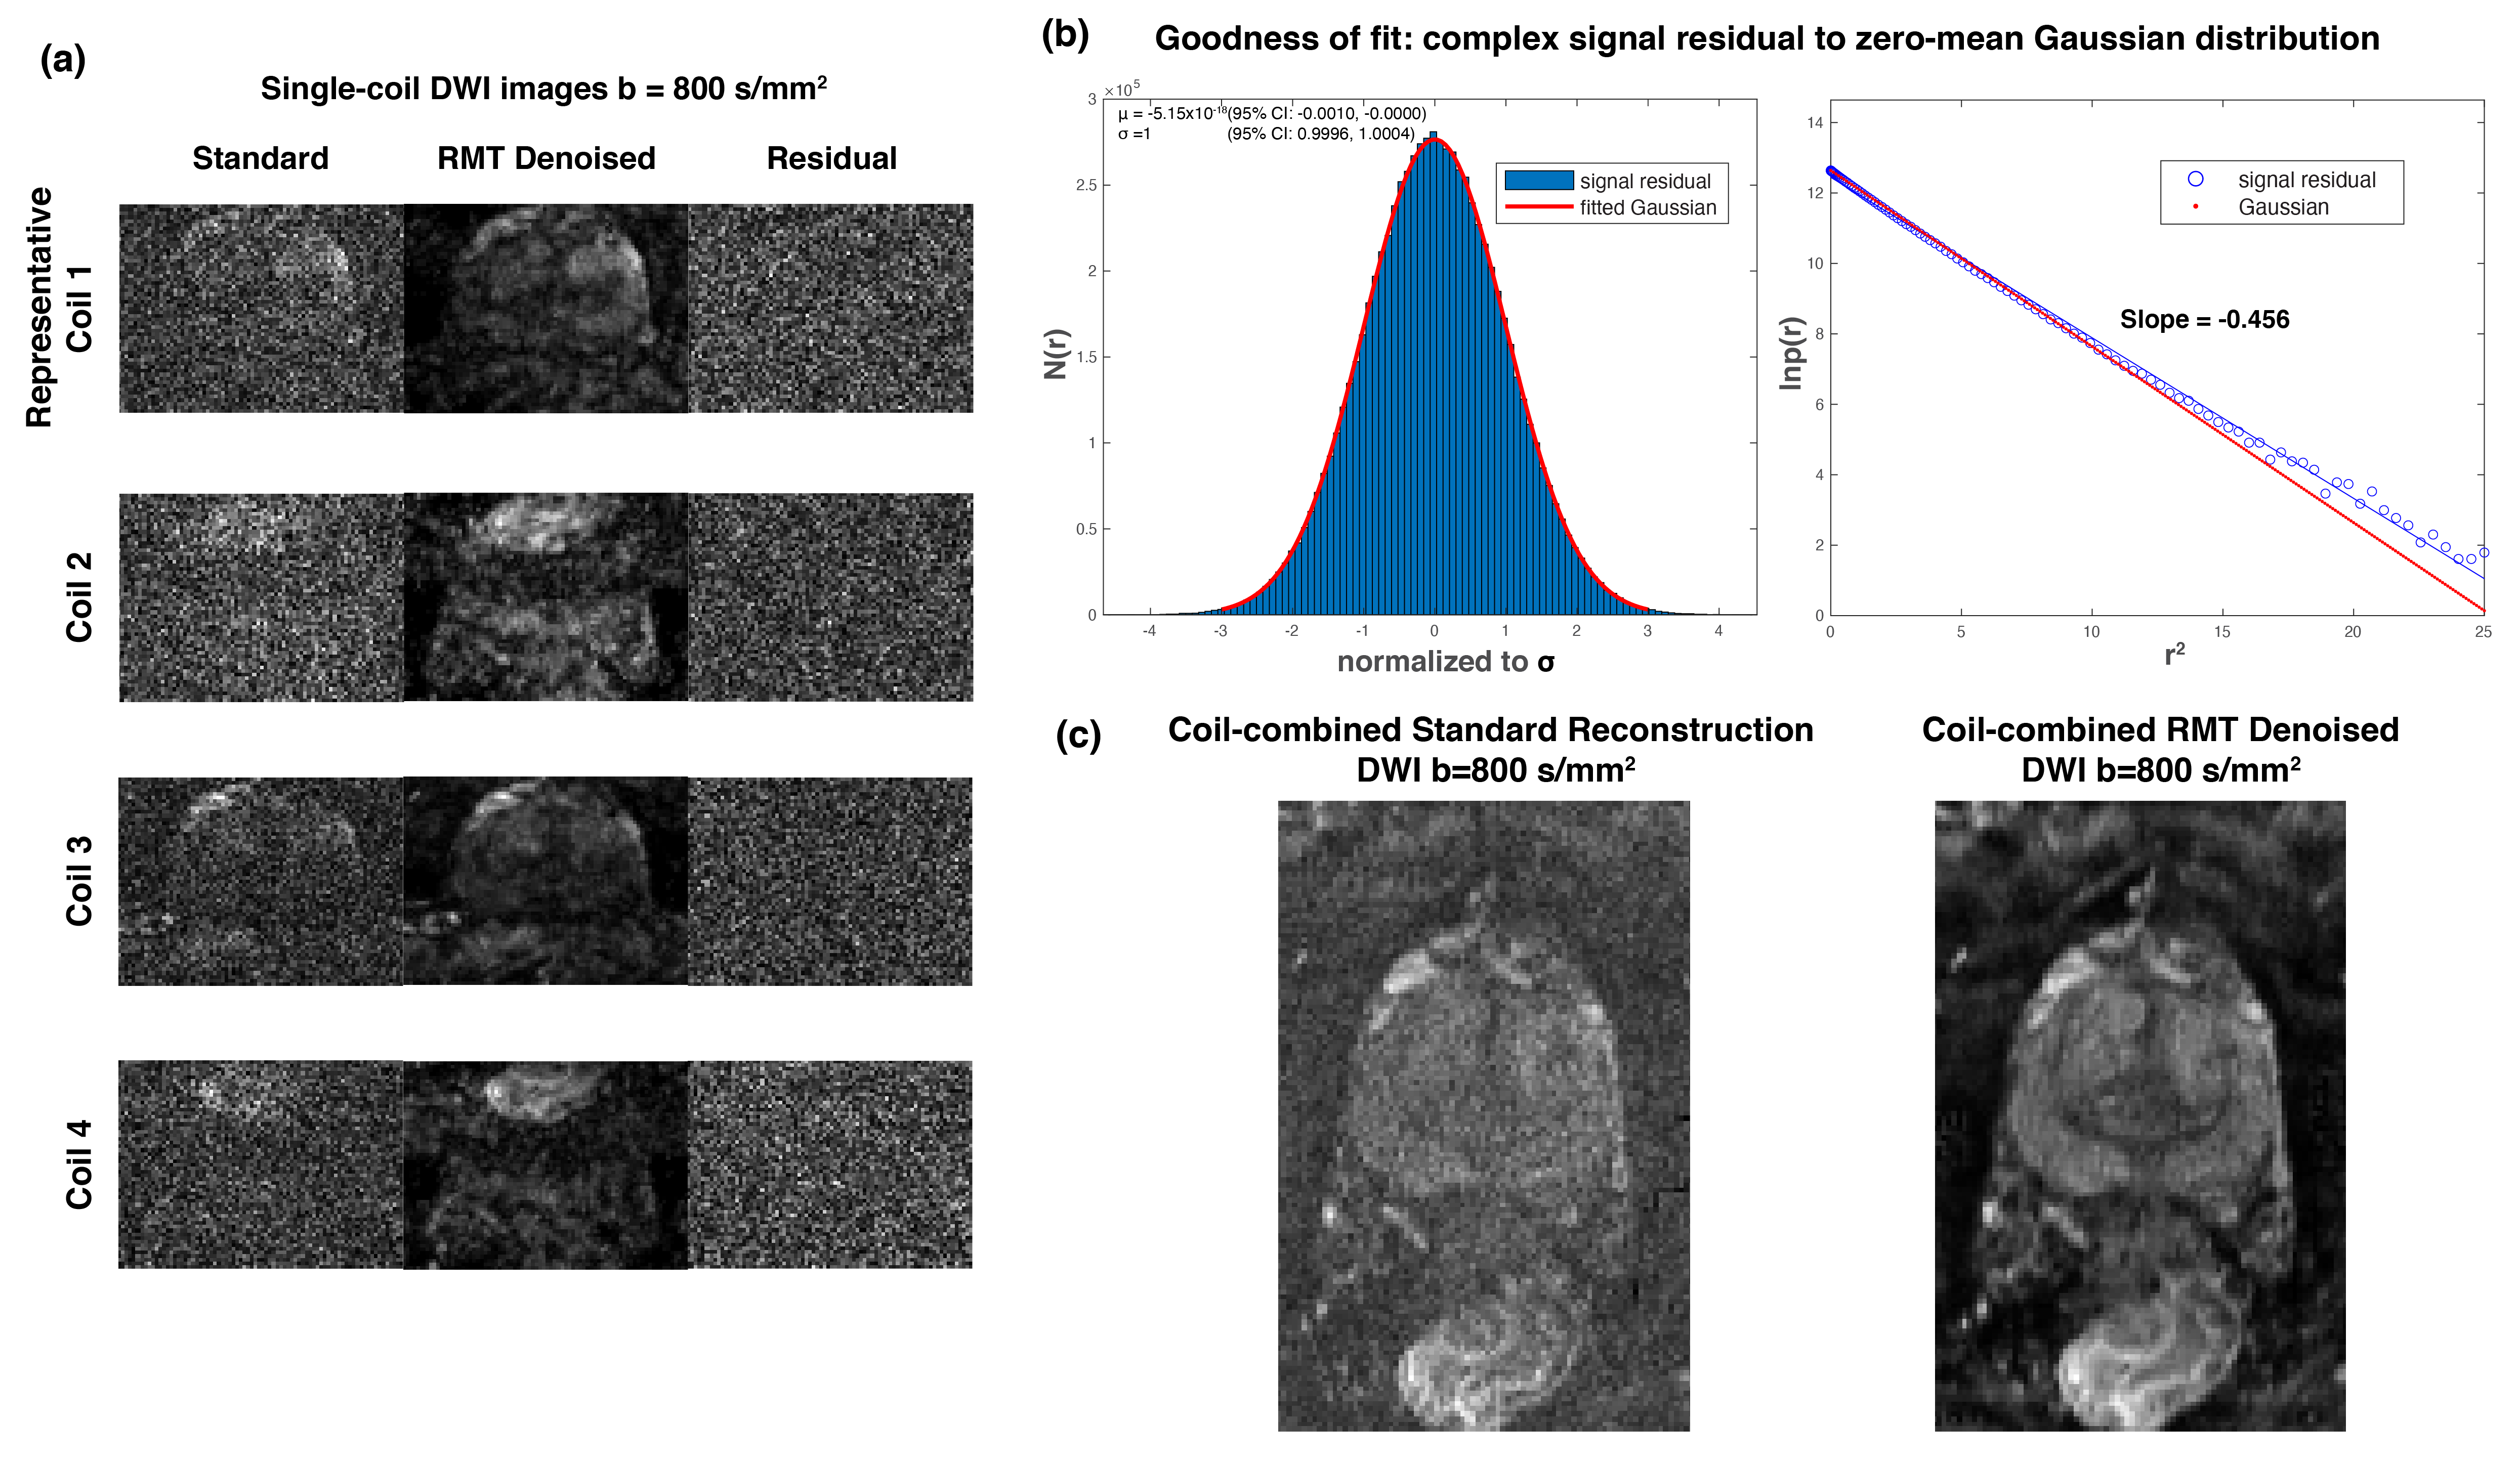
Figure 2. (a) Coil images for standard ENCODE and ENCODE-RMT and their signal residuals (differences). The residuals showed no identifiable anatomical details. (b) Real and imaginary parts of the residuals pooled together for analysis across all slices and coil channels. The blue line is the linear regression of log probability density of the complex residuals ln(p(r)) versus the squared sample residual magnitude r2, and the red line indicates the ideal Gaussian distribution with slope = -0.5. (c) Comparison of coil-combined DWI for b=800 s/mm2 for standard ENCODE and ENCODE-RMT.
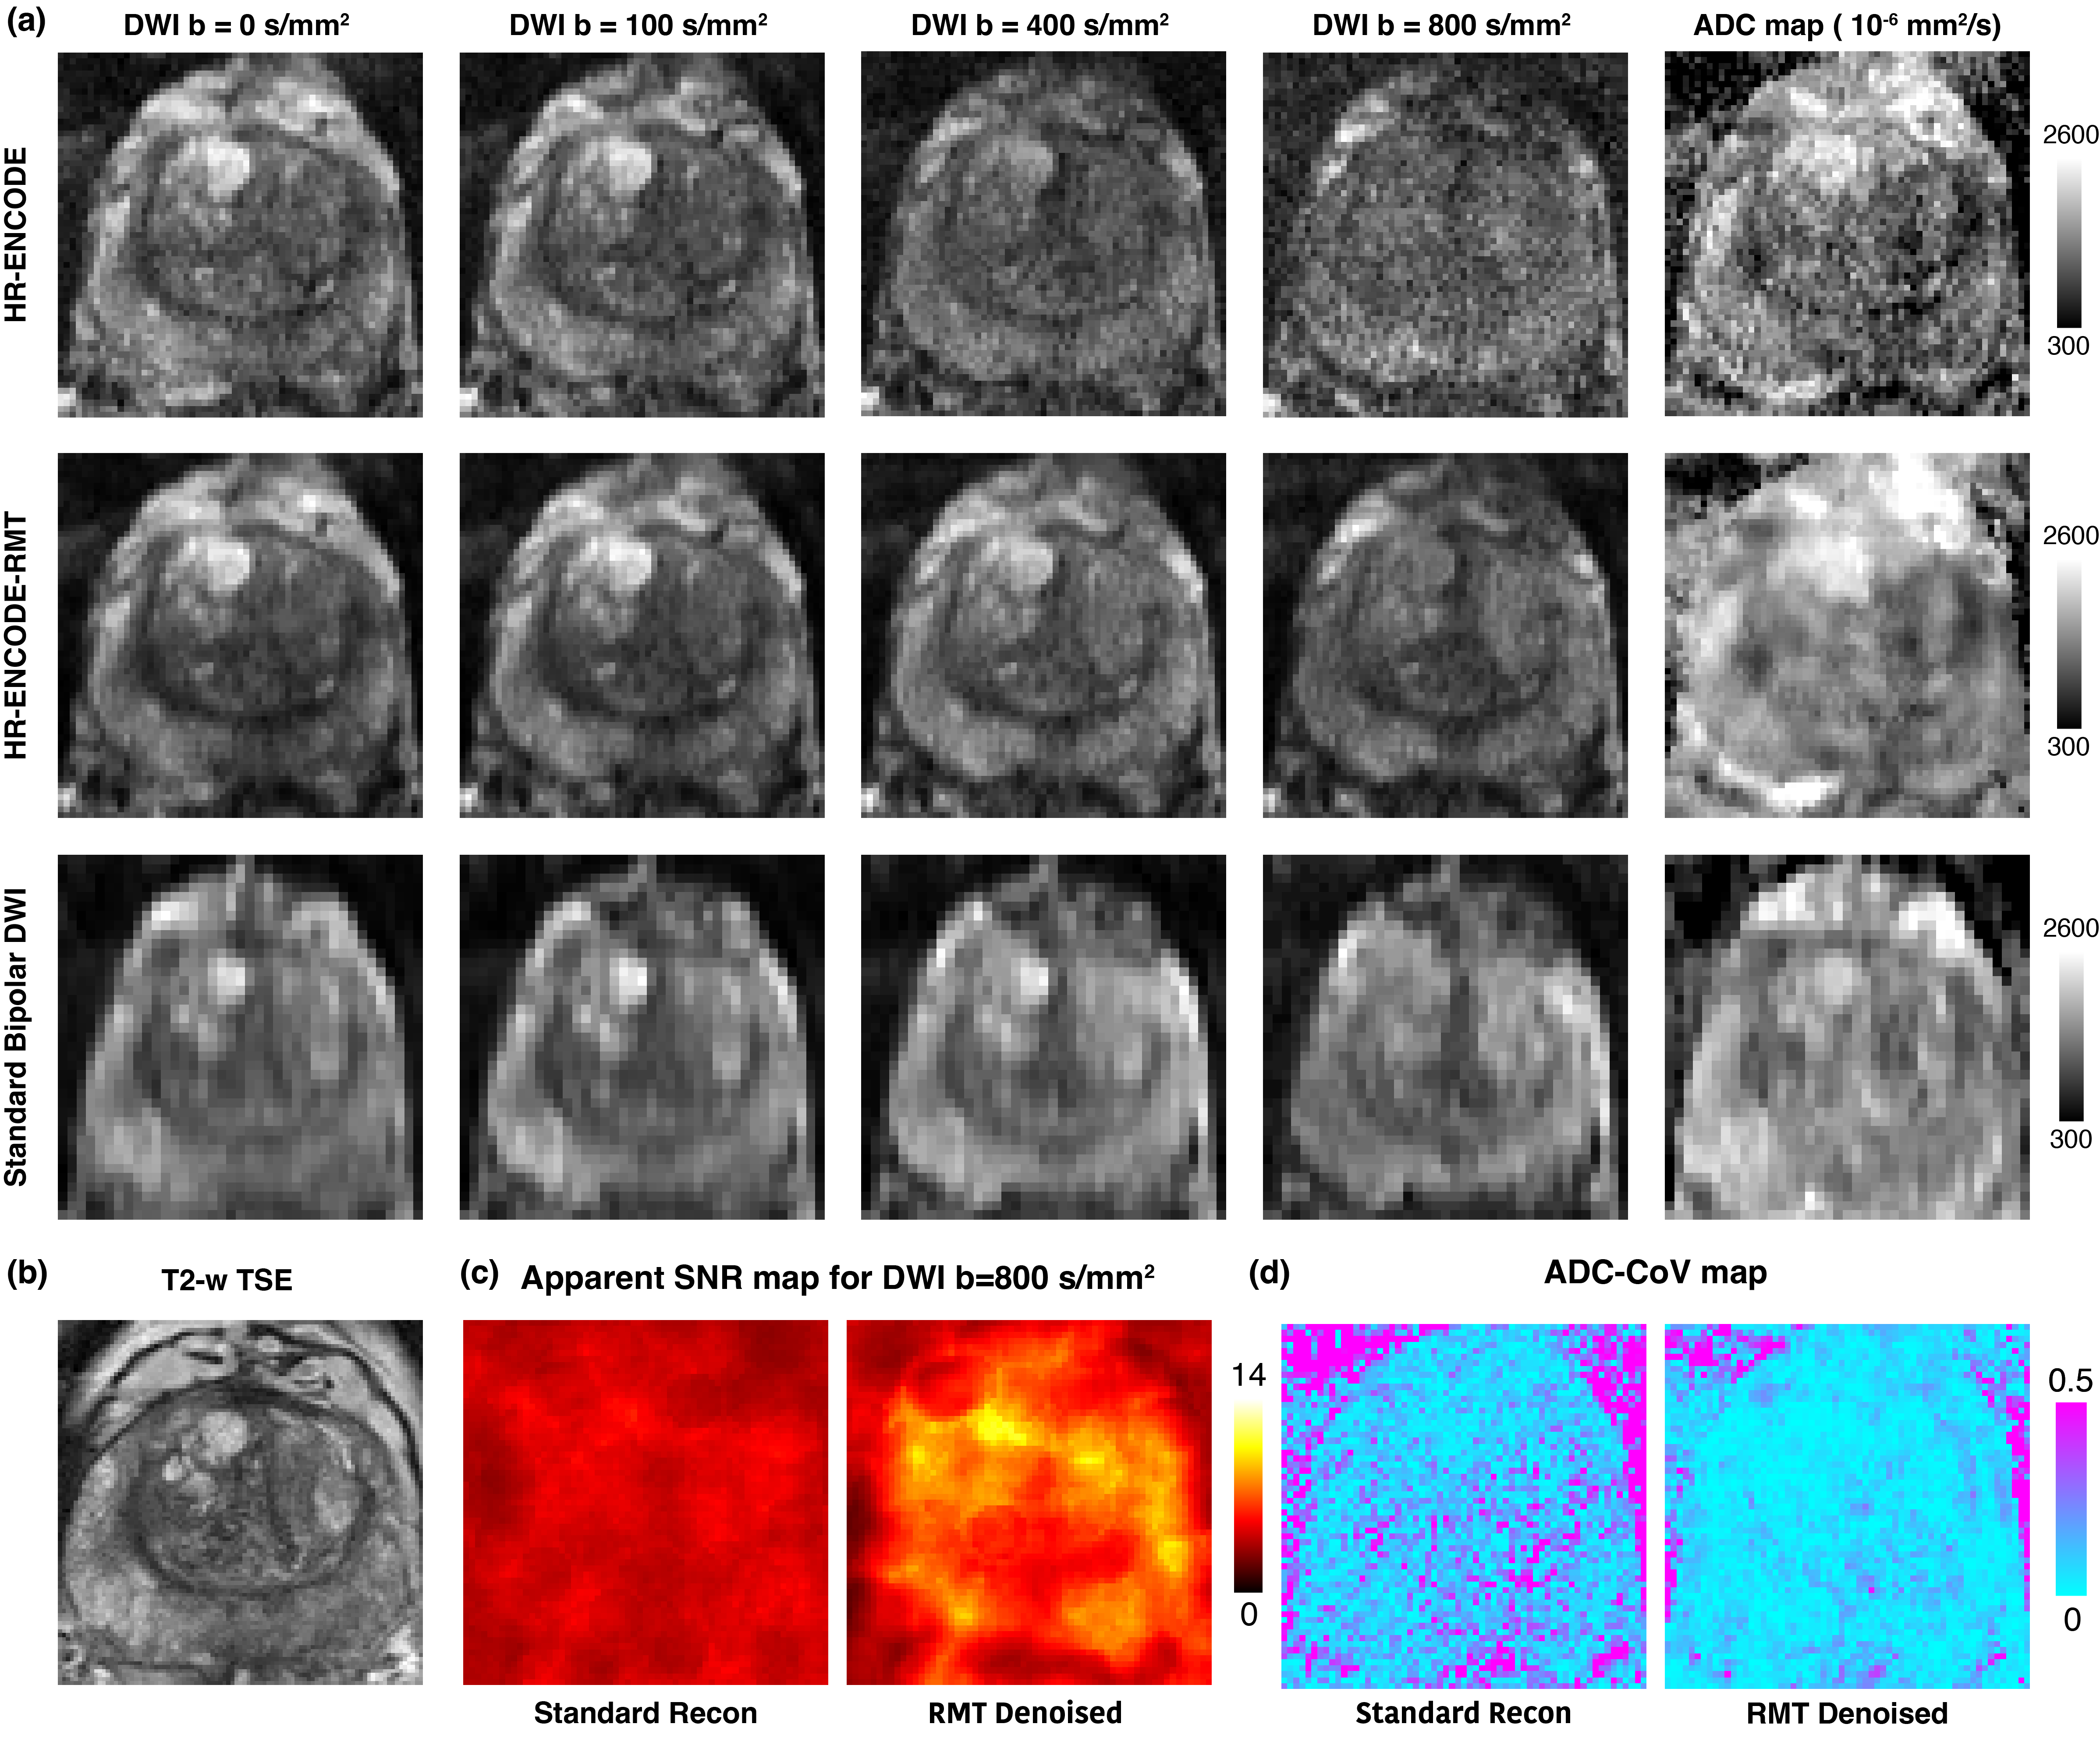
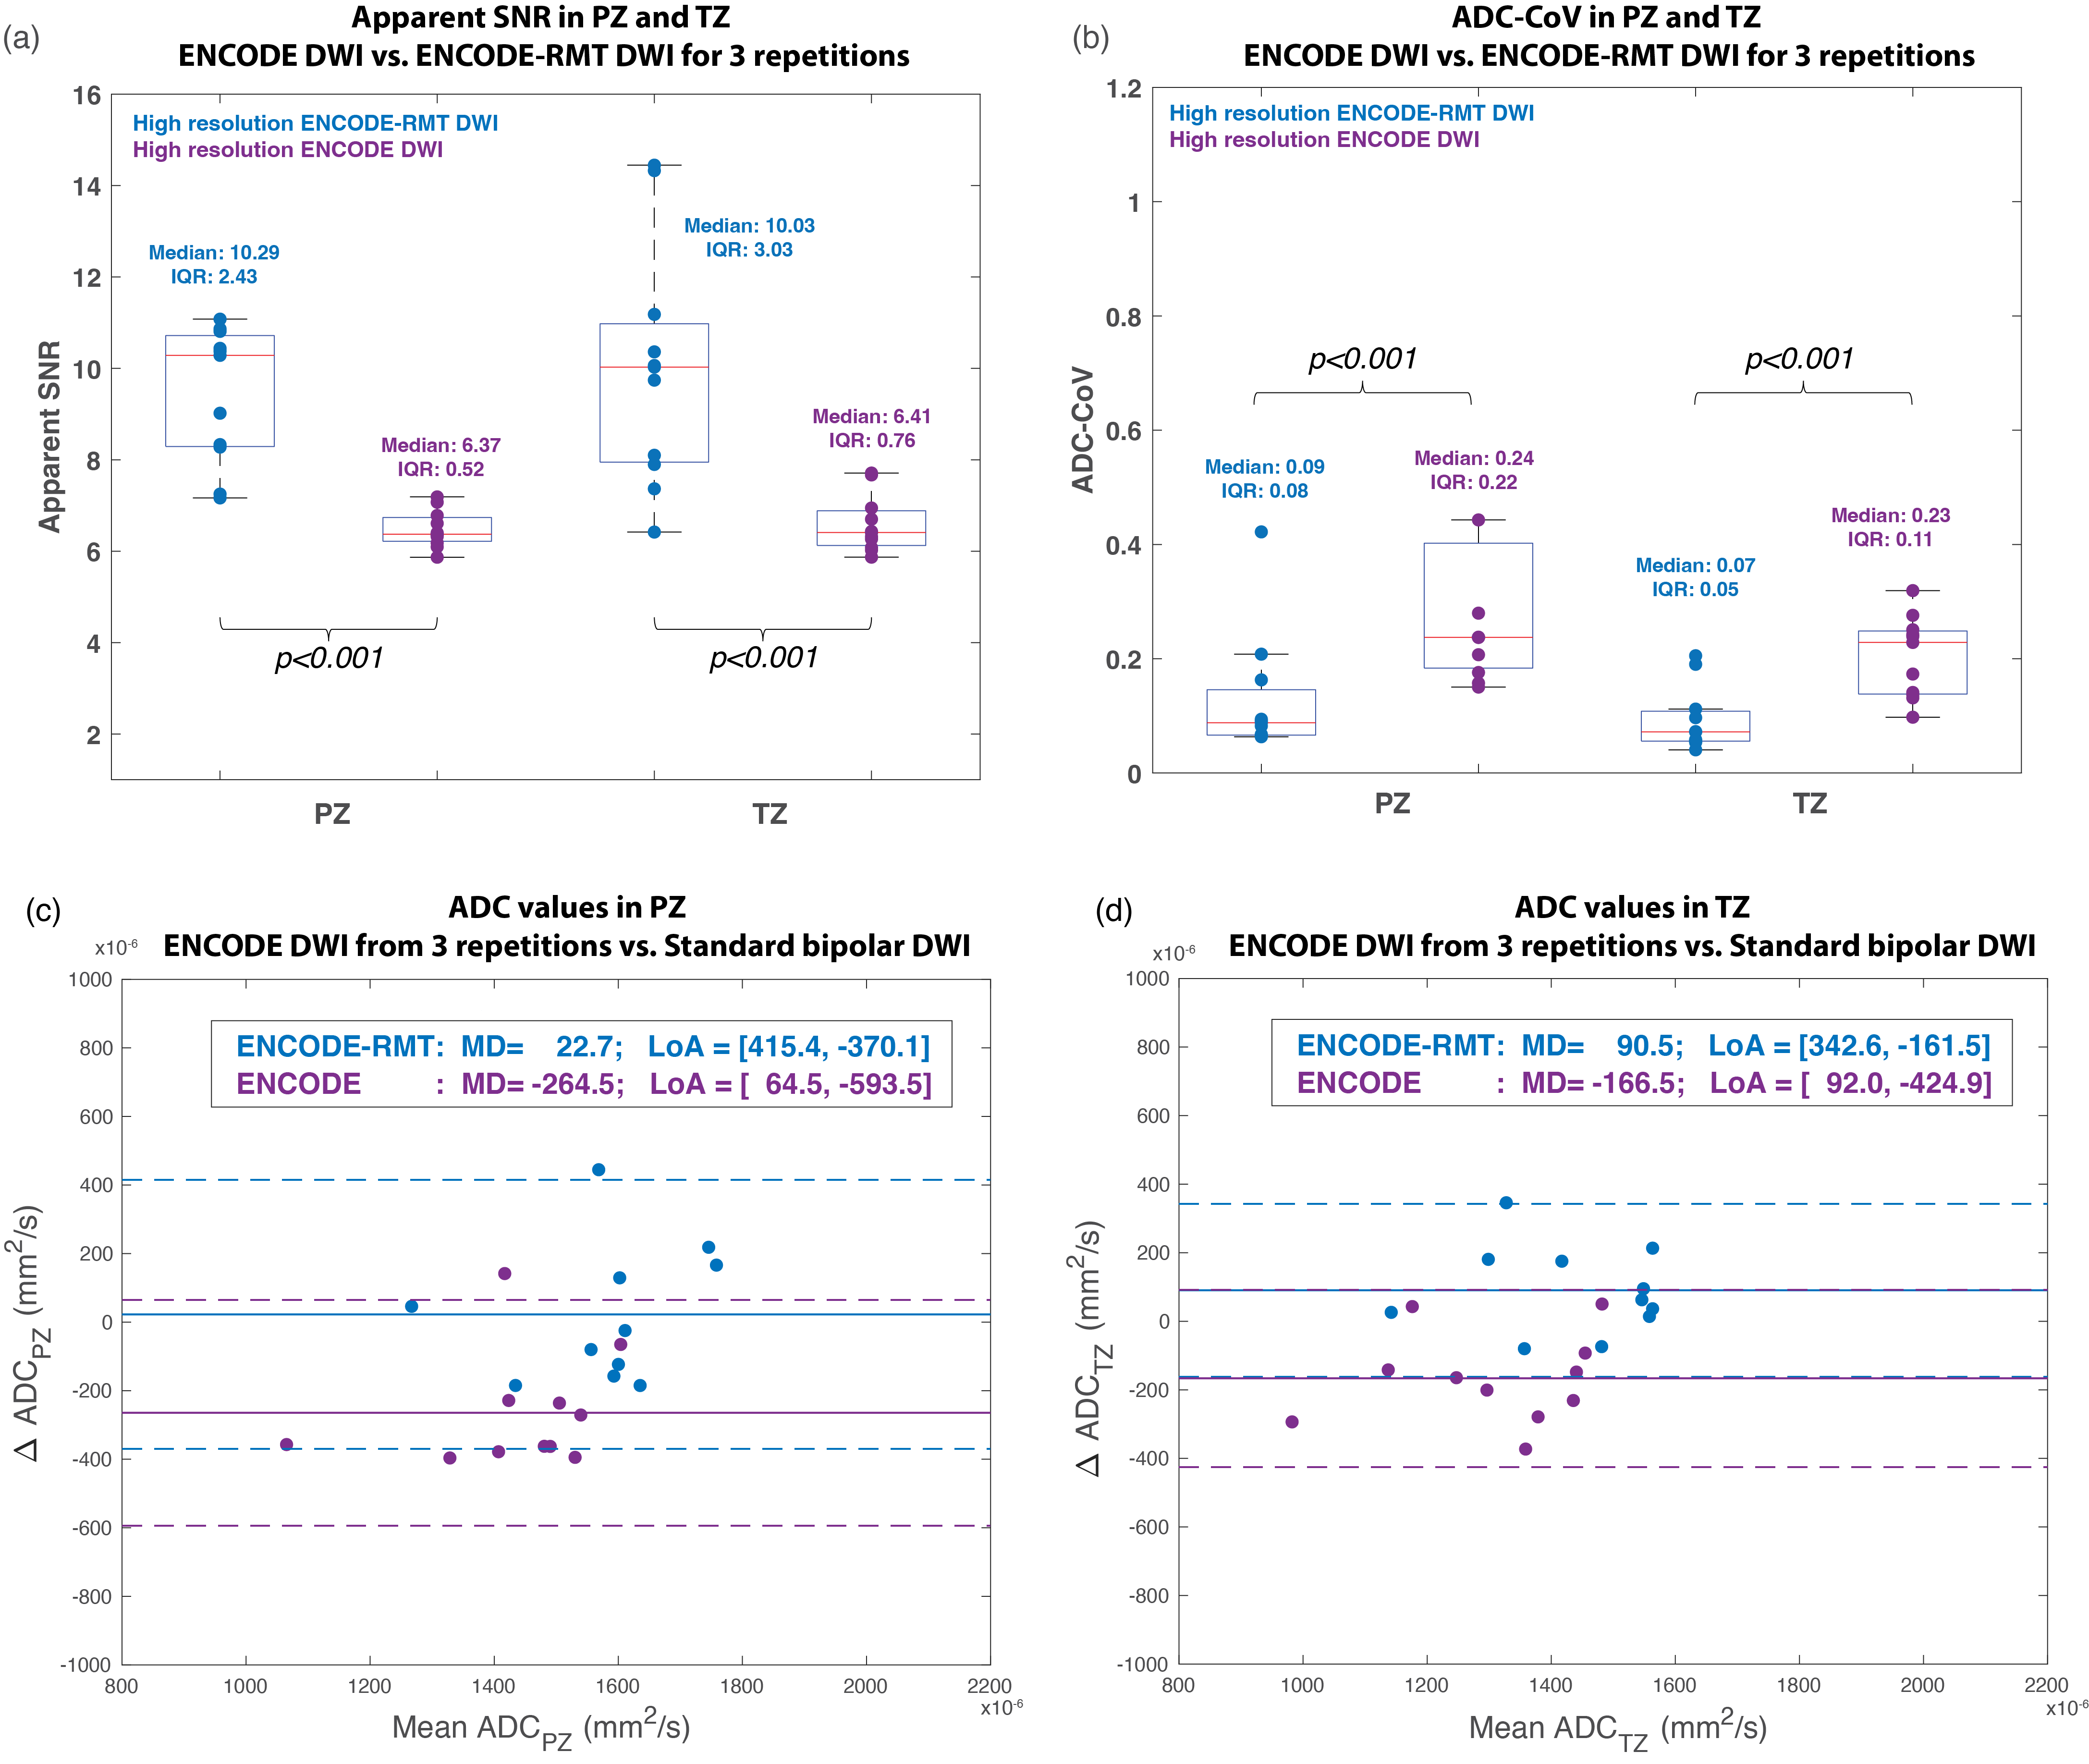
Figure 4. (a) Mean apparent SNR of b=800 s/mm2 and (b) Mean ADC-CoV for high-resolution (HR) ENCODE in the prostate peripheral zone (PZ) and transition zone (TZ) with and without RMT-denoising. (c,d) Bland-Altman plots of ADC values from ENCODE and ENCODE-RMT using 3 repetitions versus standard bipolar DWI (7 repetitions) in PZ and TZ. ENCODE showed a notable negative bias to standard bipolar DWI. After denoising, the noise in the larger b-value images was suppressed, and bias was markedly reduced. IQR: interquartile range. MD: mean difference. LoA: 95% limits of agreements.