0260
Accelerated 3D Metabolite T1 Mapping Using Variable-Flip-Angle FID MRSI1Beckman Institute for Advanced Science and Technology, University of Illinois at Urbana-Champaign, Urbana, IL, United States, 2Department of Electrical and Computer Engineering, University of Illinois at Urbana-Champaign, Urbana, IL, United States, 3Siemens Medical Solutions USA, Inc., Urbana, IL, United States, 4National Center for Supercomputing Applications, University of Illinois at Urbana-Champaign, Urbana, IL, United States, 5Department of Bioengineering, University of Illinois at Urbana-Champaign, Urbana, IL, United States, 6Gordon Center for Medical Imaging, Department of Radiology, Massachusetts General Hospital, Boston, MA, United States, 7Yale School of Medicine, New Haven, CT, United States, 8School of Biomedical Engineering, Shanghai Jiao Tong University, Shanghai, China
Synopsis
Keywords: Spectroscopy, Spectroscopy
Motivation: Metabolite T1 values are needed for T1 correction in short-TR MRSI data. Due to the prolonged scan time, metabolite T1 measurement has been limited to single-voxel or single-slice experiments so far.
Goal(s): To develop a novel method for 3D metabolite T1 mapping in a practically feasible scan time.
Approach: We used a variable-flip-angle short-TR MRSI to achieve rapid metabolite T1 mapping. The high-dimensional data space was undersampled in a variable-density manner. Associated data processing challenges were solved by generalized-series and low-rank-tensor modelling.
Results: Simulation, phantom and healthy subject results demonstrated the feasibility of accelerated 3D metabolite T1 mapping.
Impact: The proposed method enables 3D metabolite T1 mapping within a clinically feasible scan time (15 min). This method can be used to correct T1 weighting effects in accelerated short-TR MRSI experiments, producing more quantitative results.
Introduction
Metabolite signals measured in short-TR MRSI are often weighted by the T1 effects, which complicates their biological interpretation1-4. Therefore, metabolite T1 values are needed for T1 correction. However, measuring metabolite T1 values requires a series of T1-weighted spectroscopic signals, which adds another dimension to the imaging problem and exacerbates the challenge of achieving fast high-resolution imaging in MRSI experiments. As a result, current technologies for measuring metabolite T1 values have been limited to single-voxel1-6 or single-slice experiments7-9. Recently, we have demonstrated the feasibility of 3D metabolite T1 mapping by extending recent progress on accelerated FID MRSI, i.e., SPICE10-14, with variable-flip-angle excitations, but with a relatively long scan time (~34 minutes)15. In this work, we propose to reduce the scan time to ~15 minutes using variable-density undersampling of the high-dimensional data space. The proposed method was evaluated using simulation, phantom and in vivo data, producing high-quality and reproducible results.Methods
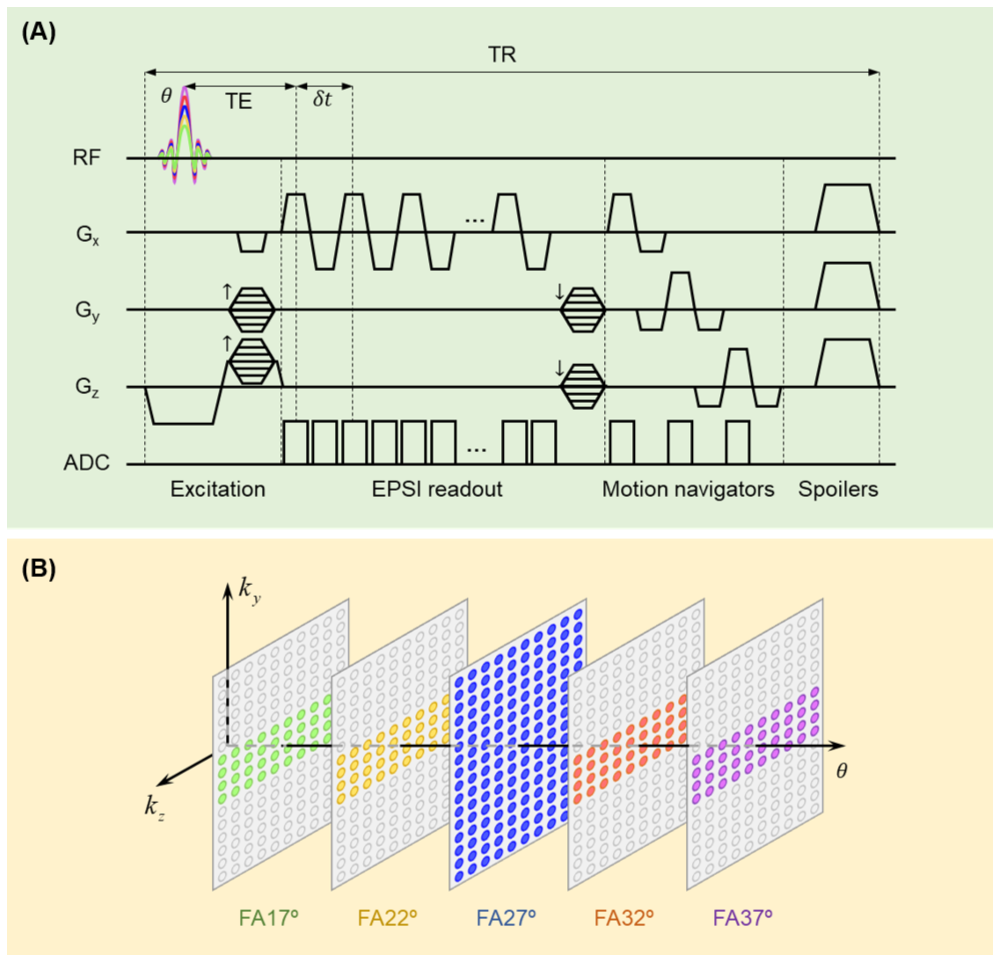
The proposed data acquisition scheme is illustrated in Figure 1A, which maintains the acquisition features of the basic SPICE10-14, including (a) short-TR (160 ms), ultrashort-TE (1.6 ms), FID MRSI, (b) elimination of water and lipid suppression pulses, and (c) extended EPSI readout. This basic SPICE sequence has been extended to variable-flip-angle excitations (17º/22º/27º/32º/37º) to encode metabolite T1 information. But densely sampling all flip angles will result in long scan time (~34 minutes)15. To accelerate data acquisition, we sample k-space in variable density, as shown in Figure 1B. For the Ernst-angle excitation with optimal SNR, k-space is sampled with extended coverage, while for other flip angles, only limited central k-space data are sampled. This sampling scheme provides an overall acceleration factor of 2.26, reducing total scan time to about 15 minutes.This data acquisition scheme poses two challenges in data processing: (a) removal of water and lipid signals from non-Ernst-angle MRSI data with very limited k-space coverage, and (b) reconstruction of variable-density MRSI images from limited and noisy data.
To solve the nuisance removal problem, we leveraged the high-resolution water and lipid signals obtained from the Ernst-angle excitation. More specifically, a generalized series (GS) model16,17 was used to incorporate the high-resolution reference data $$$\hat{\rho}_{\mathrm{L}}(\boldsymbol{x},t,\theta_{\mathrm{ref}})$$$ and $$$\hat{\rho}_{\mathrm{W}}(\boldsymbol{x},t,\theta_{\mathrm{ref}})$$$:
$$\rho_{\mathrm{L}}(\boldsymbol{x},t,\theta)=\sum_{n=-N_{\mathrm{L}}}^{N_{\mathrm{L}}}\alpha_{n}(t,\theta)\hat{\rho}_{\mathrm{L}}(\boldsymbol{x},t,\theta_{\mathrm{ref}})e^{-i2\pi{n}{\Delta}\boldsymbol{k}\cdot\boldsymbol{x}},\\\rho_{\mathrm{W}}(\boldsymbol{x},t,\theta)=\sum_{n=-N_{\mathrm{W}}}^{N_{\mathrm{W}}}\beta_{n}(\boldsymbol{x},\theta)\hat{\rho}_{\mathrm{W}}(\boldsymbol{x},t,\theta_{\mathrm{ref}})e^{-i2\pi{n}{\Delta}ft}.$$
We estimated the GS coefficients $$$\boldsymbol{\alpha}_{\mathrm{L}}(\theta)$$$ and $$$\boldsymbol{\beta}_{\mathrm{W}}(\theta)$$$ for lipid and water signals by solving the following least-squares problem:
$$\{\hat{\boldsymbol{\alpha}}_{\mathrm{L}}(\theta),\hat{\boldsymbol{\beta}}_{\mathrm{W}}(\theta)\}=\arg\min_{\{\boldsymbol{\alpha}_{\mathrm{L}}(\theta),\boldsymbol{\beta}_{\mathrm{W}}(\theta)\}}\left\|\boldsymbol{\mathrm{d}}(\theta)-\boldsymbol{\Omega}(\theta)\mathcal{F}\left(\boldsymbol{\mathrm{G}}_{\mathrm{L}}\boldsymbol{\alpha}_{\mathrm{L}}(\theta)+\boldsymbol{\mathrm{G}}_{\mathrm{W}}\boldsymbol{\beta}_{\mathrm{W}}(\theta)\right)\right\|_2^2,$$
where $$$\boldsymbol{\mathrm{d}}(\theta)$$$ is the data vector acquired with flip angle $$$\theta$$$, $$$\boldsymbol{\Omega}(\theta)$$$ the corresponding (k,t)-space sampling operator, $$$\mathcal{F}$$$ the Fourier operator, $$$\boldsymbol{\mathrm{G}}_{\mathrm{L}}$$$ and $$$\boldsymbol{\mathrm{G}}_{\mathrm{W}}$$$ the GS encoding operators for lipid and water signals. The estimated lipid and water signals, $$$\boldsymbol{\mathrm{G}}_{\mathrm{L}}\boldsymbol{\alpha}_{\mathrm{L}}(\theta)$$$ and $$$\boldsymbol{\mathrm{G}}_{\mathrm{W}}\boldsymbol{\beta}_{\mathrm{W}}(\theta)$$$, were then removed from the measured (k,t)-space data.
To solve the spatiospectral reconstruction problem, we exploited the correlation in spectral and T1-weighting dimensions using a low-rank-tensor model10,18-20. The spectral and T1-weighting subspaces $$$\hat{\boldsymbol{\mathrm{v}}}_{m,q}$$$ and $$$\hat{\boldsymbol{\mathrm{w}}}_{m,r}$$$ were pre-learned from physics prior information and training data15. The core tensor $$$t_{m,p,q,r}$$$ and spatial coefficients $$$\boldsymbol{\mathrm{u}}_{m,p}$$$ were estimated by solving the following optimization problem:
$$\min_{t_{m,p,q,r}}\left\|\boldsymbol{\mathrm{d}}_{\mathrm{r}}-\boldsymbol{\Omega}\mathcal{F}\left(\sum_{m=1}^{M}\left(\sum_{p=1}^{P_m}\sum_{q=1}^{Q_m}\sum_{r=1}^{R_m}t_{m,p,q,r}{\cdot}\boldsymbol{\mathrm{u}}_{m,p}{\circ}\hat{\boldsymbol{\mathrm{v}}}_{m,q}{\circ}\hat{\boldsymbol{\mathrm{w}}}_{m,r}\right)\right)\right\|_2^2+\lambda\sum_{m=1}^{M}\sum_{p=1}^{P_m}\left\|\boldsymbol{\mathrm{W}}\boldsymbol{\mathrm{u}}_{m,p}\right\|_2^2,$$
where $$$\boldsymbol{\mathrm{d}}_{\mathrm{r}}$$$ is the vector representing nuisance-removed $$$(\boldsymbol{k},t,\theta)$$$-space data, $$$\boldsymbol{\Omega}$$$ the sampling operator in $$$(\boldsymbol{k},t,\theta)$$$-space, and $$$\boldsymbol{\mathrm{W}}$$$ the edge-preserving spatial regularization matrix21. After reconstruction, T1 values were fitted from the reconstructed metabolite maps. B1 maps were estimated from the unsuppressed water signals22 and used in the correction of metabolite maps.
Results
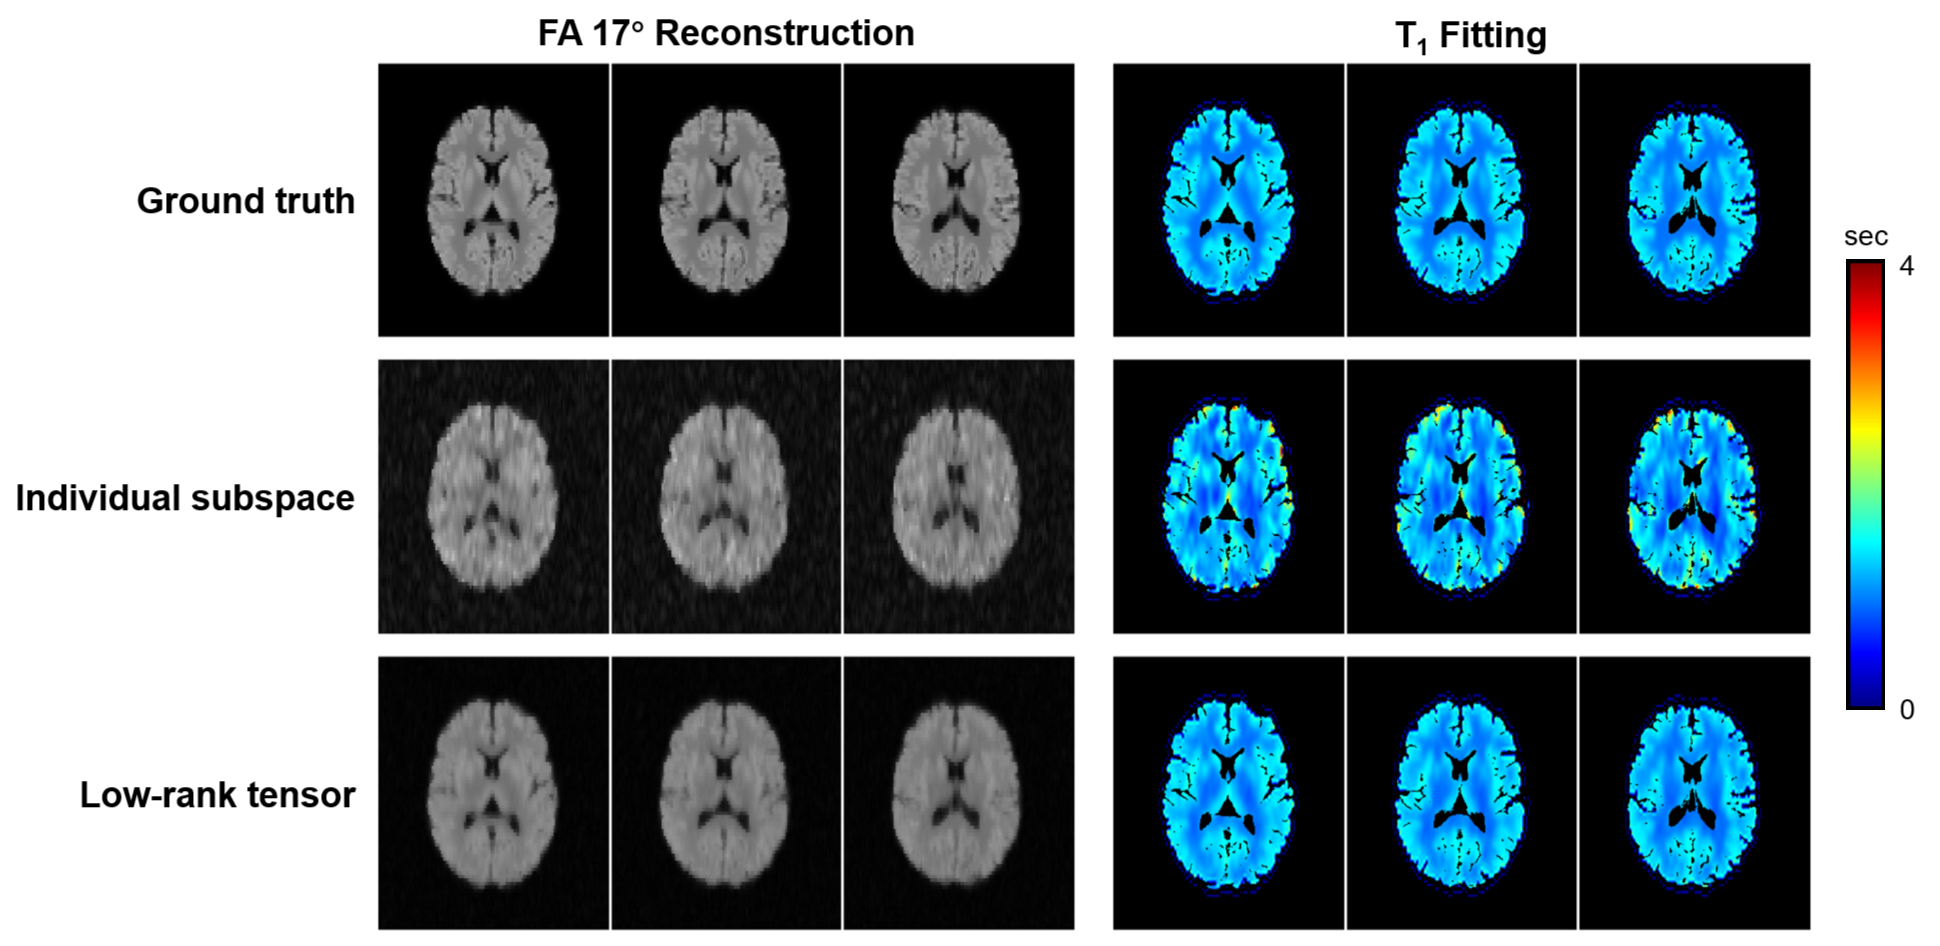
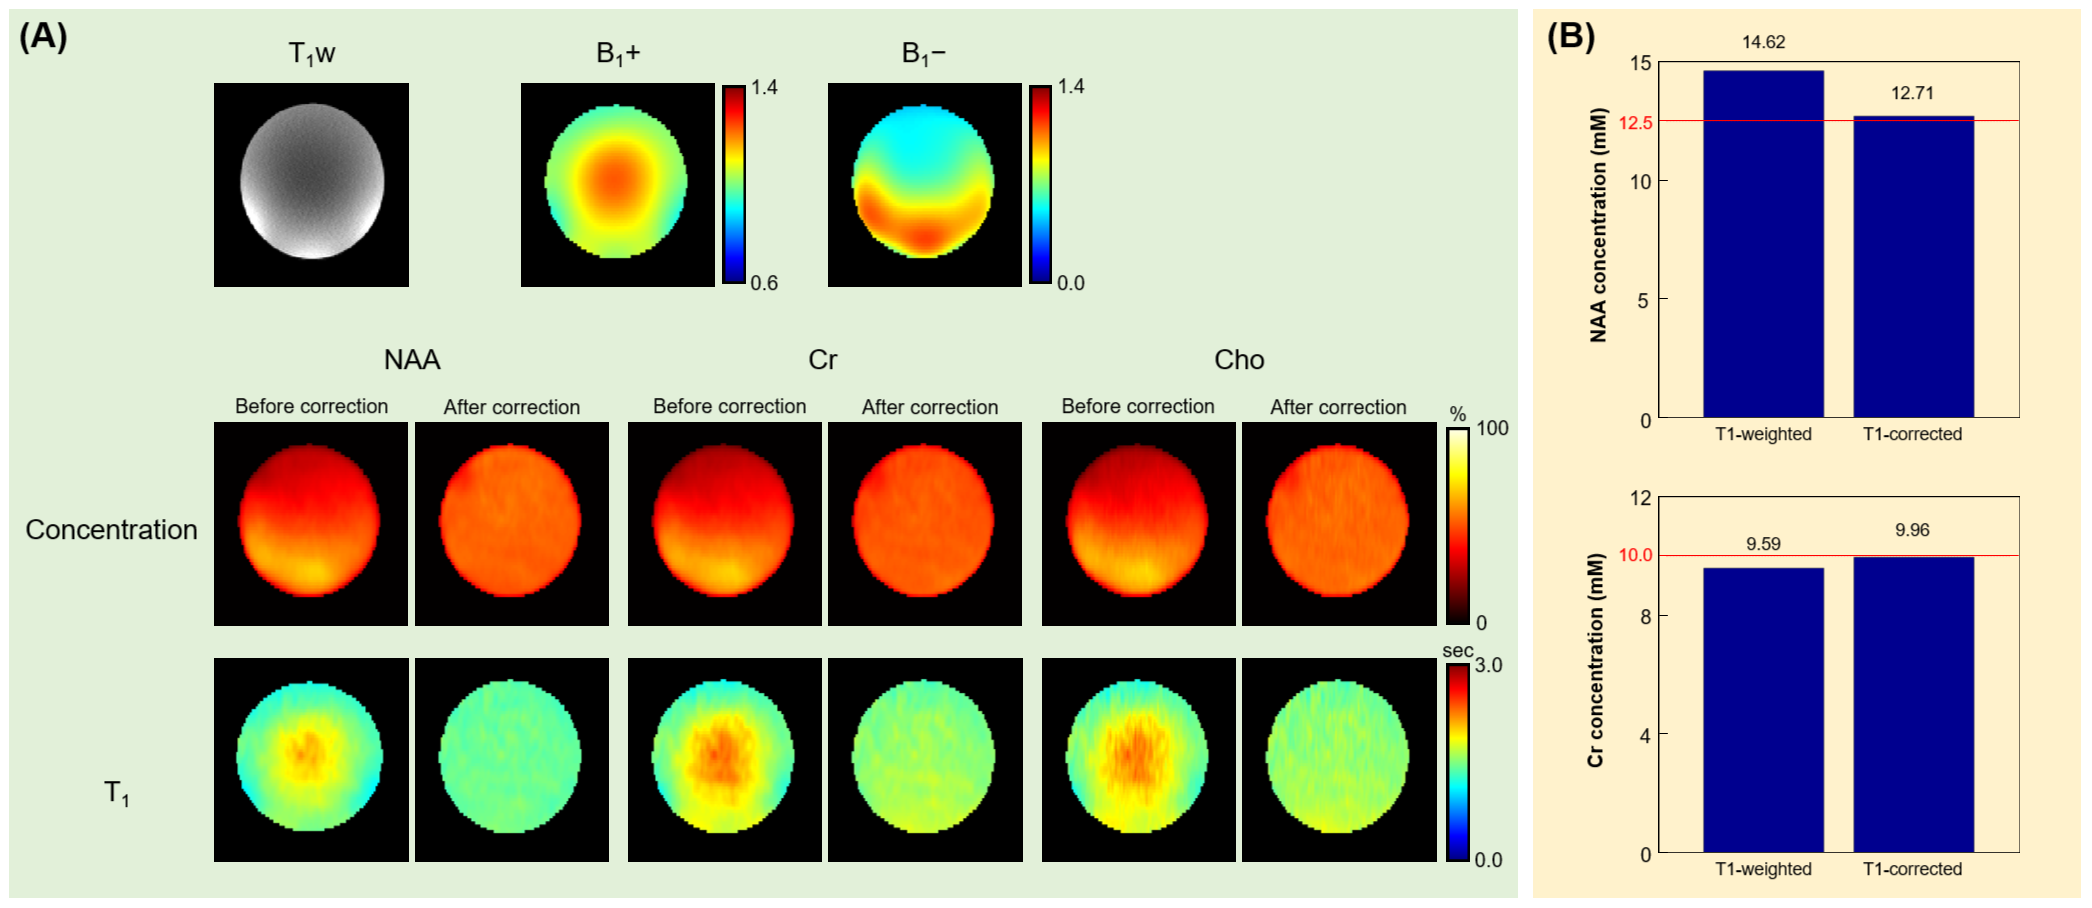
Figure 2 shows the simulation results. Ground truth variable-flip-angle MRSI data were generated based on experimental water concentration and T1 maps. k-Space data in the proposed variable-density pattern were sampled with additive Gaussian noise (matching metabolite practical SNR). Concentration and T1 maps were reconstructed using individual-subspace model and low-rank-tensor model, in comparison with the ground truth. The proposed low-rank-tensor model produced high-quality results.Figure 3 shows the results obtained from a uniform SPECTRE MRS phantom using a 3T scanner (MAGNETOM Prisma, Siemens Healthcare, Erlangen, Germany). The proposed method produced uniform concentration and T1 maps. The correction of T1-weighting effects led to a better agreement with the ground truth concentration.
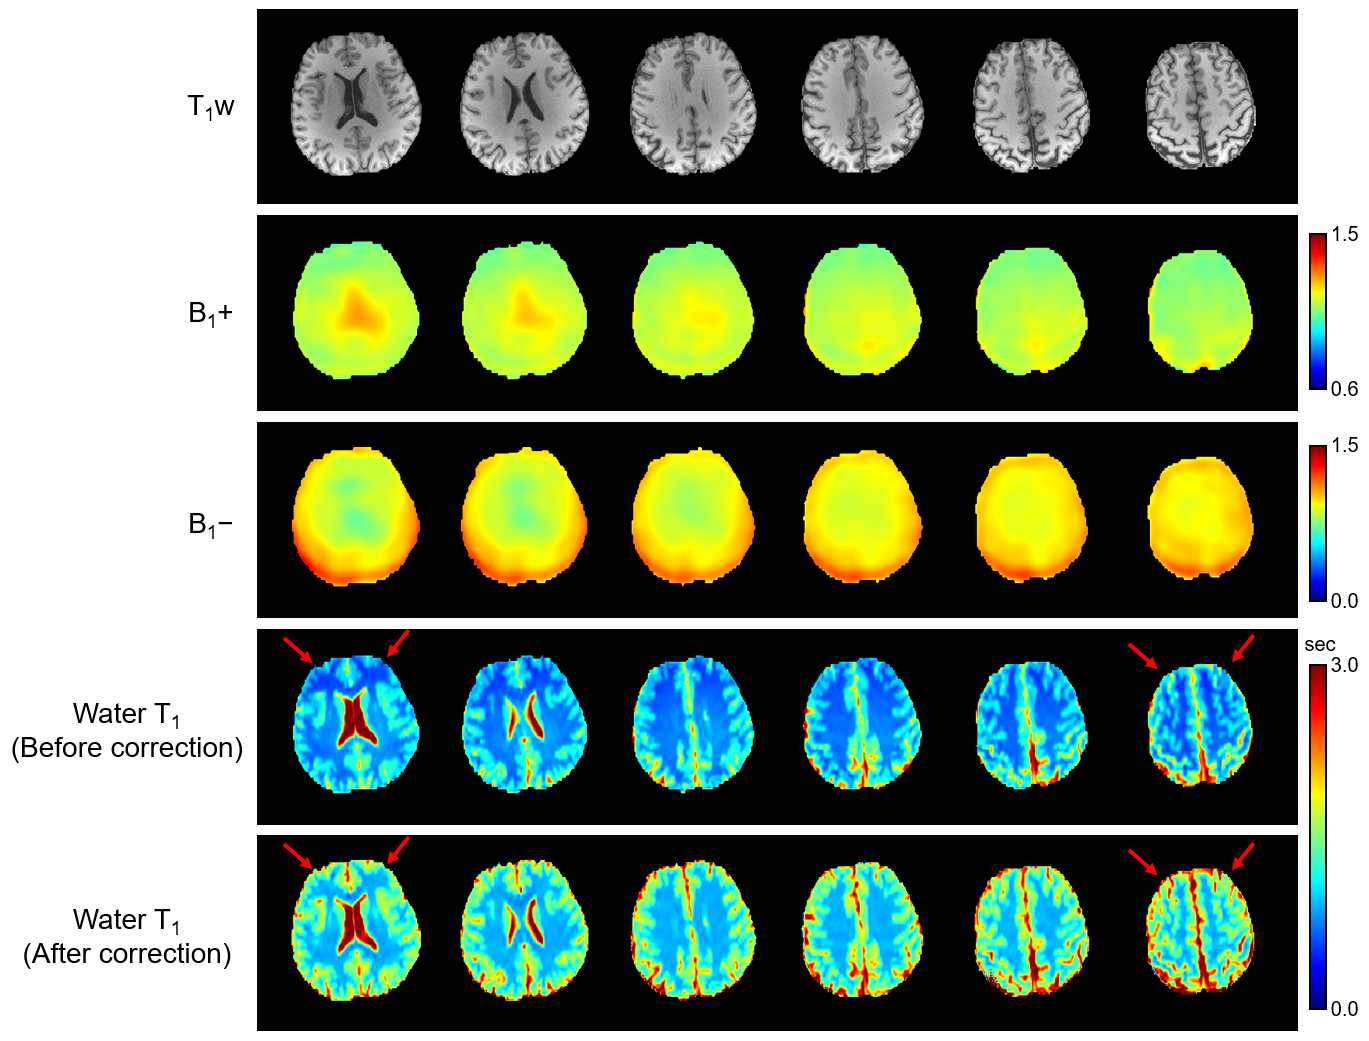
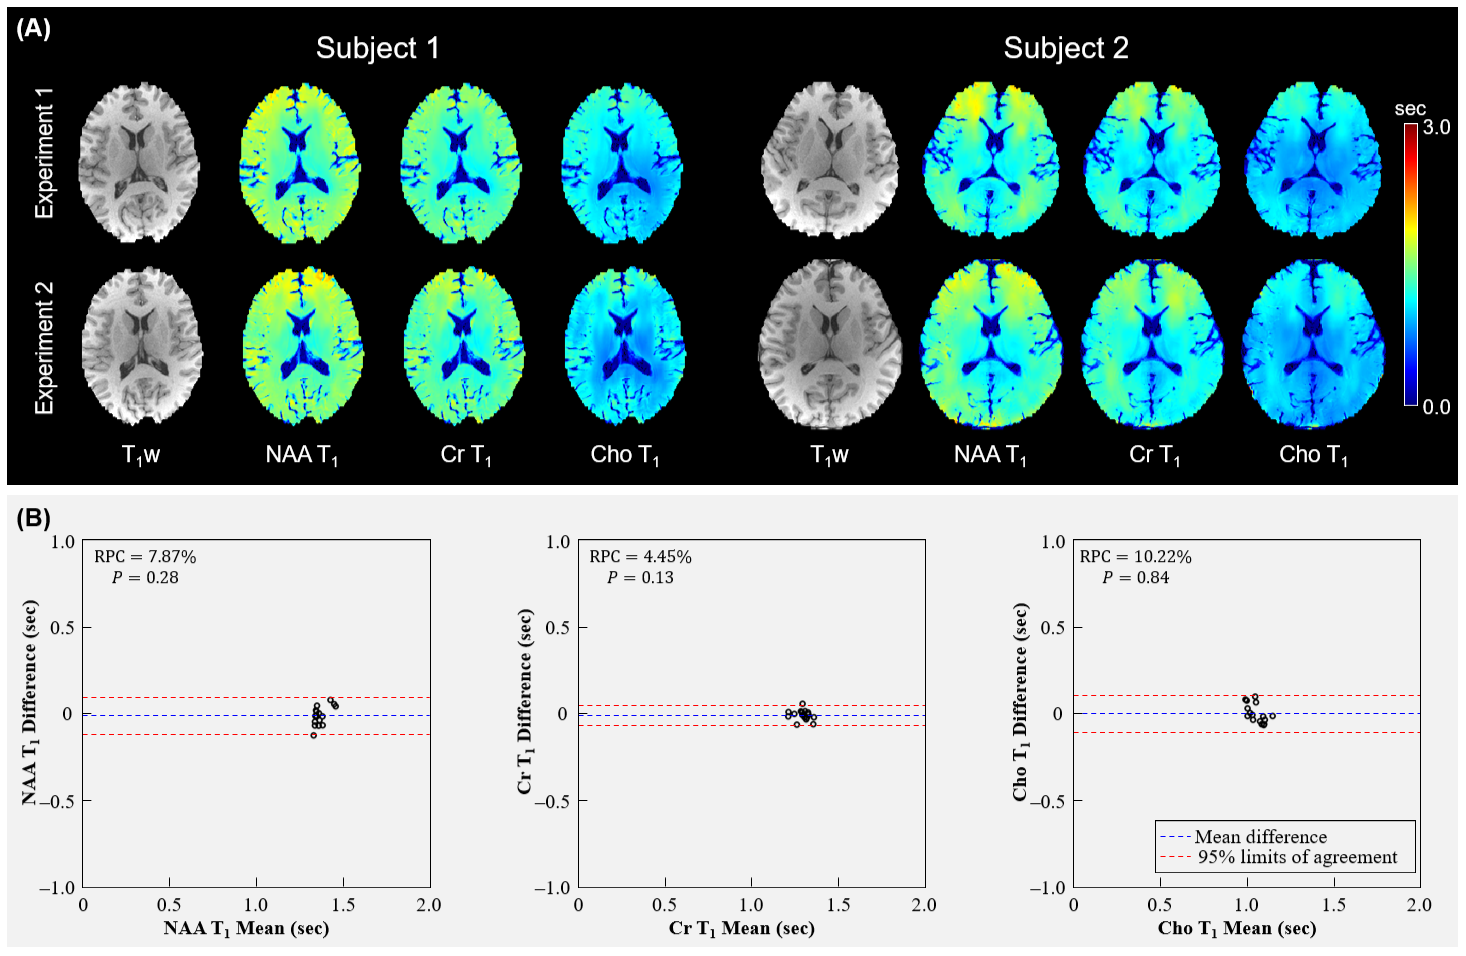
Figures 4 and 5 show the water and metabolite results obtained from healthy subjects. Figure 4 demonstrates the high-quality B1+ and B1− maps derived from unsuppressed water signals, which were successfully used to correct water T1 maps. Figure 5 presents the metabolite T1 maps obtained in a test-retest reproducibility experiment. Both subjects yielded high-quality and consistent metabolite T1 maps. Bland-Altman reproducibility analysis of metabolite T1 values in eight regions (gray/white matter regions from frontal/parietal/temporal/occipital lobes) found no significant bias between two repetitions (P>0.1).
Conclusions
We proposed a novel method for accelerated 3D metabolite T1 mapping. The new method was validated with simulation and phantom data, and produced high-quality metabolite T1 maps in healthy subjects.Acknowledgements
This work is supported in part by NIH: P41EB022544 and R01EB033582.References
1. Mlynrik V, Gruber S, Moser E. Proton T1 and T2 relaxation times of human brain metabolites at 3 Tesla. NMR in Biomedicine. 2001;14(5): 325–331.
2. Li Y, Xu D, Ozturk-Isik E, et al. T1 and T2 metabolite relaxation times in normal brain at 3T and 7T. J Mol Imaging Dynam S. 2012;2(2): 1–5.
3. An L, Li S, Shen J. Simultaneous determination of metabolite concentrations, T1 and T2 relaxation times. Magn Reson Med. 2017;78(6): 2072–2081.
4. An L, Araneta MF, Victorino M, Shen J. Determination of brain metabolite T1 without interference from macromolecule relaxation. J Magn Reson. 2020;52(5): 1352–1359.
5. Li Y, Srinivasan R, Ratiney H, Lu Y, Chang SM, Nelson SJ. Comparison of T1 and T2 metabolite relaxation times in glioma and normal brain at 3T. J Magn Reson Imaging. 2008;28(2): 342–350.
6. Brief EE, Vavasour IM, Laule C, Li DKB, Mackay AL. Proton MRS of large multiple sclerosis lesions reveals subtle changes in metabolite T1 and area. NMR in Biomedicine. 2010;23(9): 1033–1037.
7. Ratiney H, Noworolski SM, Sdika M, et al. Estimation of metabolite T1 relaxation times using tissue specific analysis, signal averaging and bootstrapping from magnetic resonance spectroscopic imaging data. MAGMA Magn Reson Mater Phys, Biol Med, 2007;20(3): 143–155.
8. Klauser A, Grouiller F, Courvoisier S, Lazeyras F. High-resolution T1 maps of brain metabolites. Annual Meeting of International Society for Magnetic Resonance in Medicine. 2019: 2488.
9. Ma C, Han PK, Fakhri GE. Simultaneous mapping of metabolite concentration and T1 relaxation time using subspace imaging accelerated inversion recovery MRSI. Annual Meeting of International Society for Magnetic Resonance in Medicine. 2021: 3050.
10. Liang Z-P. Spatiotemporal imaging with partially separable functions. IEEE ISBI. 2007;988–991.
11. Lam F, Liang Z-P. A subspace approach to high-resolution spectroscopic imaging. Magn Reson Med. 2014;71(4):1349–1357.
12. Lam F, Ma C, Clifford B, Johnson CL, Liang Z-P. High-resolution 1H-MRSI of the brain using SPICE: Data acquisition and image reconstruction. Magn Reson Med. 2016;76(4):1059–1070.
13. Ma C, Lam F, Ning Q, Johnson CL, Liang Z-P. High‐resolution 1H‐MRSI of the brain using short‐TE SPICE. Magn Reson Med. 2017;77(2):467–479.
14. Lam F, Li Y, Guo R, Clifford B, Liang Z-P. Ultrafast magnetic resonance spectroscopic imaging using SPICE with learned subspaces. Magn Reson Med. 2020;83(2): 377–390.
15. Zhao Y, Guo R, Li Y, Jin W, Li Y, Luo J, Liang Z-P. 3D high-resolution T1 mapping of brain metabolites. In Proceedings of the Annual Meeting of ISMRM, pp. 3693, 2023.
16. Liang Z-P, Lauterbur PC. A generalized series approach to MR spectroscopic imaging. IEEE Trans Med Imaging. 1991;10(2):132-137.
17. Hess CP, Liang Z-P, Lauterbur PC. Maximum cross-entropy generalized series reconstruction. Int J Imaging Syst Technol. 1999;10(3):258-265.
18. He J, Liu Q, Christodoulou AG, Ma C, Lam F, and Liang Z-P. Accelerated high-dimensional MR imaging with sparse sampling using low-rank tensors. IEEE TMI, 2016;35(9): 2119–2129.
19. Ma C, Clifford B, Liu Y, Gu Y, Lam F, Yu X, Liang Z-P. High‐resolution dynamic 31P‐MRSI using a low‐rank tensor model. Magn Reson Med, 2017;78(2): 419–428.
20. Christodoulou AG, Shaw JL, Nguyen C, et al. Magnetic resonance multitasking for motion-resolved quantitative cardiovascular imaging. Nat Biomed Eng. 2018;2(4): 215–226.
21. Haldar JP, Hernando D, Song SK, Liang Z-P. Anatomically constrained reconstruction from noisy data. Magn Reson Med. 2008;59(4): 810–818.
22. Wang Y, Chen Y, Wu D, et al. STrategically Acquired Gradient Echo (STAGE) imaging, part II: Correcting for RF inhomogeneities in estimating T1 and proton density. Magn Reson Imaging. 2018;46: 140–150.
Figures