0258
In Vivo Detection of Lactate and its T2 in the Resting Human Brain by Transverse Relaxation Encoding with Narrowband Decoupling
Li An1, Maria Ferraris Araneta1, Tara Turon1, Christopher S Johnson1, Sungtak Hong1, John A Derbyshire1, and Jun Shen1
1National Institute of Mental Health, National Institutes of Health, Bethesda, MD, United States
1National Institute of Mental Health, National Institutes of Health, Bethesda, MD, United States
Synopsis
Keywords: Spectroscopy, Spectroscopy, MRS; lactate; glutamate
Motivation: The published T2 relaxation times in healthy brains are highly inconsistent.
Goal(s): To reliably measure T2 relaxation times of lactate and glutamate.
Approach: A new editing pulse was crafted and incorporated into the TREND technique for simultaneous homonuclear decoupling of lactate and glutamate at 7 Tesla.
Results: The concentrations and T2 relaxation times of lactate and glutamate were measured in vivo with low CVs and CRLBs.
Impact: As lactate and glutamate are the markers of glycolysis and oxidative metabolism, respectively, this technique can be used for clinical MRS studies of the biophysical aspects of cerebral metabolic alterations or abnormalities.
INTRODUCTION
A 2D MRS technique, Transverse Relaxation Encoding with Narrowband Decoupling (TREND) was recently introduced 1, for in vivo measurement of metabolite concentrations and T2 relaxation times with increased spectral resolution, minimized background signals, and markedly expanded dynamic range for transverse relaxation encoding. Here, we design a new multiband editing pulse for TREND to achieve homonuclear decoupling of lactate (Lac) and determine Lac T2 in the resting brains of healthy individuals in vivo. This modified TREND technique enables simultaneous characterization of the T2 values of both the oxidative metabolism marker glutamate (Glu) and the glycolysis marker Lac.METHODS
The new TREND editing pulse was crafted using a superposition of eight symmetrically truncated Gaussians with the same duration. Each Gaussian was defined by four parameters: target chemical shift, amplitude, phase, and width. These parameters were optimized using numerical calculations of the frequency response of the superimposed pulse based on the Bloch equations for each trial set of input parameters 2,3. The numerically optimized editing pulse was then used in a modified TREND pulse sequence to scan three healthy participants.RESULTS
As shown in Figure 1, a new frequency band was generated to invert the Lac H2 spin at 4.10 ppm. The frequency response of this new editing pulse between 4.2 and 4.6 ppm maintained a similar saturation effect as the original 90o band 1 on the aspartyl CH proton of NAA at 4.38 ppm, effectively suppressing the aspartyl CH2 resonances between 2.4 and 2.6 ppm, which overlap with the glutamine (Gln) and glutamyl glutathione (GSH) H4 resonances in the TREND spectra 1. The enlarged inversion region between 1.98 and 2.15 ppm of this multiband pulse also improved the inversion of the Glu H3 spin at 2.05 ppm4.Numerically simulated bin spectra for both the original and modified TREND sequences showed that the Lac doublet peak at 1.31 ppm (Figure 2a) became a distinct singlet (Figure 2b) due to the homonuclear decoupling effect of the new editing pulse. Compared to the original TREND, the modified TREND enhanced the Glu H4 peak amplitude for bins 0 – 3 by 47%, 66%, 80%, and 102%, respectively.
In vivo bin spectra and their fits acquired from a healthy participant are shown in Figure 3. The Glu H4 peak is prominent in most of the bin spectra. In bins 1 – 4, the Lac H3 peak at 1.31 ppm is clearly distinguishable. The data points in the linear regression plot of ln(concbin) on TEbin for Lac in Figure 4 show high linearity. As shown in Table 1, the low Cramer-Rao lower bounds (CRLB) and within-subject coefficients of variation (CV) for Lac concentration and T2 indicate that this modified TREND technique is a viable tool for clinical studies involving cerebral glycolysis.
DISCUSSION
The detection of Lac in the brains of healthy individuals, whether under resting conditions or functional stimulation, has been controversial, with some authors suggesting that the reported signal at 1.31 ppm originates from scalp lipids 5. The reported Lac T2 spans over 94 to1200 ms 6,7. In this study, an editing pulse with eight bands was numerically optimized to extend the scope of TREND, enabling the inversion of Lac H2 at 4.10 ppm and achieving homonuclear decoupling of Lac H3, while also improving the detection of Glu H4. As the detection of Lac at short TEs is hampered by the low Lac concentration and the presence of prominent macromolecules and possibly extracranial subcutaneous lipids, the modified TREND offers several advantages for the unequivocal detection of the Lac H3 signal at 1.31 ppm: (i) the use of long TEs allows for the complete T2 decay of signals from macromolecules and scalp lipids in the majority of TREND spectra; (ii) homonuclear decoupling of the Lac H3 doublet markedly increases its signal intensity and spectral resolution; (iii) the amplitude and shape of the Lac H3 peak across different bins are well-modeled by numerical simulation, enhancing the overall reliability of the extracted Lac concentration. Furthermore, we demonstrated reliable in vivo measurement of Lac T2 using TREND for investigating the biophysical basis of glycolysis under normal and pathological conditions.CONCLUSION
A modified TREND sequence has been developed for Lac detection while improving Glu detection. Using this pulse sequence, the concentrations and T2s of Lac, Glu, Gln, GSH, tCr, and tCho were simultaneously measured in vivo. As Lac and Glu are the markers of glycolysis and oxidative metabolism, respectively, this technique can be used for clinical MRS studies of the biophysical aspects of both aerobic and anaerobic metabolic alterations or abnormalities.Acknowledgements
No acknowledgement found.References
- An, L. & Shen, J. In vivo magnetic resonance spectroscopy by transverse relaxation encoding with narrowband decoupling. Sci Rep 13, 12211 (2023). https://www.nature.com/articles/s41598-023-39375-0.
- Murdoch, J.B., Lent, A.H. & Kritzer, M.R. Computer-Optimized Narrow-Band Pulses for Multislice Imaging. Journal of Magnetic Resonance 74, 226-263 (1987).
- Emsley, L. & Bodenhausen, G. Gaussian Pulse Cascades - New Analytical Functions for Rectangular Selective Inversion and in-Phase Excitation in Nmr. Chem Phys Lett 165, 469-476 (1990).
- de Graaf, R.A. in vivo NMR Spectroscopy: Principles and Techniques, Edn. 3. (John Wiley & Sons Ltd, West Sussex, England; 2018).
- Boucard, C.C. et al. Visual stimulation, 1H MR spectroscopy and fMRI of the human visual pathways. Eur Radiol 15, 47-52 (2005).
- Dehghani, M., Do, K.Q., Magistretti, P. & Xin, L. Lactate measurement by neurochemical profiling in the dorsolateral prefrontal cortex at 7T: accuracy, precision, and relaxation times. Magn Reson Med 83, 1895-1908 (2020).
- Frahm, J. et al. Localized proton NMR spectroscopy in different regions of the human brain in vivo. Relaxation times and concentrations of cerebral metabolites. Magn Reson Med 11, 47-63 (1989).
Figures
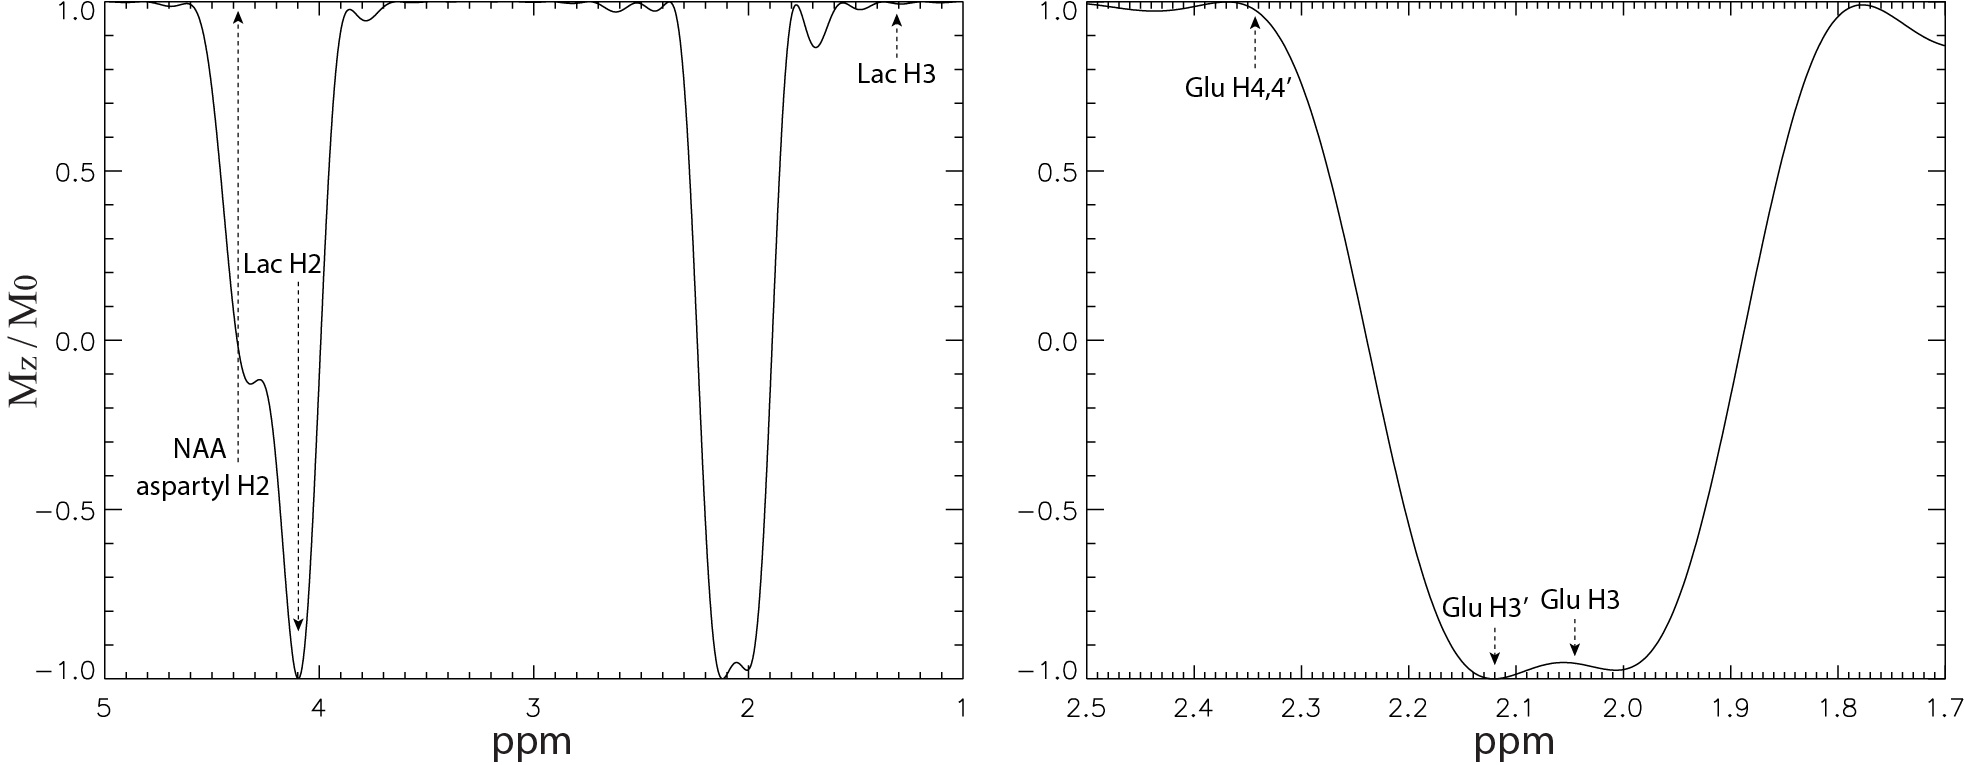
Figure 1 Frequency response of the
editing pulse used in the modified TREND pulse sequence. The plot on the left
covers the chemical shift range of 1.0 – 5.0 ppm, while the plot on the right
provides an expanded view of the 1.7 – 2.5 ppm range. The duration of the
editing pulse was 19 ms.
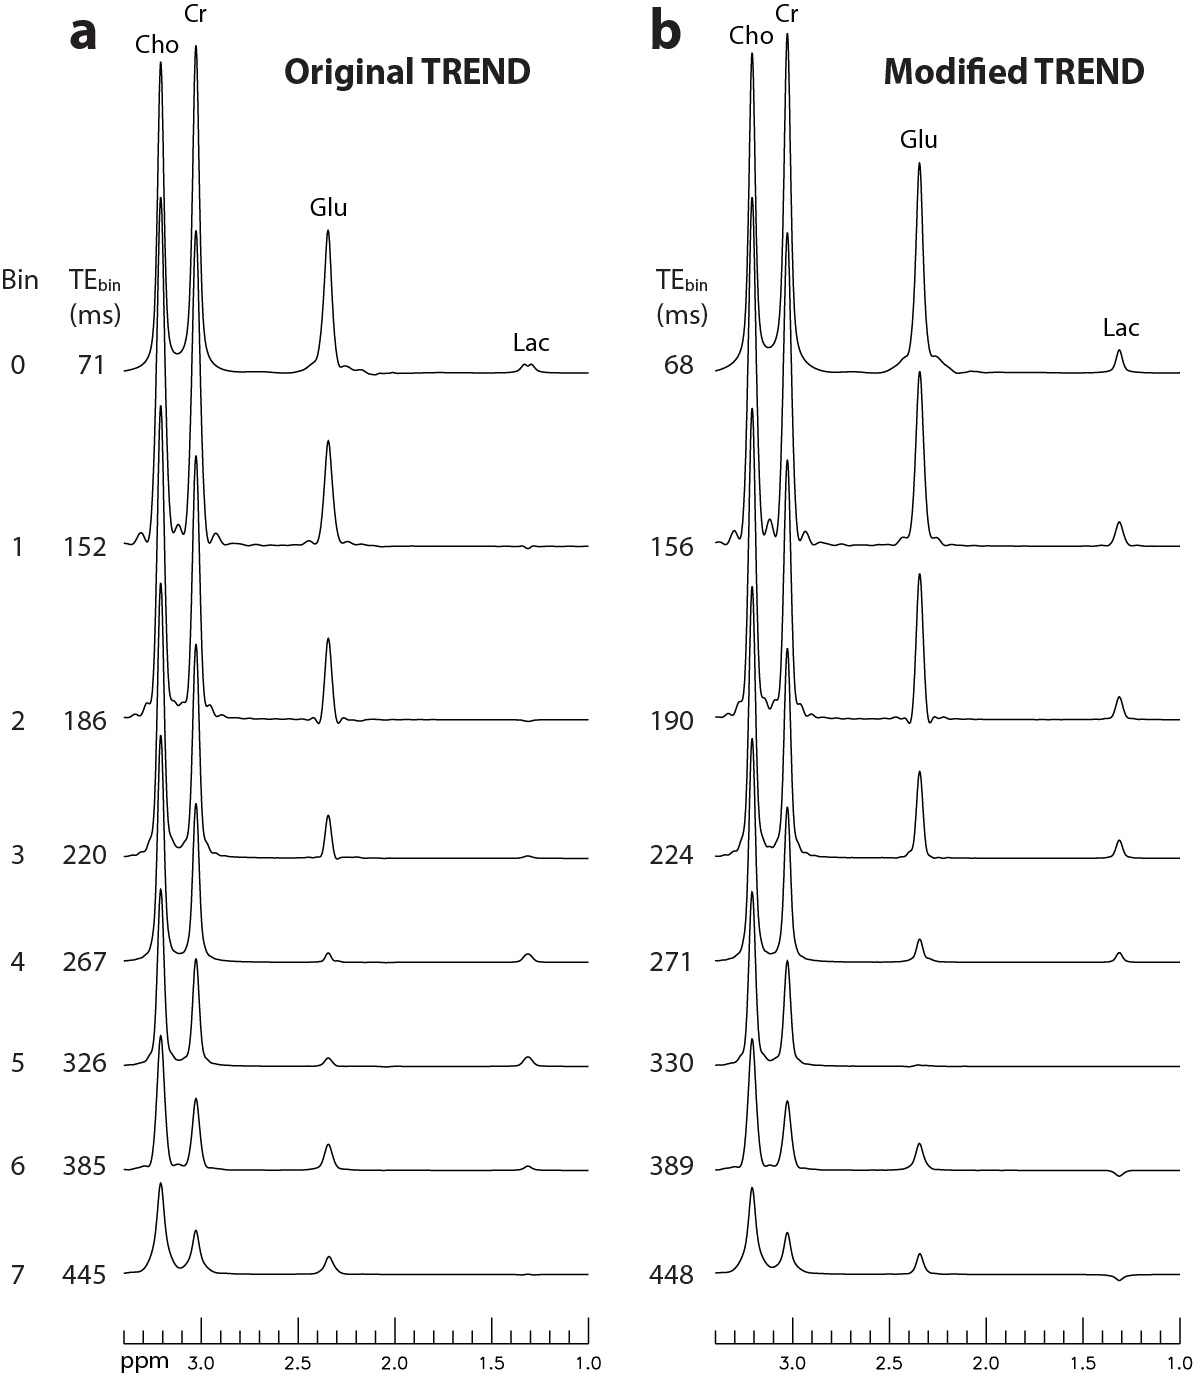
Figure 2 Numerically
calculated bin spectra for the sum of Lac, Glu, creatine (Cr), and choline
(Cho) with relative concentrations of 0.06, 1.1, 1.0, and 0.25, respectively,
and T2s of 170 ms, 170 ms, 120 ms, and 170 ms, respectively, using the original
(a) and the modified (b) TREND pulse sequences. Eight bin spectra
were reconstructed for both the original and modified TREND pulse sequences,
with each bin containing 100, 85, 85, 85, 148, 148, 148, and 148 columns,
respectively.
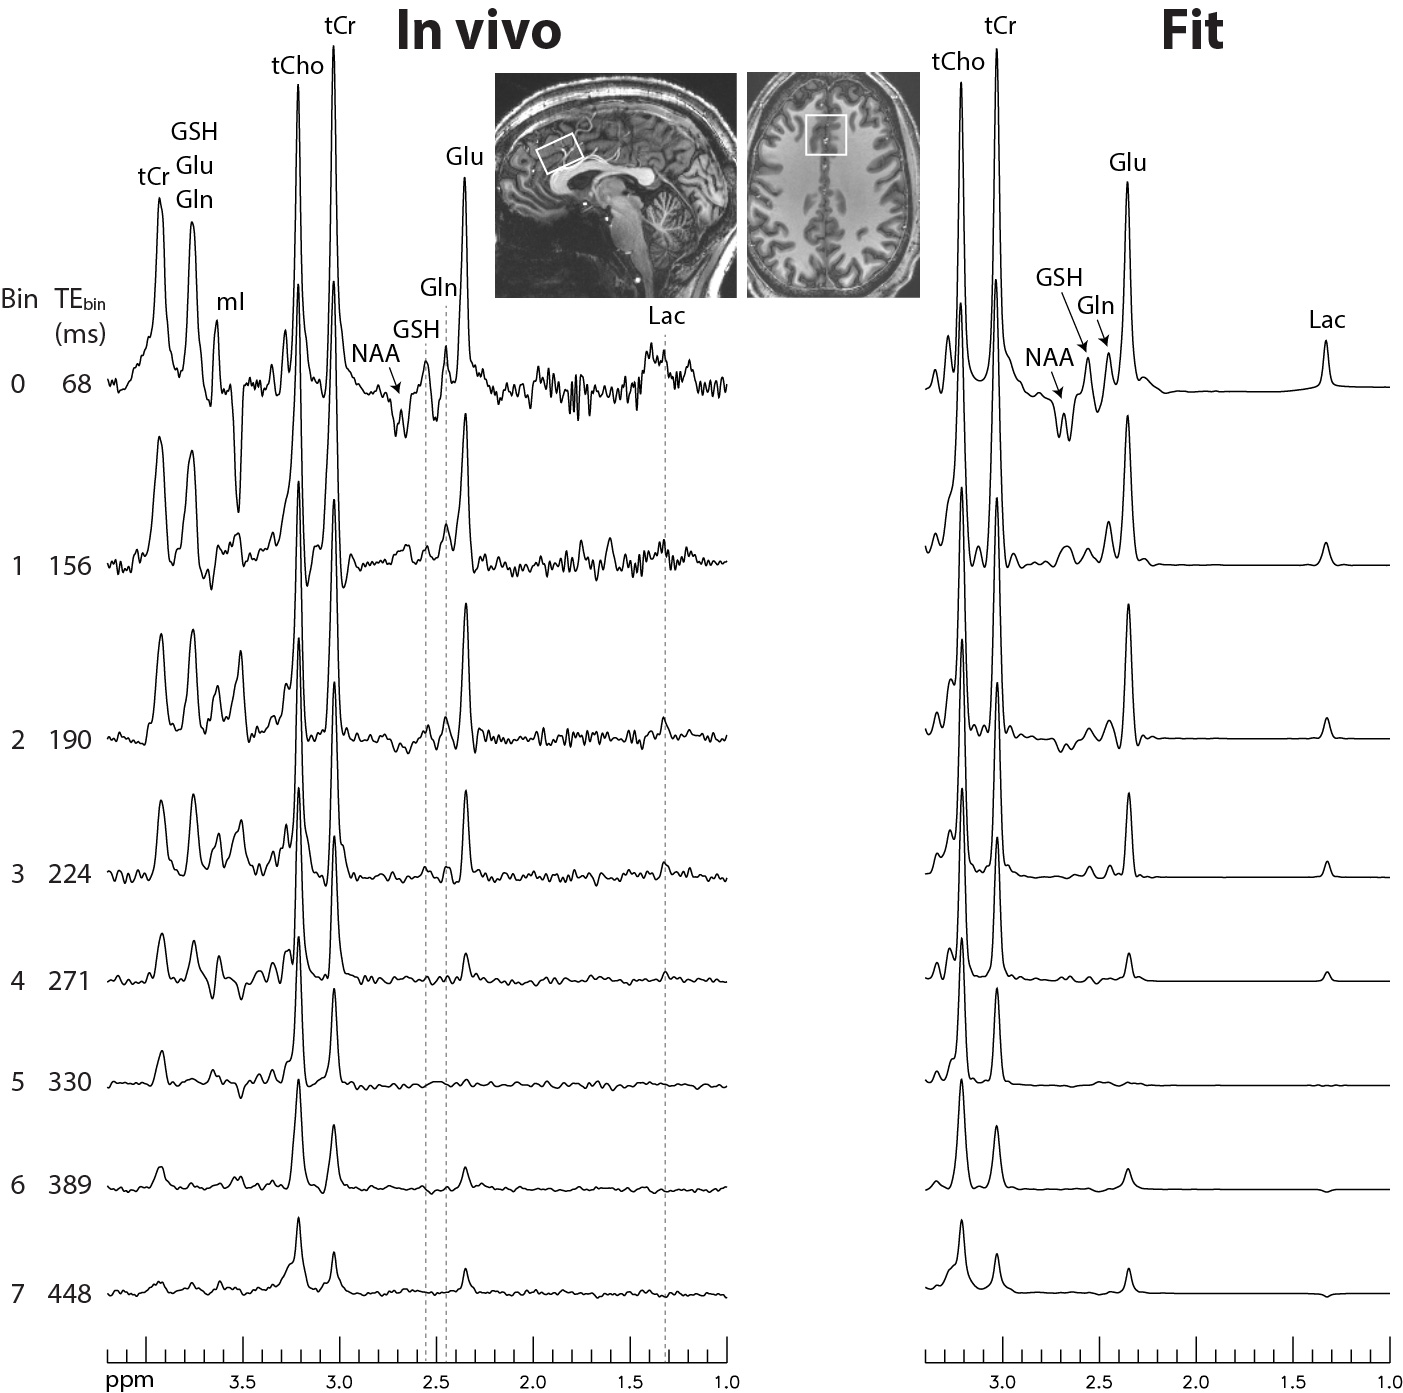
Figure 3 In vivo bin spectra (0 - 7) and their fits acquired from a 2 ×
3.5 × 2 cm3 voxel in
the anterior cingulate cortex (ACC) of a healthy participant using the modified
TREND pulse sequence. The following sequence
parameter values were used: τ1 = 16.5 ms; τ2 = τ2,0 + mΔτ2, where τ2,0 = 16.5 ms, m =
0, 1, … 255, and Δτ2 = 0.4 ms; τ3 = 7.7 ms; τ4 = 23.6 ms; τ5 = 13 ms; editing pulse duration = 19 ms; ADC1/ADC2/ADC3
data points = 100/850/512; Δt = 0.2 ms; TR = 2.5 s; and total scan time = 10 min and 43 s.
mI: myo-Inositol; tCho: total choline; tCr: total creatine.
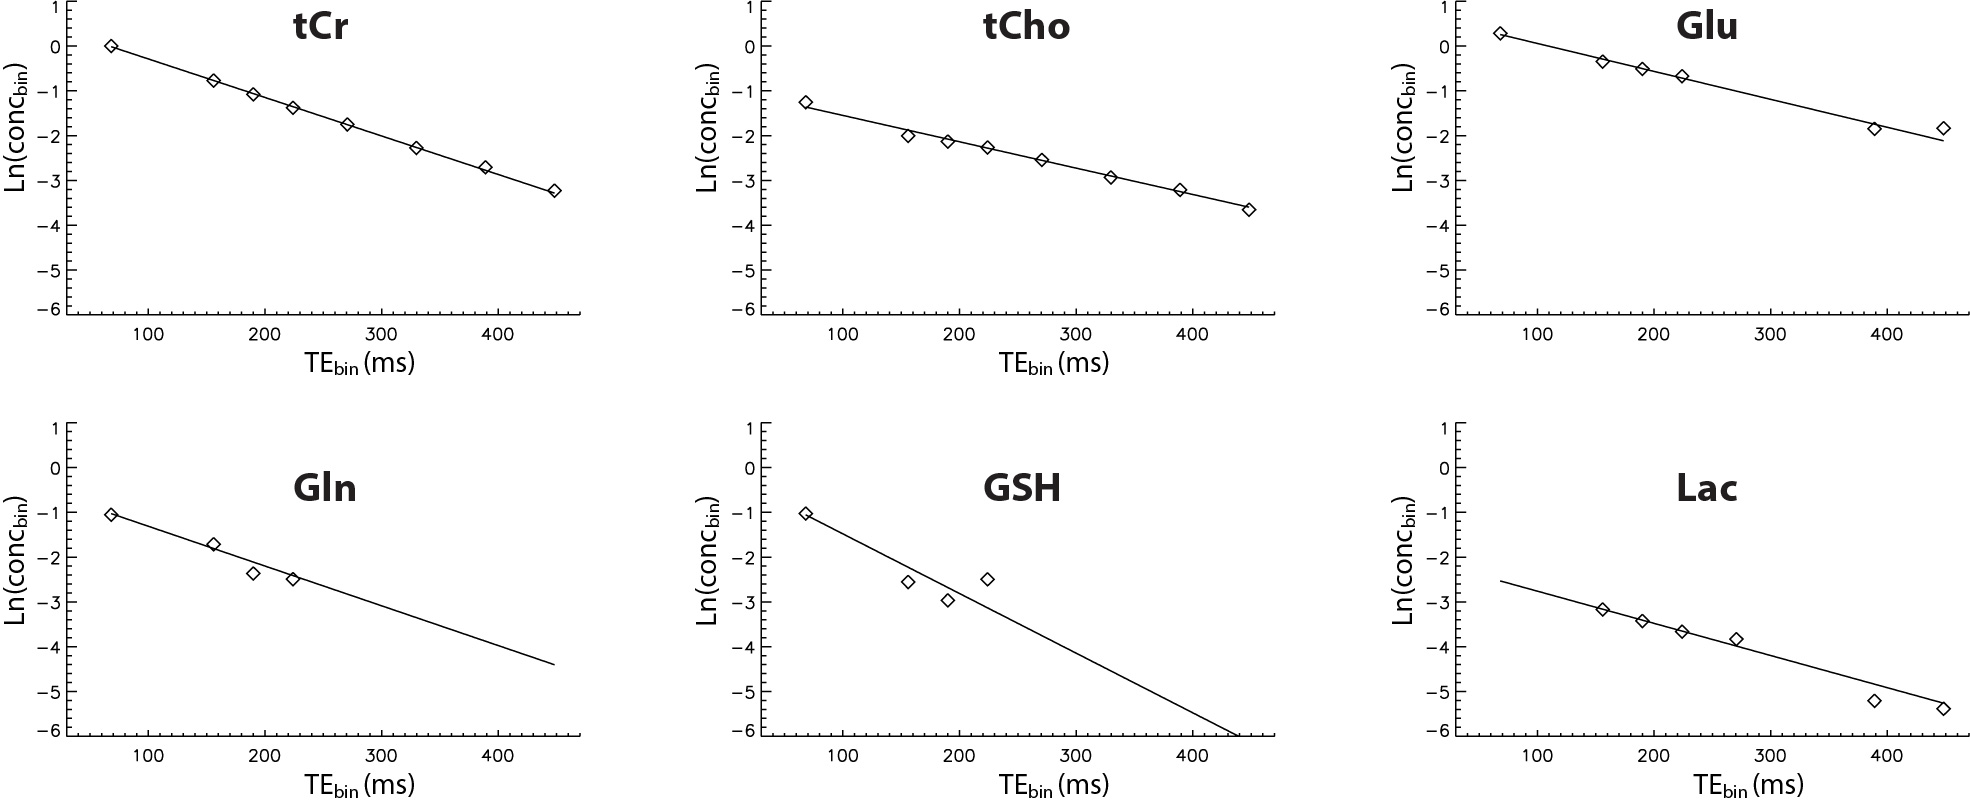
Figure 4 Linear regression of ln(concbin)
on TEbin. Here, TEbin represents the average TE for each
bin and concbin represents the T2-weighted metabolite concentration
for each bin, which was obtained by fitting the in vivo bin spectra shown in
Figure 3.
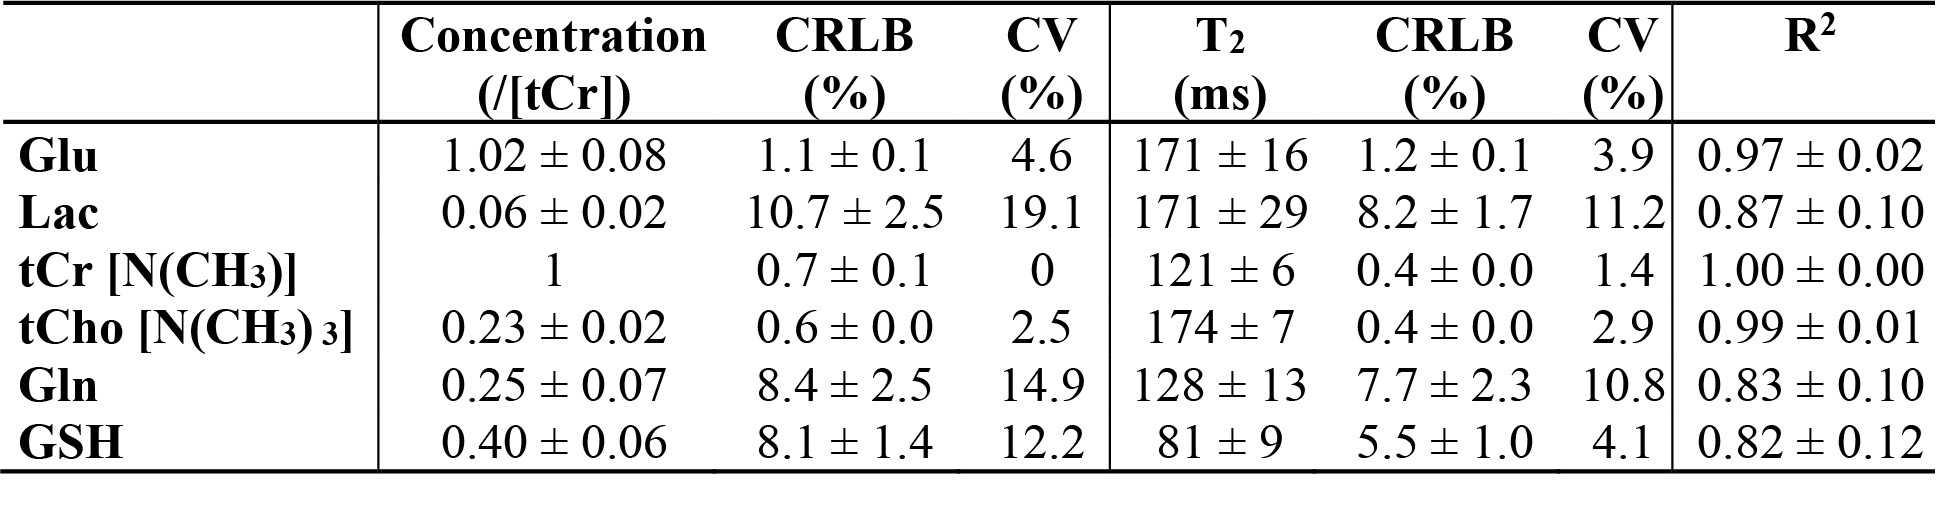
Table 1 Quantification of metabolite concentrations
(1/[tCr]) and T2 relaxation times in the ACC of healthy
participants (n = 3; mean ± SD). The within-subject coefficients
of variation (CVs) were calculated from the test and re-test measurements of
the same voxel.
DOI: https://doi.org/10.58530/2024/0258