0257
Selective measurement of glycine in human brain by optimal control method at 7 T1Institute of Science and Technology for Brain-Inspired Intelligence, Fudan University, Shanghai, China, 2MR Research Collaboration Team, Siemens Healthineers Ltd, Shanghai, China, 3Huashan Hospital, Fudan University, Shanghai, China, 4MR Application Development, Siemens Shenzhen Magnetic Resonance Ltd, Shenzhen, China, 5Physics Department and Shanghai Key Laboratory of Magnetic Resonance, School of Physics and Electronic Science, East China Normal University, Shanghai, China
Synopsis
Keywords: Pulse Sequence Design, Spectroscopy
Motivation: Glycine is key neurotransmitter associated with the the pathogenesis and imaging of gliomas, yet the non-invasive quantification of it remains a challenge.
Goal(s): To selectively measure glycine in human brain.
Approach: A new pulse sequence was developed, utilizing optimal control techniques to selectively detect glycine signals while effectively suppressing myo-inositol signals.
Results: Experimental results from both phantom models and glioma patient studies confirm the selective detection of glycine. Preliminary data indicate a relationship between glycine signal intensities and glioma distributions.
Impact: The use of the developed pulse sequence for the selective measurement of glycine in the human brain may provide possibility for more accurate assessment of glioma aggressiveness.
Introduction
Glycine (Gly), a critical neurotransmitter in brain function, has been reported to be implicated in the pathogenesis of tumor proliferation1. Magnetic resonance spectroscopy (MRS) is currently the most commonly used non-invasive technique for in vivo assessment of glycine levels, incorporating advanced methodologies such as TE-optimized triple refocusing 2, optimized long-TE PRESS sequence at 7 T3, optimized PRESS sequence timings4. However, accurate quantification of glycine remains a challenge due to its low concentration and spectral overlap with myo-inositol(mI), and field inhomogeneities due to glioma heterogeneity, complicating its clinical application. Optimal Control (OC) pulses have be proven to improve the efficiency of spin state transitions and enable the discrimination of MRS signals5–7. This study introduces a Gly-targeted MRS sequence based on OC method for selective glycine measurement in glioma at 7 T.Materials and Methods
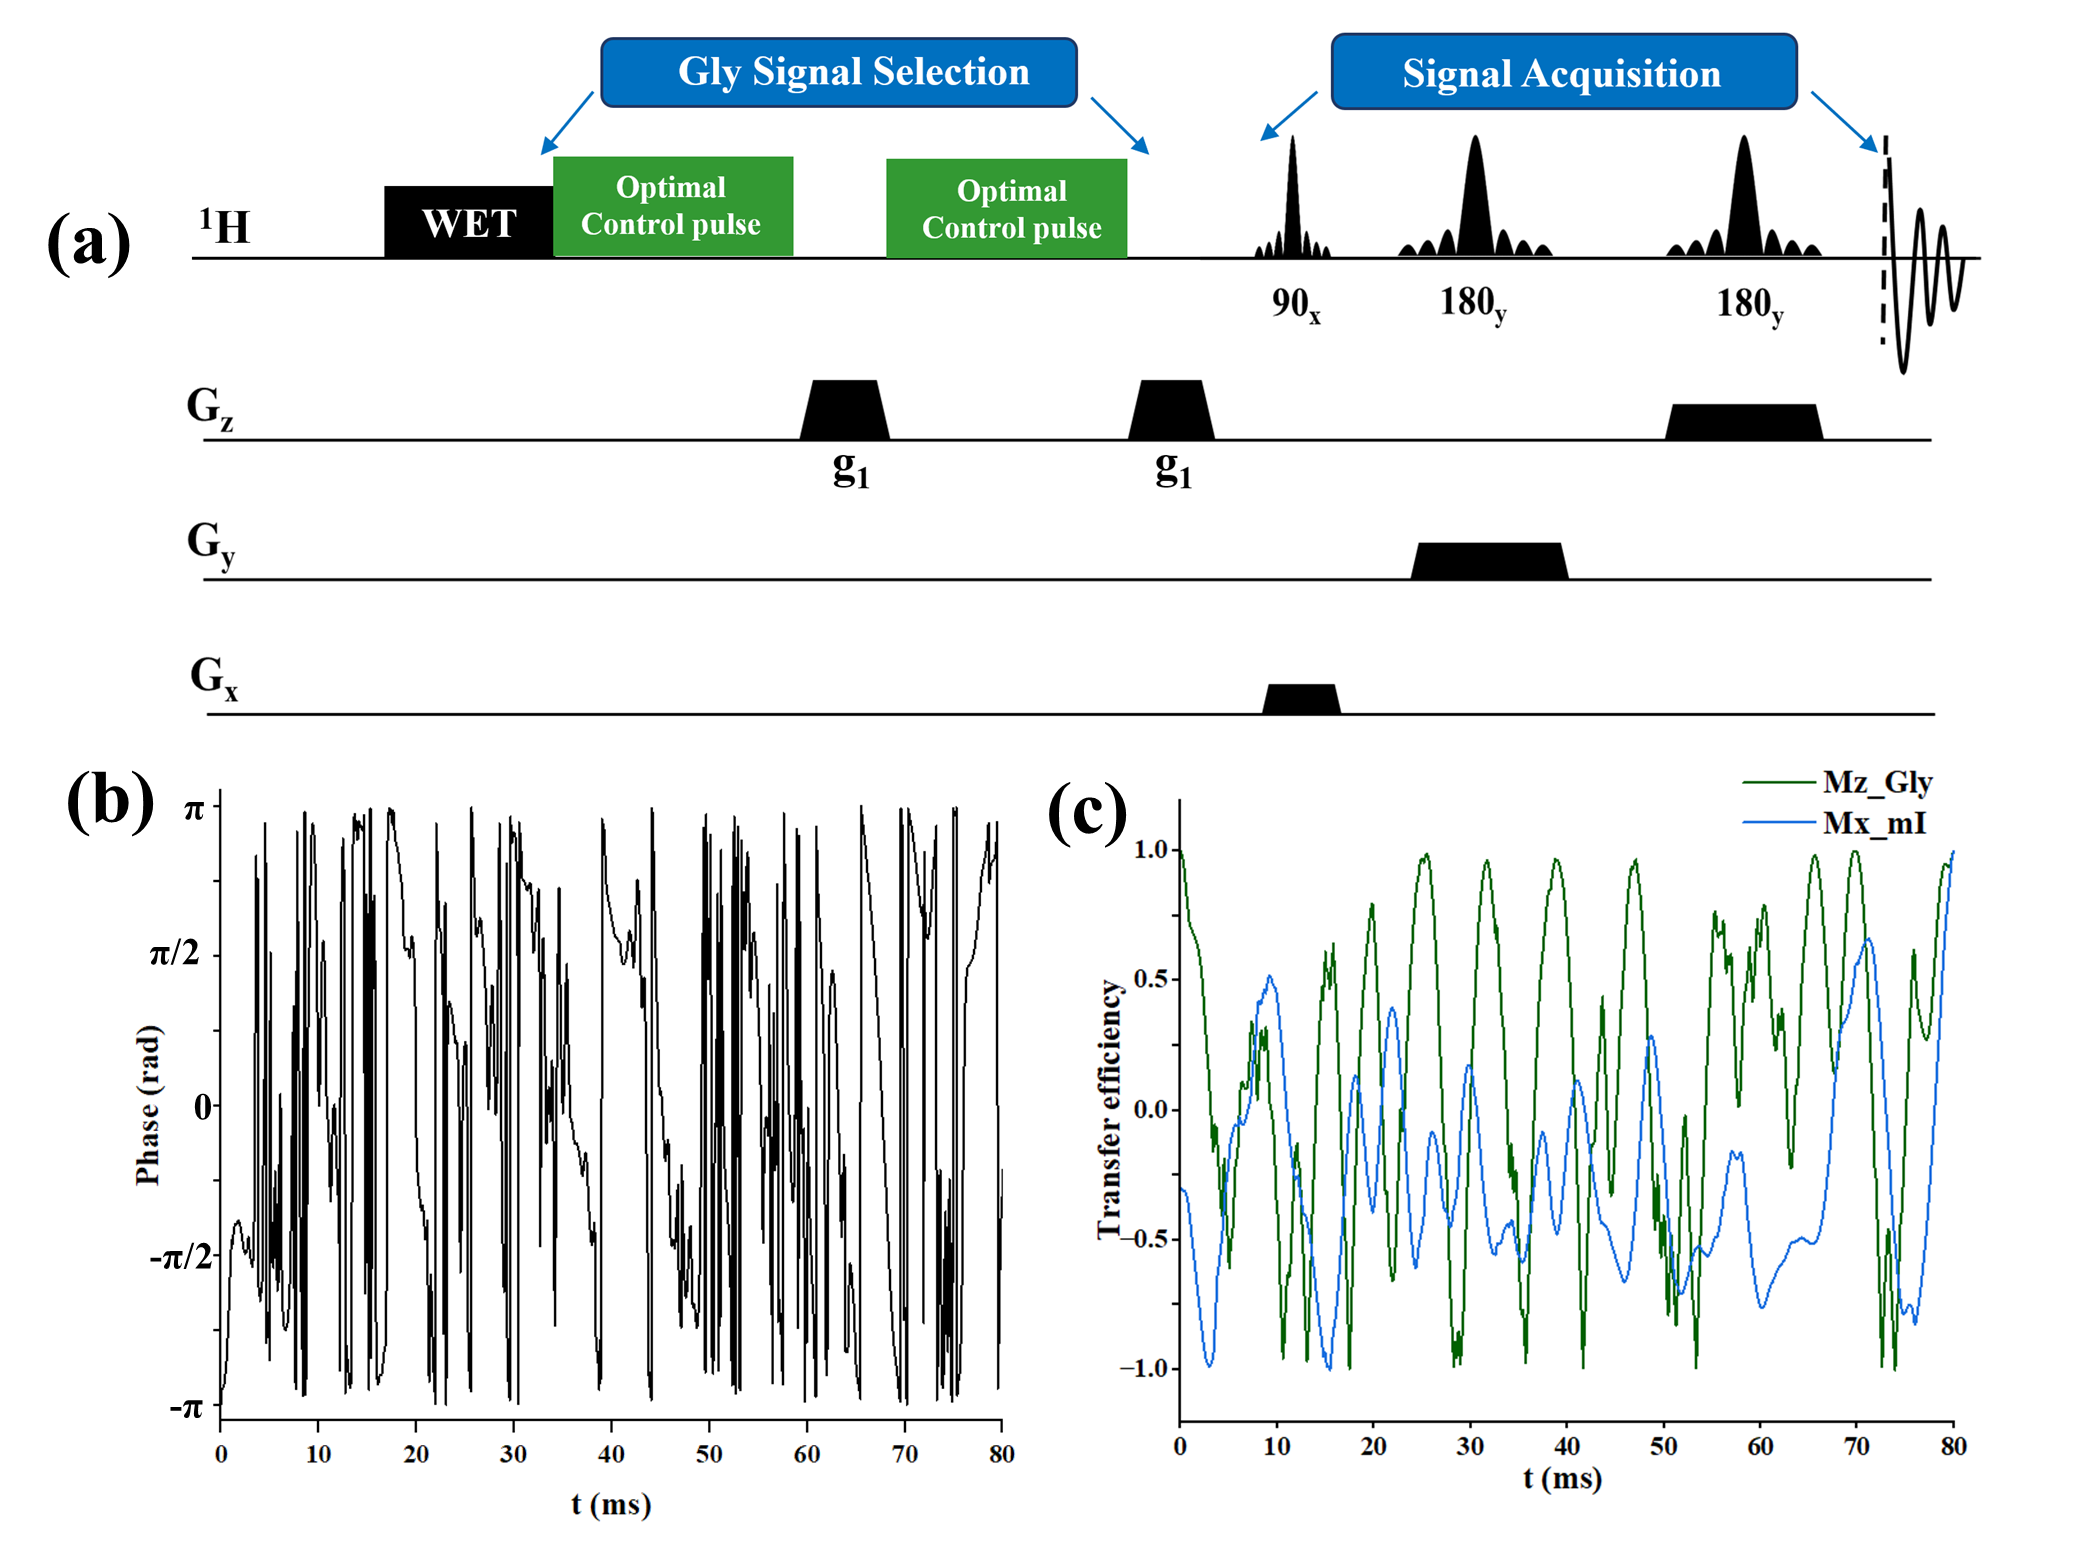
The study protocol was approved by the Institutional Review Board and written informed consent was provided by all participants. All MRS experiments were performed on a 7 T scanner (Siemens MAGNETOM Terra, Siemens Healthineers, Erlangen, Germany) with a 1-ch Tx/32-channel Rx head coil. Three phantoms each containing either Gly, mI, or both, dissolved in 50 mL of ultrapure water, and ten adult patients diagnosed with glioma according to the 2016 WHO CNS tumor classification, were included in this study. Figure 1a shows the diagram of the Gly-targeted MRS sequence developed in this work with three blocks: The first block served to suppress the water signal using WET scheme. The second block was designed to excite the transverse magnetization of mI (blue line in Figure 1c) and dephase while maintaining the magnetization of Gly (green line in Figure 1c) in z-direction using the OC pulse. Figure 1b show the phase modulation of the OC pulse. The third part was used for voxel localization and signal acquisition via PRESS scheme. The data for Gly-targeted MRS and routine 1H MRS were acquired with the following parameters: TR/TE, 2000/30ms; NA, 64; TA, 2min16s ;voxel size, 20 × 20 × 20 mm3 for human brain, and 15 × 15 × 15 mm3 for phantom experiments.Results and Discussion
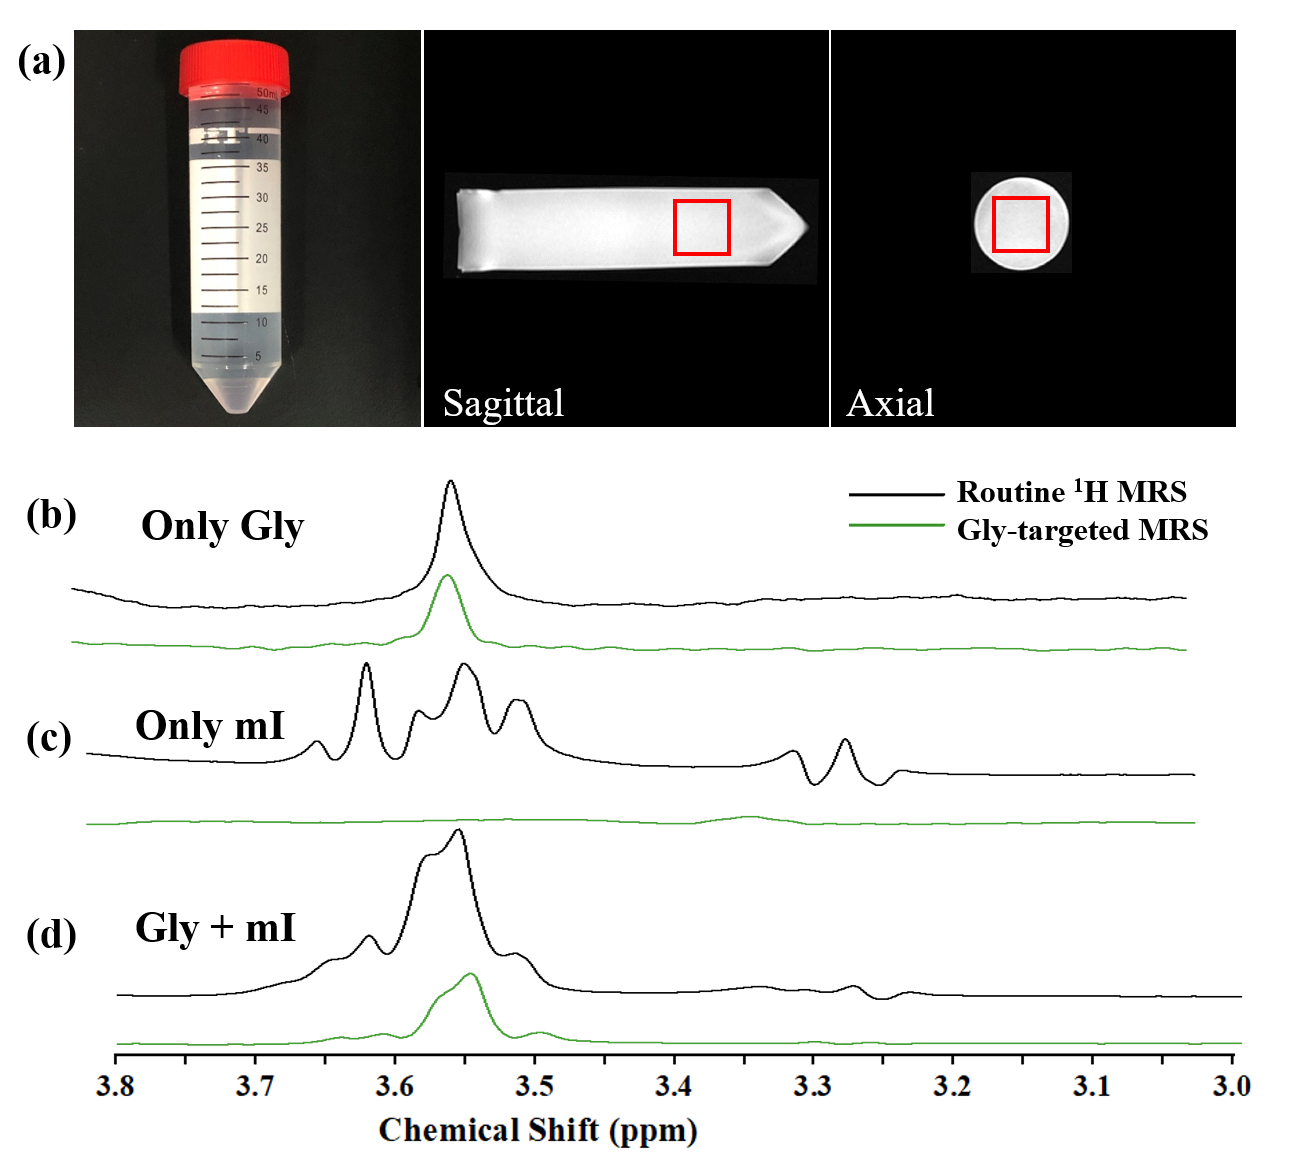
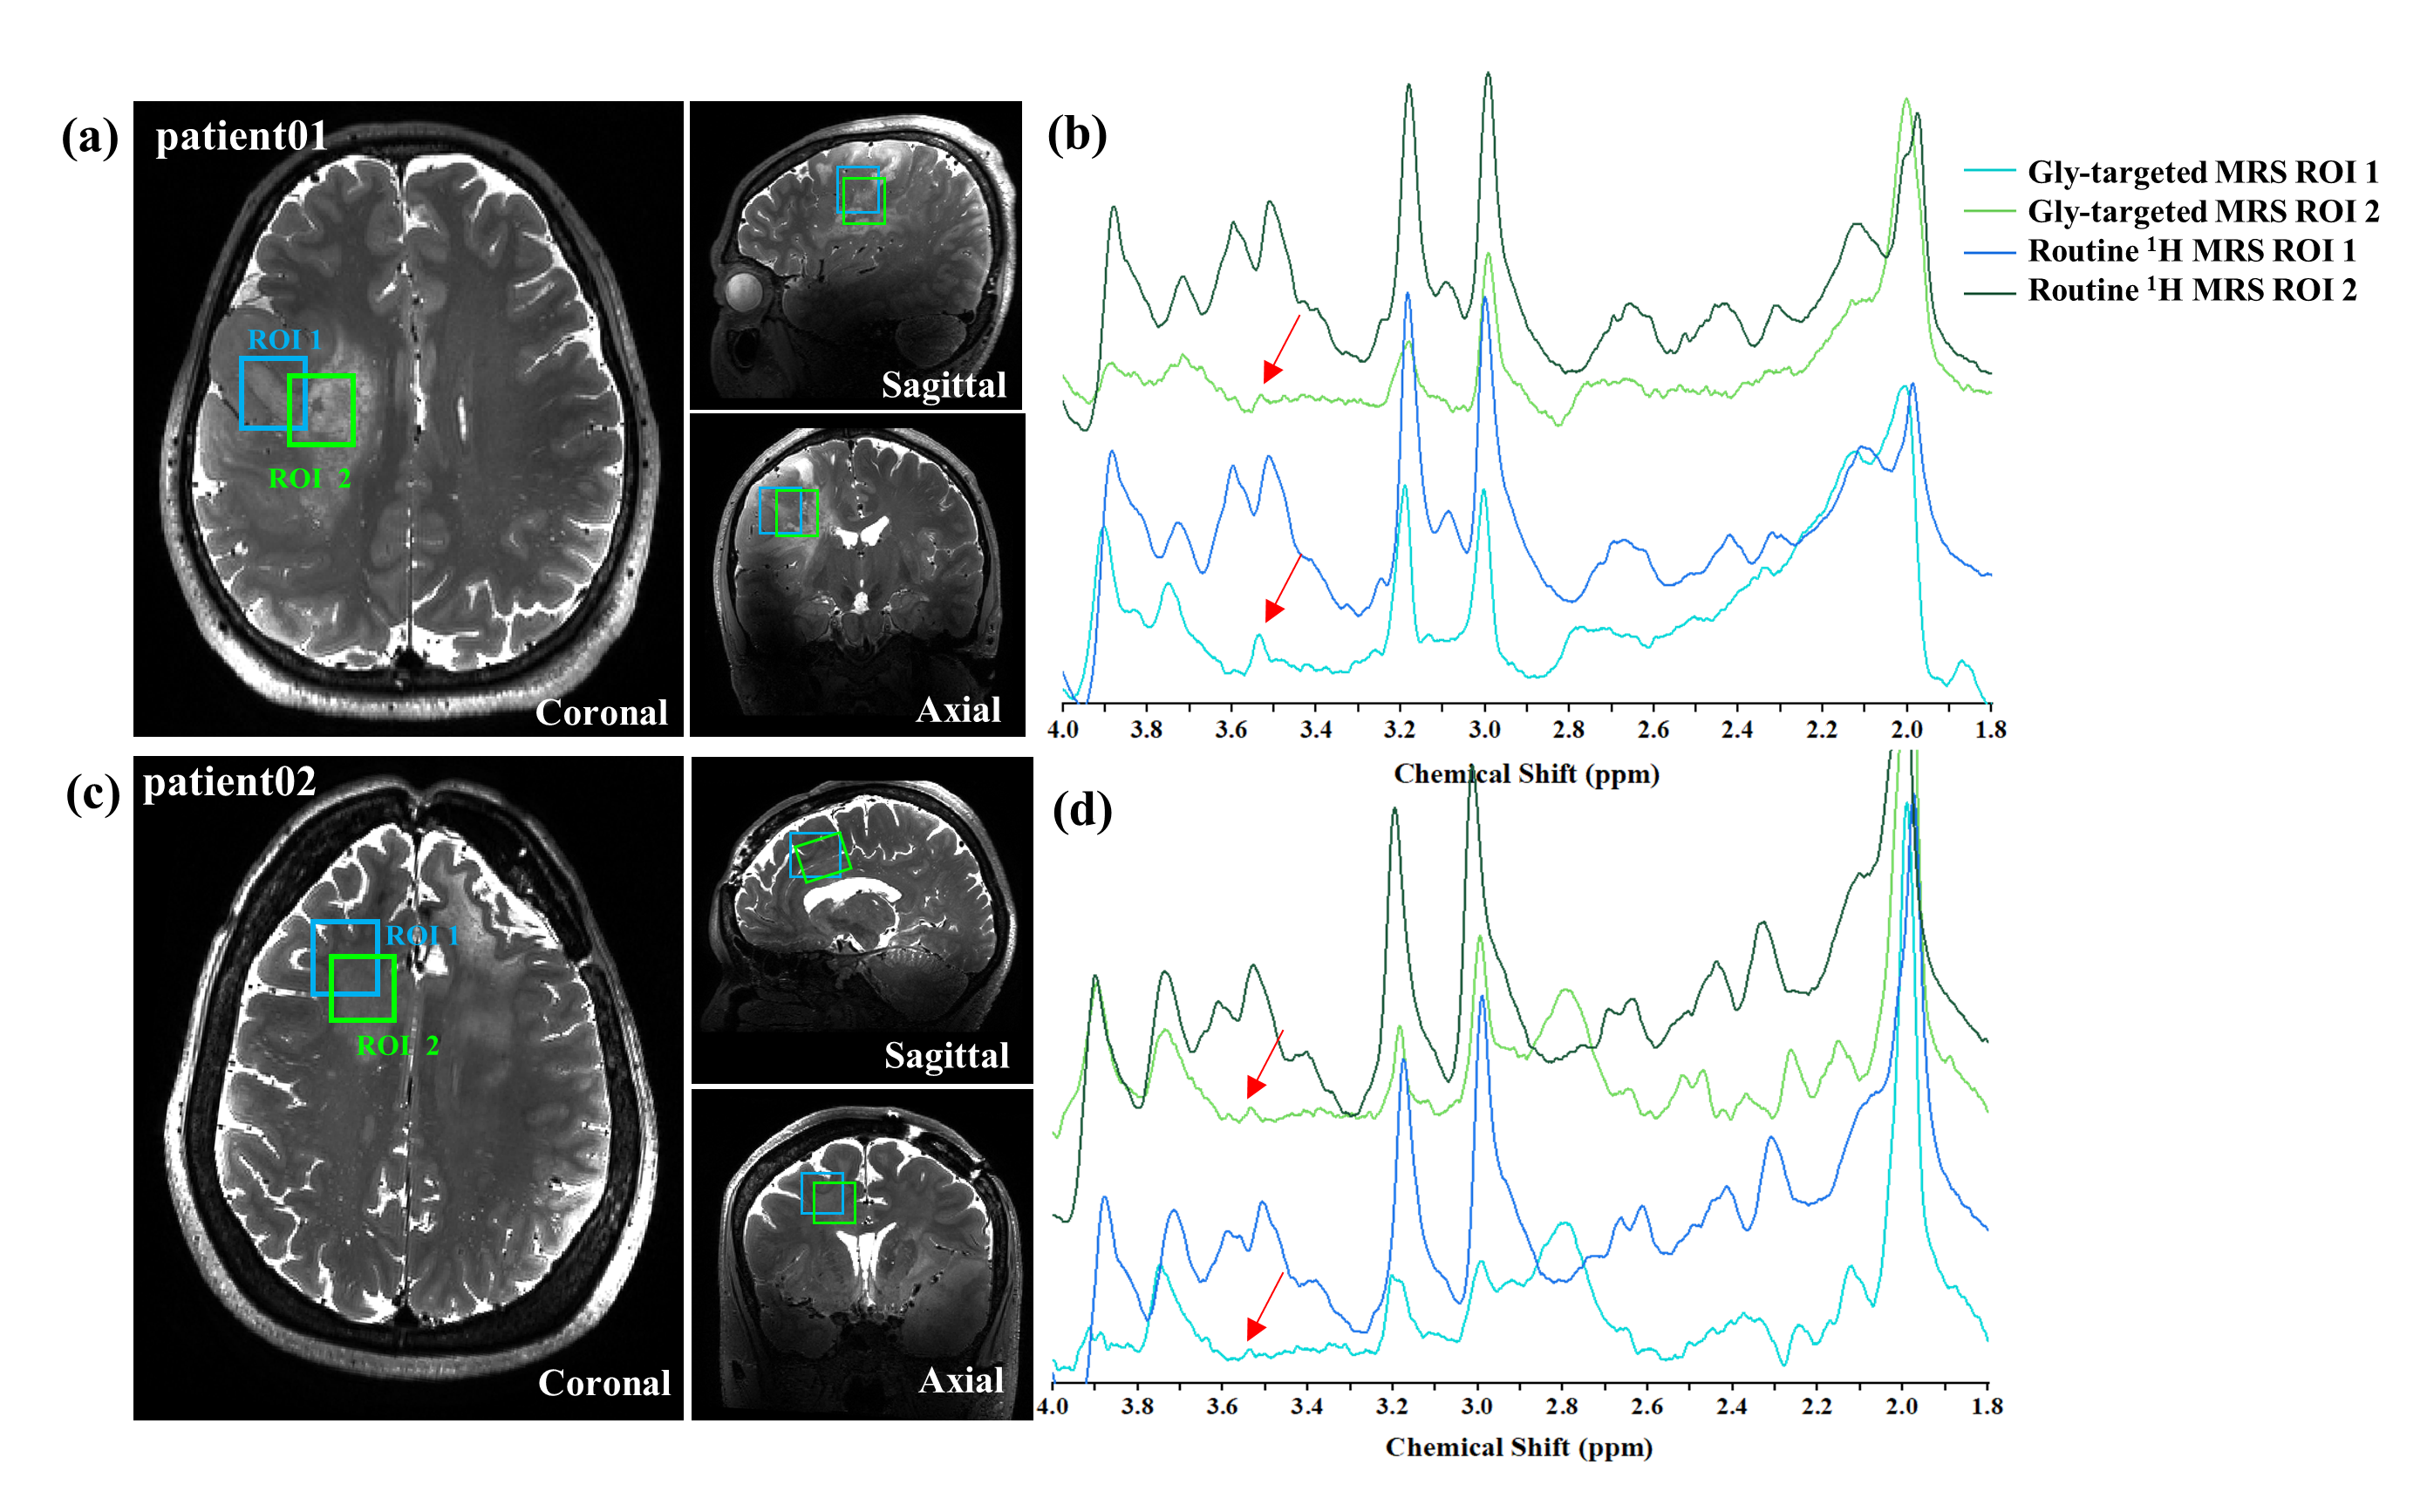
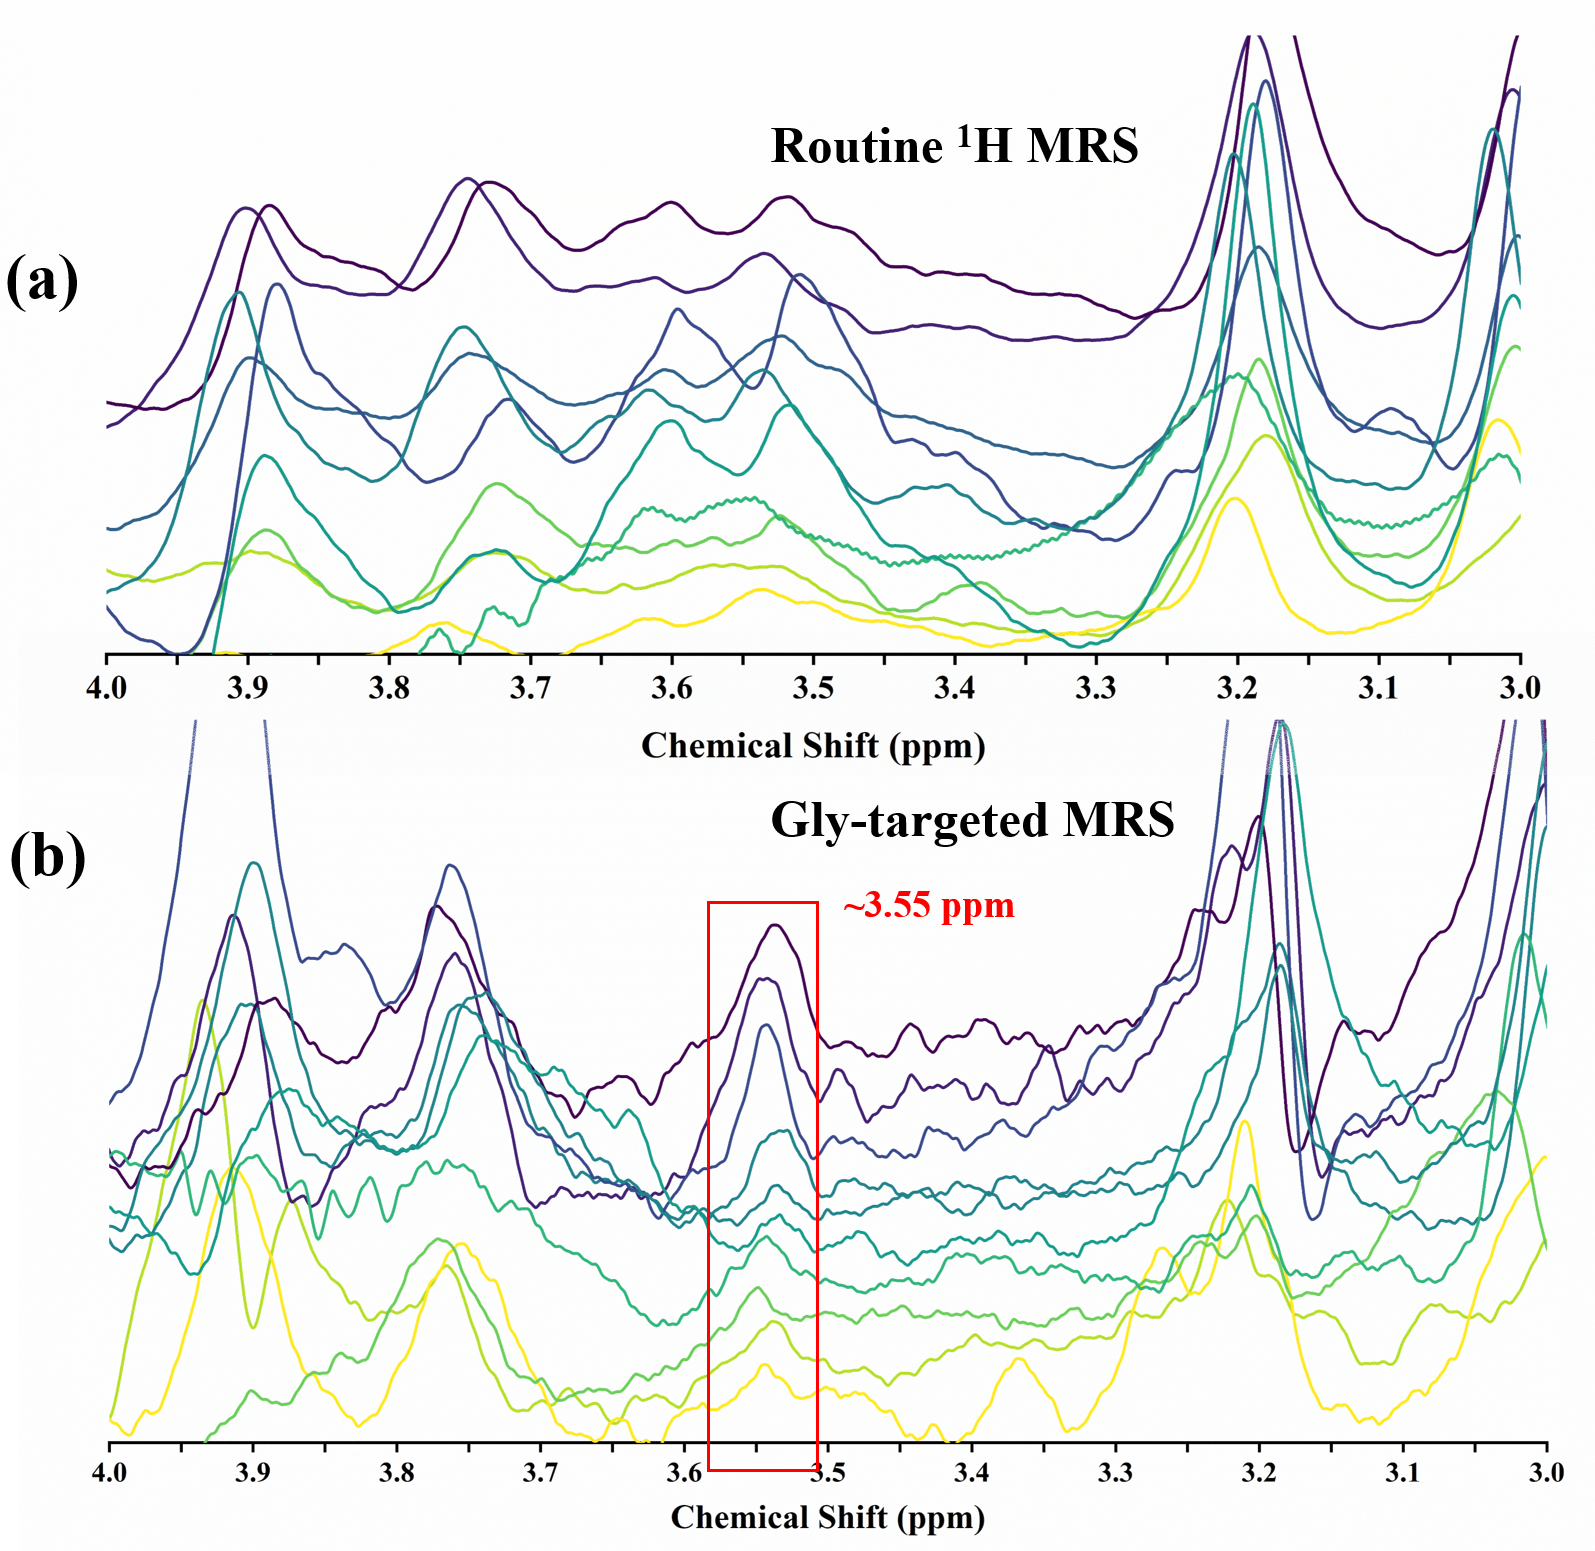
Figure 2 presents the results of the routine 1H MRS and the Gly-targeted MRS obtained from phantoms. The spectra of phantom containing only Gly (Figure 2b) indicates that the Gly singal intensity in Gly-targeted MRS is approximately 85% of the signal observed in the routine MRS. Figure 2c shows Gly-targeted spectrum reveals weak mI signals with an amplitude of only ~3% of the routine MRS, suggesting efficient suppression of the mI signals. This is also reflected in the mixture solutions shown in Figure 2d, where the the Gly signal is observable at around 3.55ppm with a good suppression of surrounding signals. Further evaluations were conducted on ten glioma patients to validate the efficiency of this sequence. Gliomas with hyper-intensive signals in the T2WI are shown in Figure 3a and 3c, which were used to determine the ROIs for MRS acquisition, including the core and margin tissues. The Gly-targeted MRS clearly reveals signals of Gly methylene protons at around 3.55ppm (red arrow), consistent with phantom results, and the amplitude varies with ROIs position. From Figure 3a and 3b, patient 1(grade II) demonstrates higher Gly signal from the glioma margin region compared to the core, similar to the trend observed in the choline signal in routine MRS. This may be due to the the presence of necrotic tissue in the core and the invasive growth of the glioma, leading to decreased cell density and metabolic activity. Conversely, the core region of patient 2 (grade IV) exhibits stronger glycine and choline signals compared to the margin ROI (Figure 3c, d), reflecting tumor heterogeneity and complex interactions with the microenvironment. Figure 4 displays all the ten patients Gly-targeted MRS and corresponding routine 1H MRS. The Gly-targeted MRS effectively reveals Gly signals at around 3.55ppm (red box) which couldn’t be distinguished in the routine MRS due to spectral overlap and baseline distortions, suggesting the feasibility of this sequence to quantify Gly within the same acquisition time.Conclusion
In this study, we introduced a new MRS sequence for selective measurement of glycine signals. The feasibility of this approach was clearly demonstrated by the experiments on both phantom and glioma patients. Further investigations into the relationship between Gly and tumor pathology are necessary to evaluate the performance of Gly-targeted MRS sequence in clinical practice.Acknowledgements
This work was supported by the National Natural Science Foundation of China (No. 81971583, No. 82271956), Shanghai Municipal Science and Technology Major Project (No. 2018SHZDZX01), National Key R&D Program of China (No. 2018YFC1312900).References
1. Vivek, T. et al. Glycine by MR spectroscopy is an imaging biomarker of glioma aggressiveness. Neuro. Oncol. 22, 1018–1029 (2020).
2. Tiwari, V. et al. Measurement of Glycine in Healthy and Tumorous Brain by Triple Refocusing MRS at 3T In Vivo. 30, 1–23 (2018).
3. Choi, C. et al. Measurement of Glycine in the Human Brain in Vivo by H-MRS at 3 T: Application in Brain Tumors. 618, 609–618 (2011).
4. Dobberthien, B. J., Tessier, A. G., Fallone, B. G. & Yahya, A. Optimized PRESS sequence timings for measuring glycine at 9.4 T: demonstration in vivo in rat brain. (2016).
5. Khaneja, N., Reiss, T., Kehlet, C., Schulte-Herbrüggen, T. & Glaser, S. J. Optimal control of coupled spin dynamics: design of NMR pulse sequences by gradient ascent algorithms. J. Magn. Reson. 172, 296–305 (2005).
6. Xin, J. X. et al. Distinguishing glutamate and glutamine in vivo 1H MRS based on nuclear spin singlet order filtering. Magn. Reson. Med. 89, 1728–1740 (2023).
7.
Yang, X. et al. Selectively Probing the Magnetic Resonance Signals of
γ-Aminobutyric Acid in Human Brains In Vivo. J. Magn. Reson. Imaging 1–10
(2023).
Figures