0256
CHEAP and SLOW: a comprehensive acquisition protocol for downfield, upfield, and spectral editing 1H-MRSI at 7T
1Institute for Diagnostic and Interventional Neuroradiology, Support Center for Advanced Neuroimaging (SCAN), University of Bern, Bern, Switzerland, 2Translational Imaging Center, sitem-insel, Bern, Switzerland, Bern, Switzerland
Synopsis
Keywords: Spectroscopy, High-Field MRI, downfield, Spectral editing, MRSI
Motivation: Integration of downfield, upfield, and spectral editing MRSI in clinical studies
Goal(s): Generate high resolution downfield (0.37 ml) and upfield (0.2 ml) in vivo MRSI at 7T
Approach: CHEAP-ESPI and SLOW-EPSI were used for downfield and upfield (spectral editing) MRSI, respectively, in two healthy volunteers and one glioma patient.
Results: A 4-minute acquisition with CHEAP-EPSI suffices for downfield MRSI (ATP/GSH+ and NAA+), while a 9-minute acquisition with SLOW-EPSI is adequate for upfield (NAA) and spectral editing (2HG, GABA, and Glx) MRSI.
Impact: The combination of CHEAP-EPSI and SLOW-EPSI enables the measurement of downfield, upfield, and edited 3D MRSI within approximately 13 minutes, making it readily integrable into clinical routine examinations or scientific studies.
INTRODUCTION
In the past four decades, localized in vivo 1H-MRS(I) of the brain has become a versatile tool for studying brain metabolism, aging [1], [2], and various pathologies such as brain tumours [3], [4], hypoxic conditions [5], and inborn diseases [6]. Most studies focused on the upfield part of the 1H-spectrum (0- 4.67 ppm), leaving the downfield relatively unexplored.Nonetheless, recent advancements have expanded the horizons of downfield single-voxel volume MRS into the realms of 2D [7] and 3D MRSI [8] at 3T. Notably, a comprehensive whole-brain 3D downfield MRSI pilot study conducted on brain tumor patients has underscored its potential value in clinical research and routine [9], with a nominal resolution of 0.74 ml and a TA of ~22 minutes.
The primary objective of this study was to undertake measurements of downfield 1H-brain spectra spanning the 6.2–9.2 ppm range, with higher resolution and shorter acquisition time at ultra-high field (7T). To accomplish this, we adapted version [10], [11] of the EPSI [12] sequence, employing a novel approach featuring CHEmical-shifted selective Adiabatic Pulse (CHEAP), distinct from prior methodologies [7]–[9]. A secondary objective was to integrate downfield MRSI into a clinical application environment alongside upfield and spectral editing, SLOW-editing, MRSI [10].
METHODS
Hardware:All MRI/MRSI acquisitions were performed on a Siemens 7T MR scanner in clinical mode (MAGNETOM Terra, Germany) using the Nova 1Tx32Rx head coil.
Pulse sequences:
Downfield MRSI: CHEAP-EPSI sequence [10], [12] (Figure 1A) with asymmetric CHEmical-shifted selective Adiabatic Pulse (CHEAP) [13]. TE = 40 ms, TR = 1300 ms, nominal matrix = 65×23×5 (4.3×7.8×11 mm).TA = 21 min with averages = 10, and TA = 4:12 min with averages = 2, No water and lipid suppression were applied.
Upfield and spectral editing MRSI: SLOW-EPSI. TE = 86 ms, TR = 1500 ms, nominal matrix = 65 × 23 × 9 (4.3 × 7.8 × 6.1 mm), averages = 1, and TA = 9:04 min.
Examined subjects:
Healthy volunteer (subject #1-2): 59-year-old and 31-year-old male. CHEAP-EPSI was applied an acquisition time of 21 minutes (averages = 10).
Glioma patient (subject #3): 47-year-old female, IDH-mutant astrocytoma, Grade 2 patient. Two averages of CHEAP-EPSI (TA = 4:12 min) and one average of SLOW-EPSI (TA = 9:04 min) were administered, with a TA of 13:16 min.
Data processing
For the data reconstruction and pre-post-processing, the MIDAS [14], and MATLAB R2019b were used. The metabolites maps were generated by absorption peak integration.
RESULTS and DISCUSSION
Figure 1D-E presents spectral data acquired from two healthy subjects (#1-2). The whole-slice spectra exhibit a discernible, narrow peak at 7.82 ppm, primarily associated with NAA, demonstrating robust intensity. In contrast, a broader peak in the vicinity of 8.18 ppm manifests increased complexity (Figure 1D,F). A more granular examination of the 8.18 ppm peak, conducted within smaller selected regions (Figure 1C), reveals the existence of four sub-peaks, namely (a) 8.23, (b) 8.18, (c) 8.14, and (d) 8.10 ppm, possibly stemming from ATP and GSH, etc.Figure 2 illustrates the integration maps pertaining to the 8.18 ppm peak (ATP/GSH+) in subject #1. Evidently, this peak exhibits heightened levels in white matter regions, while registering reduced levels in gray matter regions. In contrast, the NAA+ peak at 7.82 ppm displays a relatively subdued contrast in its distribution between gray and white matter regions (Figure 3). Noteworthy, the quality of the mapping, achieved through an average of 5 (TA = 10.5 minutes), is akin to that derived from an average of 10 (TA = 21 minutes).
Figure 4 shows the case of a glioma patient (subject #3), wherein both the 8.18 ppm and 7.82 ppm (NAA+) peaks register a reduction within the tumor region, simultaneously leading to an increase in the 8.18 to 7.82 ratio within the tumor area. Furthermore, the tumor spectra unveil more sub-peaks within the 8.1-8.3 ppm range when compared to normal tissue (Figure 4B, with pronounced distinctions in slice #2).
Figure 5 displays the metabolite maps acquired using SLOW-EPSI. 2HG is clearly visible within the tumour region. The NAA significantly decreases within the tumour region (slices #2-6) compared to GABA+ and Glx.
CONCLUSION
Our study demonstrates that a 10.5-minute acquisition of CHEAP-EPSI yields high-resolution 3D mapping of downfield metabolites (DF7.82 and DF8.18) with sufficient SNR, while a 4-minute measurement suffices for reasonable mapping. SLOW-EPSI, requiring 9 minutes, provides 3D maps for upfield metabolite (NAA) and the edited metabolites (2HG, Glx, and GABA+). The combination of CHEAP-EPSI and SLOW-EPSI enables the measurement of downfield, upfield, and edited 3D MRSI within approximately 13 minutes, making it readily integrable into clinical routine examinations or scientific studies.Acknowledgements
Supported by the Swiss National Science Foundation (SNSF-182569, and SNSF-207997).
References
[1] L. G. Kaiser, N. Schuff, N. Cashdollar, and M. W. Weiner, “Age-related glutamate and glutamine concentration changes in normal human brain: 1H MR spectroscopy study at 4 T,” Neurobiol Aging, vol. 26, no. 5, pp. 665–672, May 2005, doi: 10.1016/j.neurobiolaging.2004.07.001.
[2] L. Minati, M. Grisoli, and M. G. Bruzzone, “MR Spectroscopy, Functional MRI, and Diffusion-Tensor Imaging in the Aging Brain: A Conceptual Review,” J Geriatr Psychiatry Neurol, vol. 20, no. 1, pp. 3–21, Mar. 2007, doi: 10.1177/0891988706297089.
[3] O. C. Andronesi et al., “Detection of 2-Hydroxyglutarate in IDH-Mutated Glioma Patients by In Vivo Spectral-Editing and 2D Correlation Magnetic Resonance Spectroscopy,” Sci Transl Med, vol. 4, no. 116, pp. 116ra4-116ra4, Jan. 2012, doi: 10.1126/scitranslmed.3002693.
[4] C. Choi et al., “2-Hydroxyglutarate detection by magnetic resonance spectroscopy in IDH-mutated patients with gliomas,” Nat Med, vol. 18, no. 4, pp. 624–629, Apr. 2012, doi: 10.1038/nm.2682.
[5] J. Penrice et al., “Proton Magnetic Resonance Spectroscopy of the Brain in Normal Preterm and Term Infants, and Early Changes after Perinatal Hypoxia-Ischemia,” Pediatr Res, vol. 40, no. 1, pp. 6–14, Jul. 1996, doi: 10.1203/00006450-199607000-00002.
[6] K. M. Cecil, “MR Spectroscopy of Metabolic Disorders,” Neuroimaging Clin N Am, vol. 16, no. 1, pp. 87–116, Feb. 2006, doi: 10.1016/j.nic.2005.10.004.
[7] M. Považan, M. Schär, J. Gillen, and P. B. Barker, “Magnetic resonance spectroscopic imaging of downfield proton resonances in the human brain at 3 T,” Magn Reson Med, vol. 87, no. 4, pp. 1661–1672, Apr. 2022, doi: 10.1002/MRM.29142.
[8] İ. Özdemir, S. Ganji, J. Gillen, S. Etyemez, M. Považan, and P. B. Barker, “Downfield proton <scp>MRSI</scp> with whole‐brain coverage at <scp>3T</scp>,” Magn Reson Med, vol. 90, no. 3, pp. 814–822, Sep. 2023, doi: 10.1002/mrm.29706.
[9] İ. Özdemir, D. O. Kamson, S. Etyemez, L. Blair, D. D. M. Lin, and P. B. Barker, “Downfield Proton MRSI at 3 Tesla: A Pilot Study in Human Brain Tumors,” Cancers (Basel), vol. 15, no. 17, p. 4311, Aug. 2023, doi: 10.3390/cancers15174311.
[10] G. Weng et al., “SLOW: A novel spectral editing method for whole‐brain MRSI at ultra high magnetic field,” Magn Reson Med, vol. 88, no. 1, pp. 53–70, Jul. 2022, doi: 10.1002/mrm.29220.
[11] G. Weng, P. Radojewski, and J. Slotboom, “α-D-Glucose as a non-radioactive MRS tracer for metabolic studies of the brain,” Sci Rep, vol. 13, no. 1, p. 6159, Apr. 2023, doi: 10.1038/s41598-023-33161-8.
[12] A. Ebel and A. A. Maudsley, “Improved spectral quality for 3D MR spectroscopic imaging using a high spatial resolution acquisition strategy,” Magn Reson Imaging, vol. 21, no. 2, pp. 113–120, 2003, doi: 10.1016/S0730-725X(02)00645-8.
[13] J. Slotboom et al., “Proton Resonance Spectroscopy Study of the Effects of L-Ornithine-L-Aspartate on the Development of Encephalopathy, Using Localization Pulses with Reduced Specific Absorption Rate,” J Magn Reson B, vol. 105, no. 2, Oct. 1994, doi: 10.1006/jmrb.1994.1114.
[14] A. A. Maudsley et al., “Comprehensive processing, display and analysis forin vivo MR spectroscopic imaging,” NMR Biomed, vol. 19, no. 4, pp. 492–503, Jun. 2006, doi: 10.1002/nbm.1025.
Figures
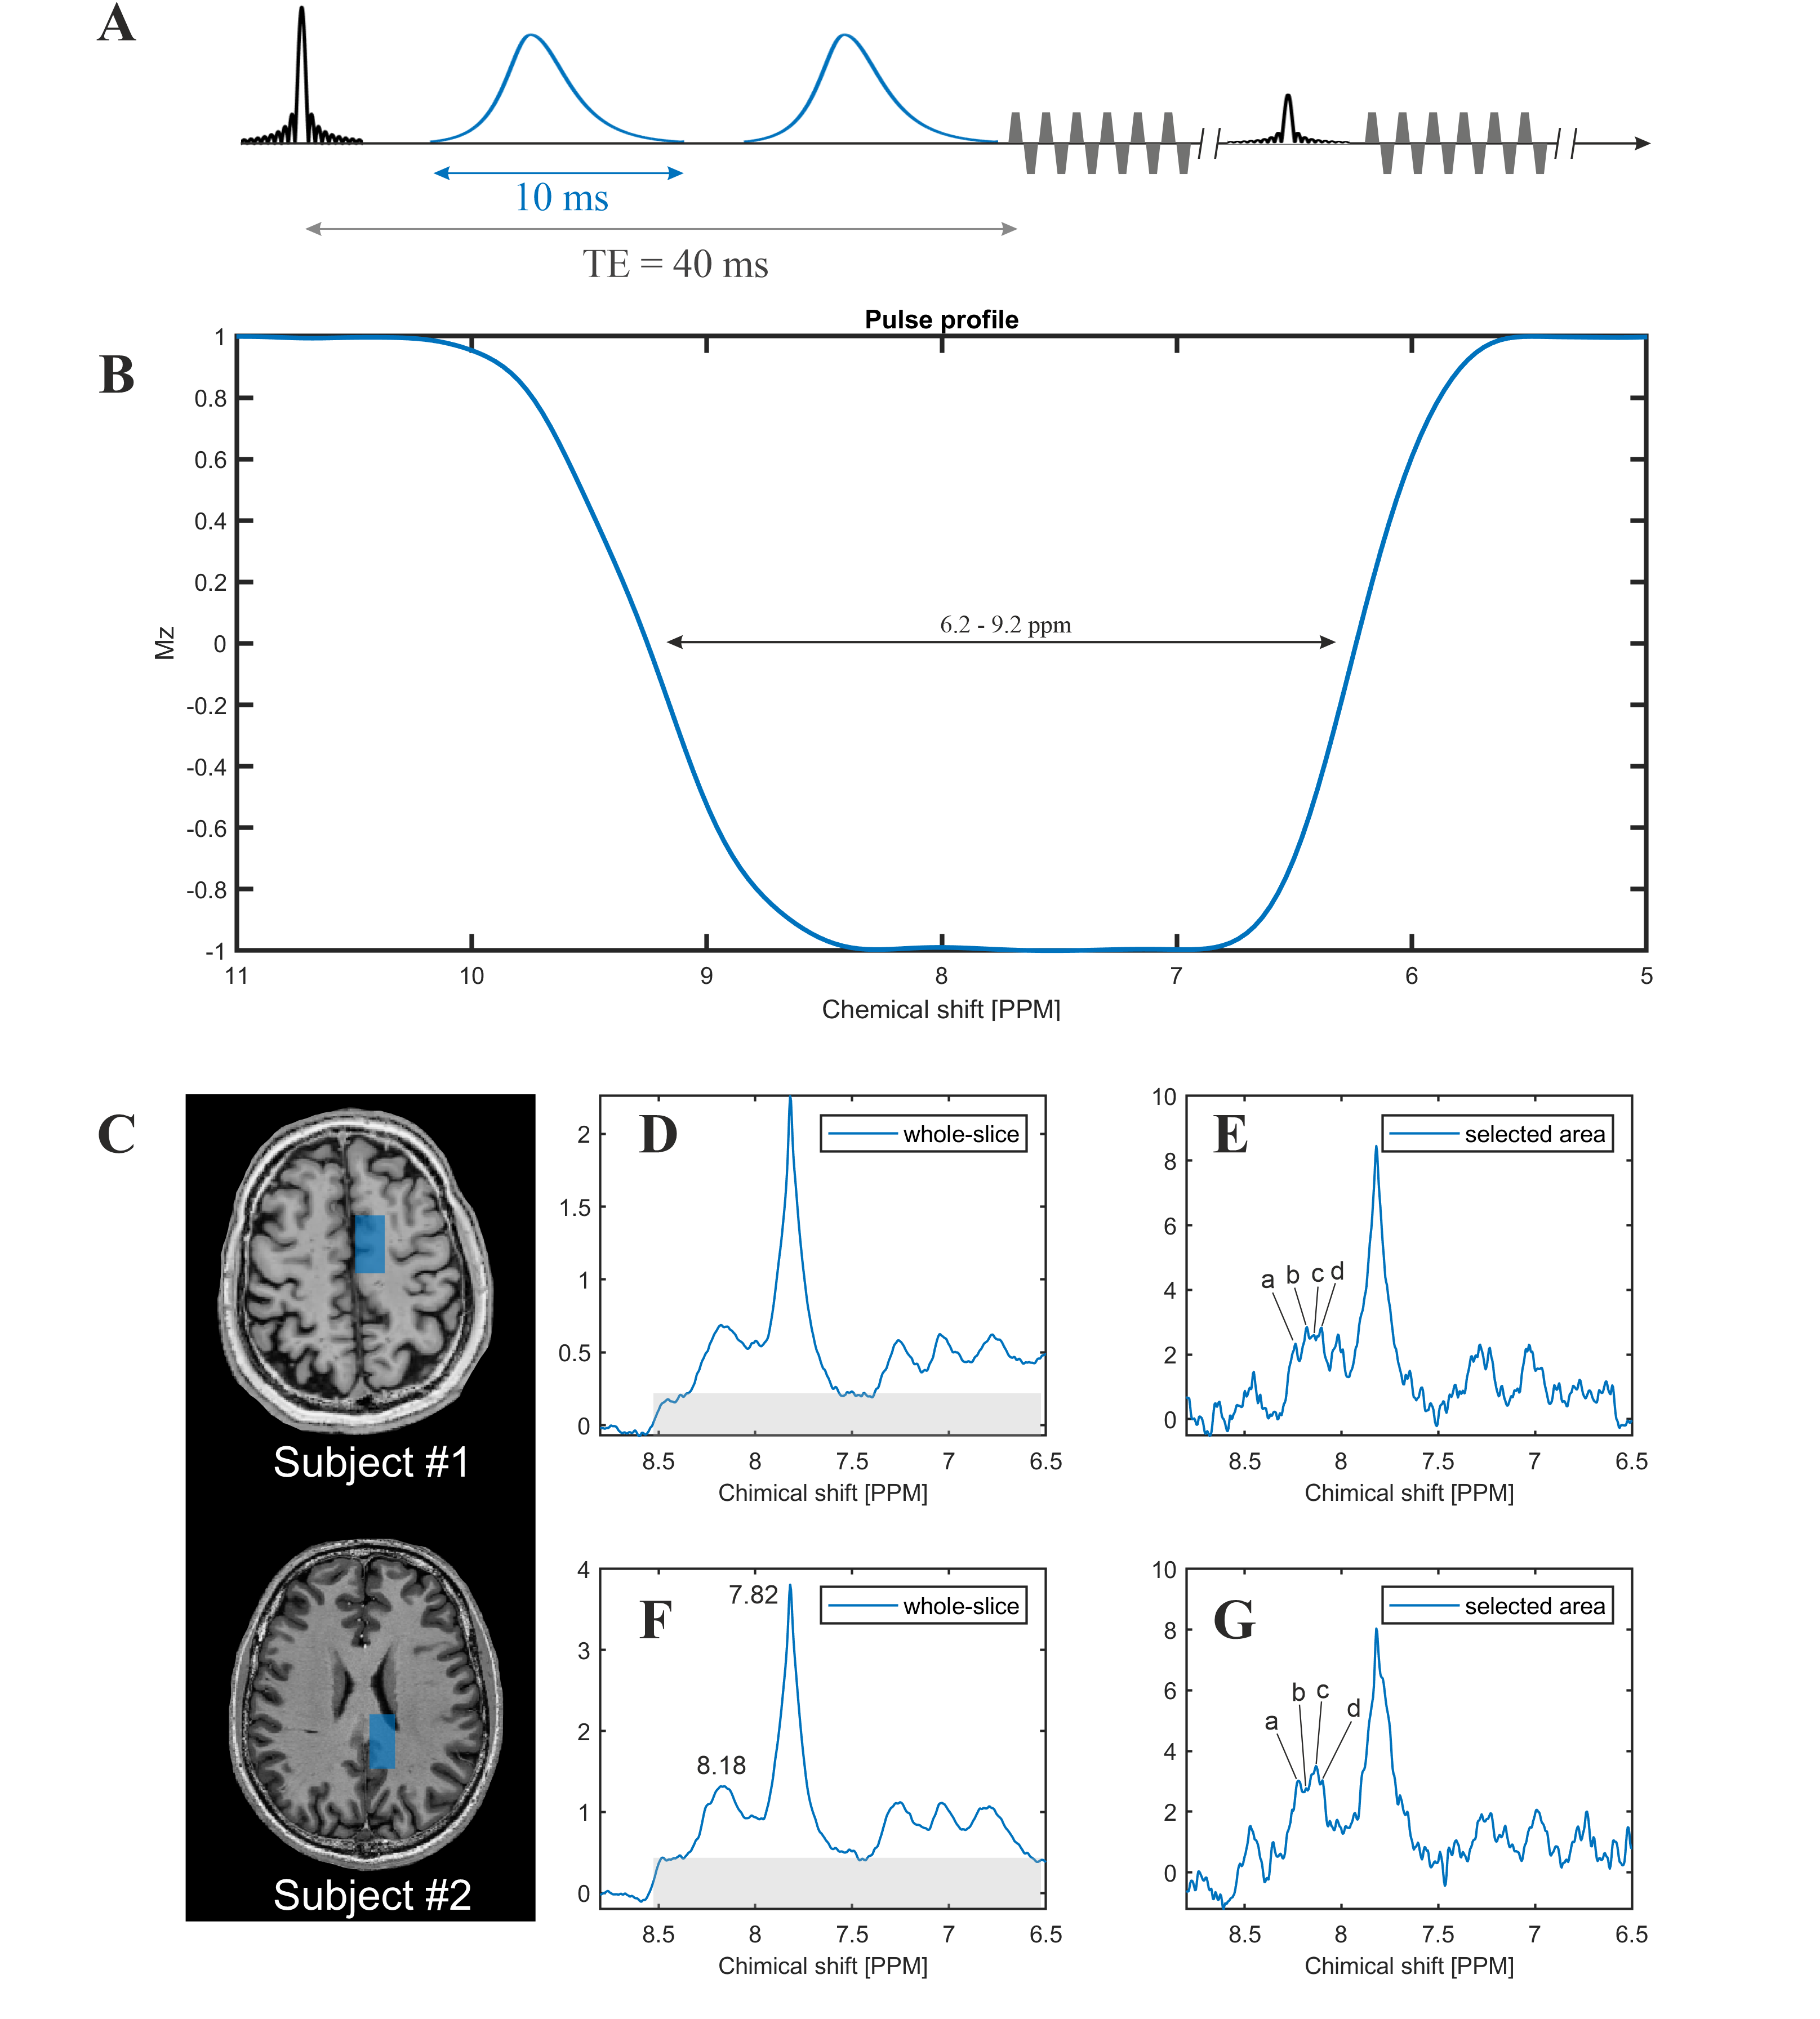
Figure 1: A) CHEAP-EPSI sequences [10], [13]. B) Pulse profiles of CHEAP. C) the T1-weighted MRI of subject #1-2. D) the spectra of whole-slice of subject #1. The grey area indicates the potential contribution from unknown metabolites and macromolecules. E) the spectra of selected area (indicated by blue area in C) of subject #1. F) the spectra of whole-slice of subject #2. G) the spectra of selected area (indicated by blue area in C) of subject #2. Both selected volumes in C are around 3.6 ml. The sub-peaks in E) and G) are at around 8.23 (a), 8.18 (b), 8.14 (c), and 8.10 (d) ppm, respectively.
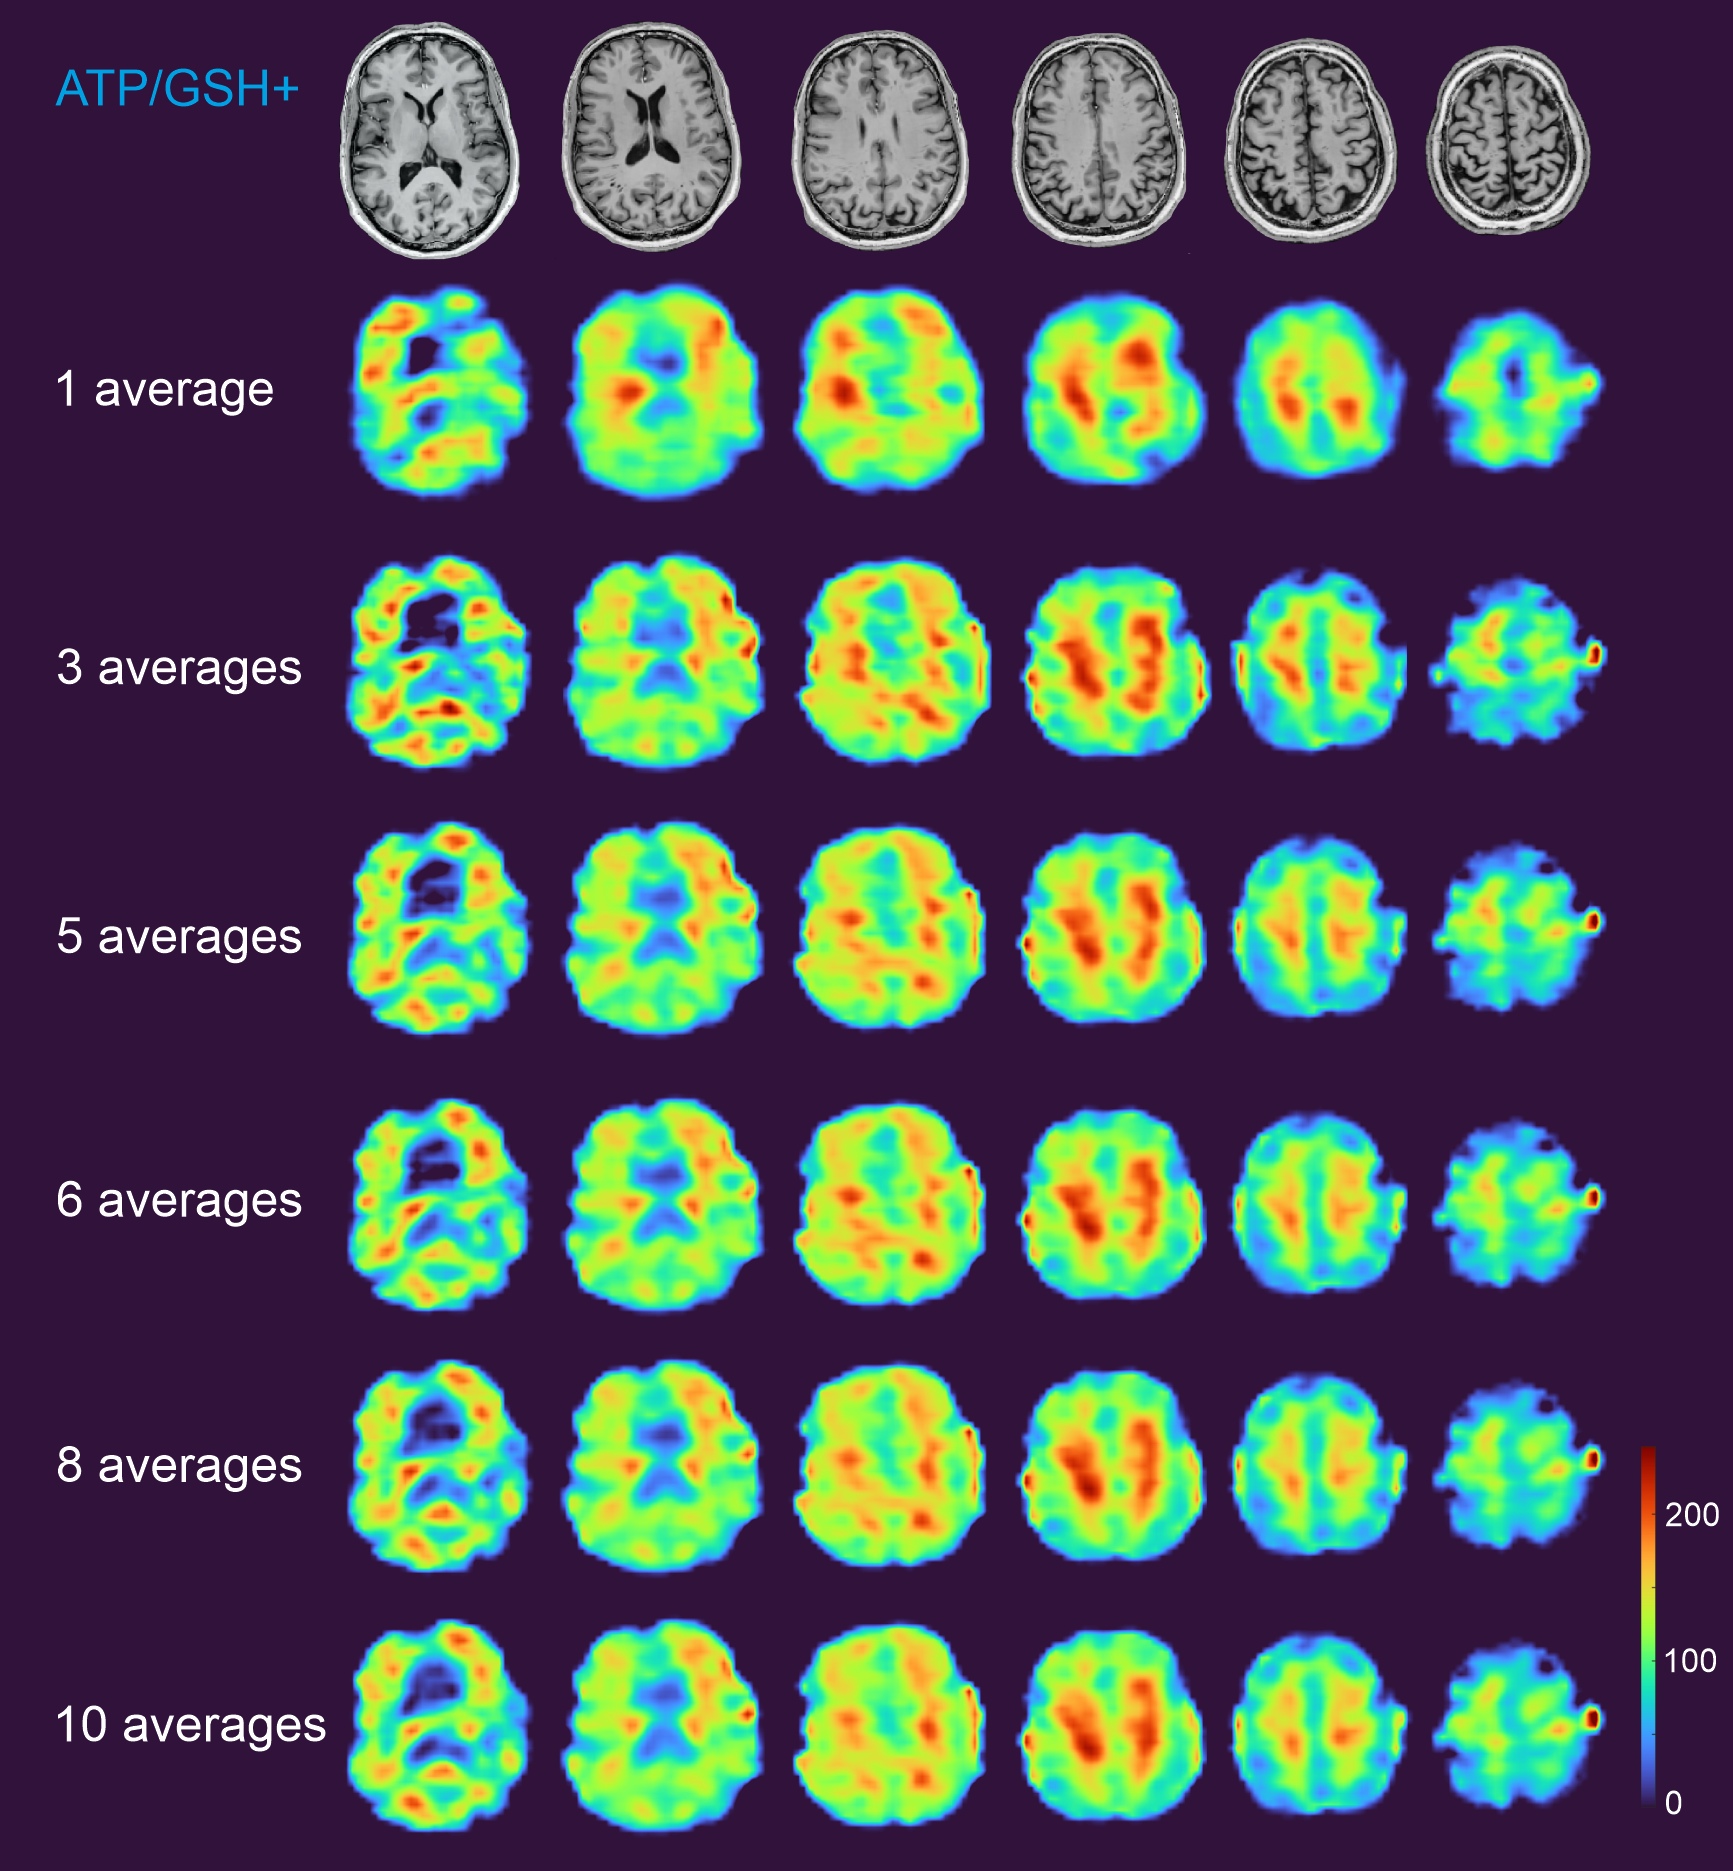
Figure 2: The DF 8.18 peak (ATP/GSH+) integration maps of subject #1. For the instance involving 1 average, a 5x5 moving median filter was employed, while a 3x3 moving filter was applied to the remaining cases. TA = 2:06 × N (number of averages) min, with nominal resolution = 4.3×7.8×11 mm.
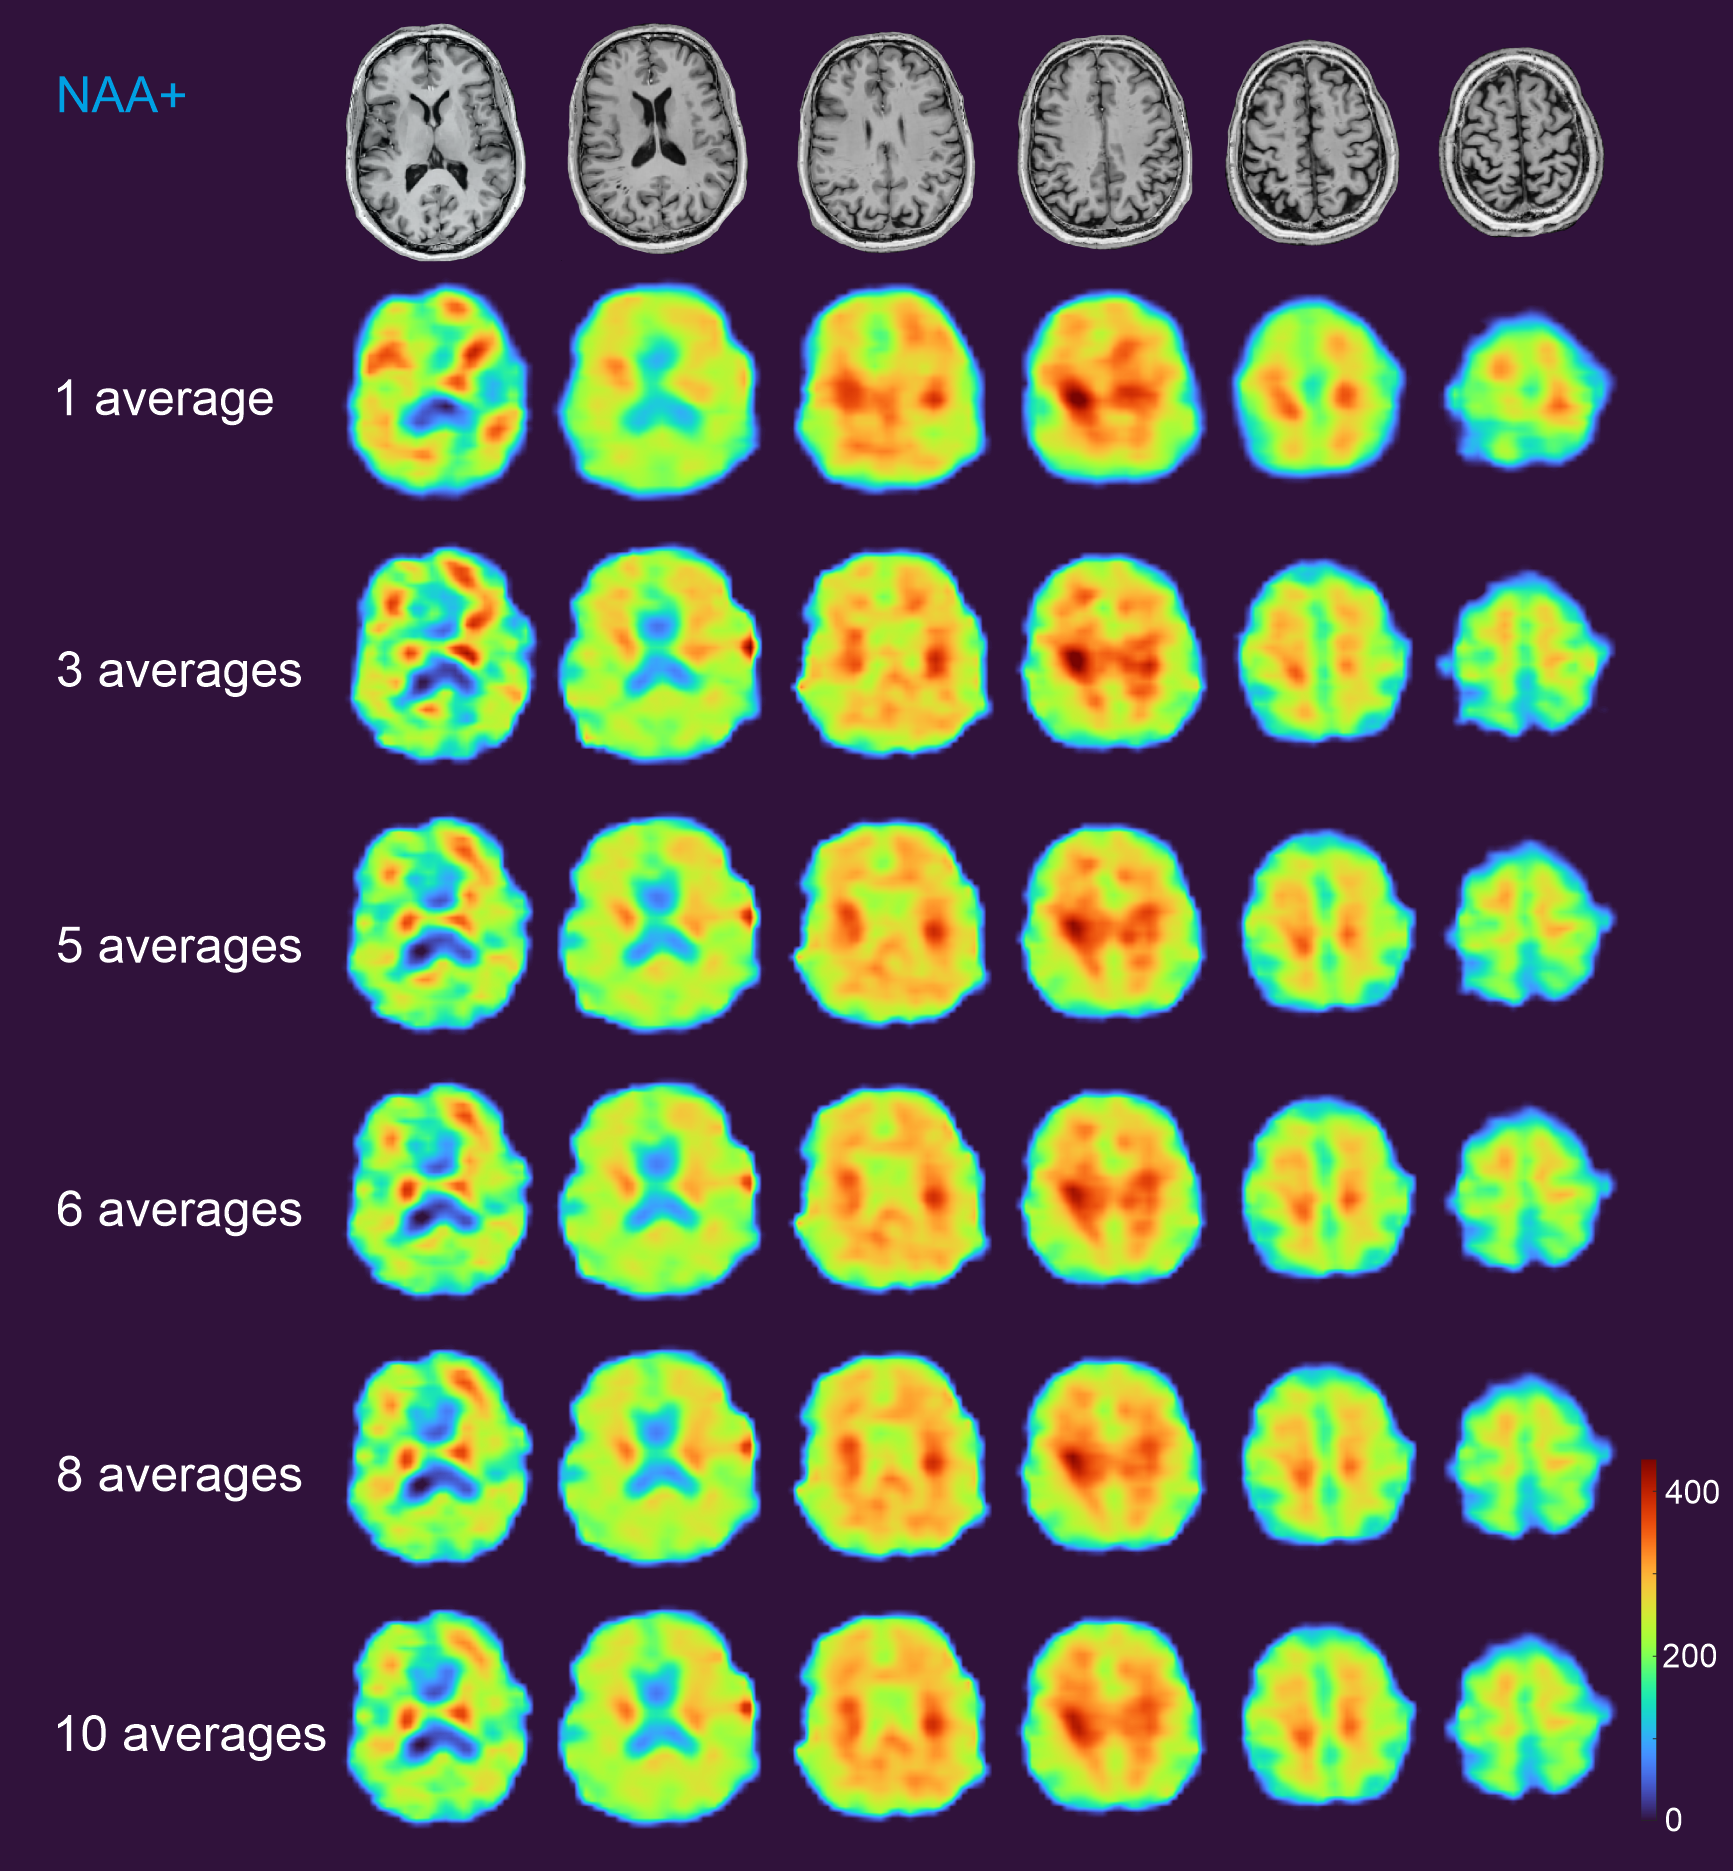
Figure 3: The DF 7.82 (NAA+) peak integration maps of subject #1. For the instance involving 1 average, a 5x5 moving median filter was employed, while a 3x3 moving filter was applied to the remaining cases. TA = 2:06 × N (number of averages) min, with nominal resolution = 4.3×7.8×11 mm.
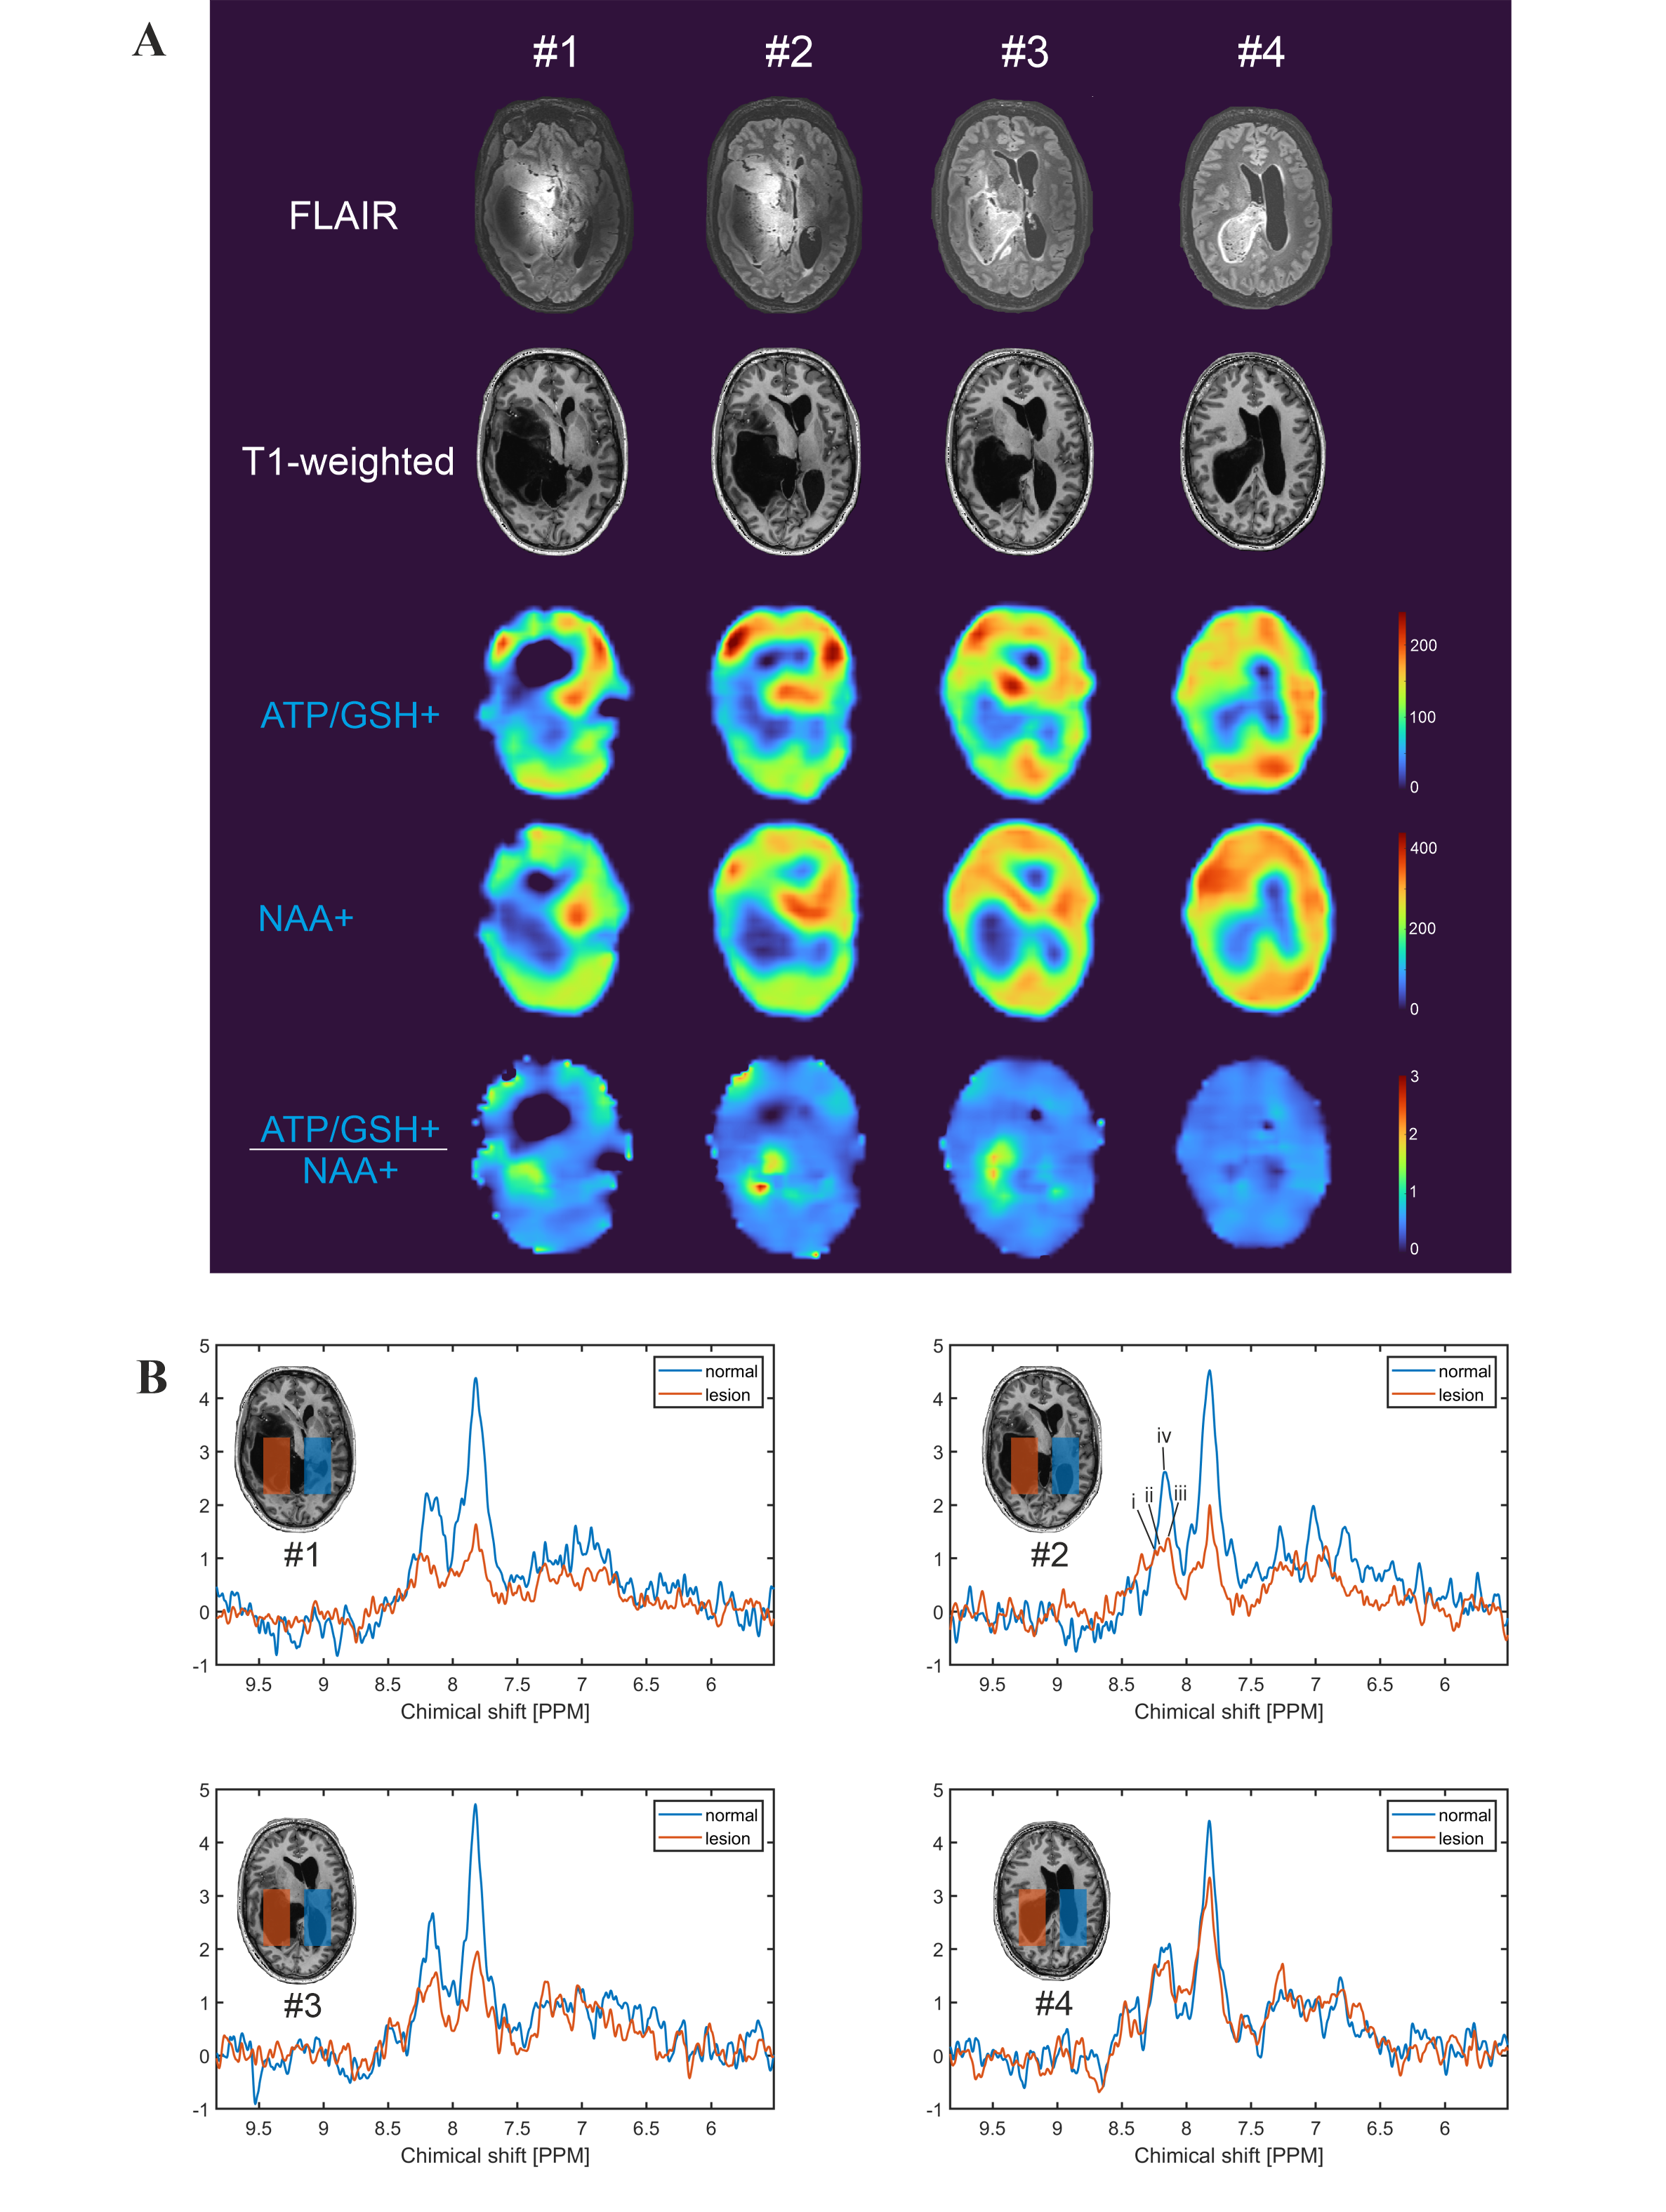
Figure 4: Downfield MRSI for glioma patient (subject #3). A) The DF 8.18, 7.82 (NAA+), and 8.18/7.82 peaks integration maps with 2 averages (TA = 4:12 min) and a 5x5 moving mean filter was applied. B) The spectra of lesion and normal tissue in four different slices (#1-4). The selected area size is around 38.8 ml. The peaks marked as i, ii, iii, and iv are at around 8.24, 8.20, 8.14, and 8.17 ppm, respectively. Note that glioma grow into the intra ventricular space.
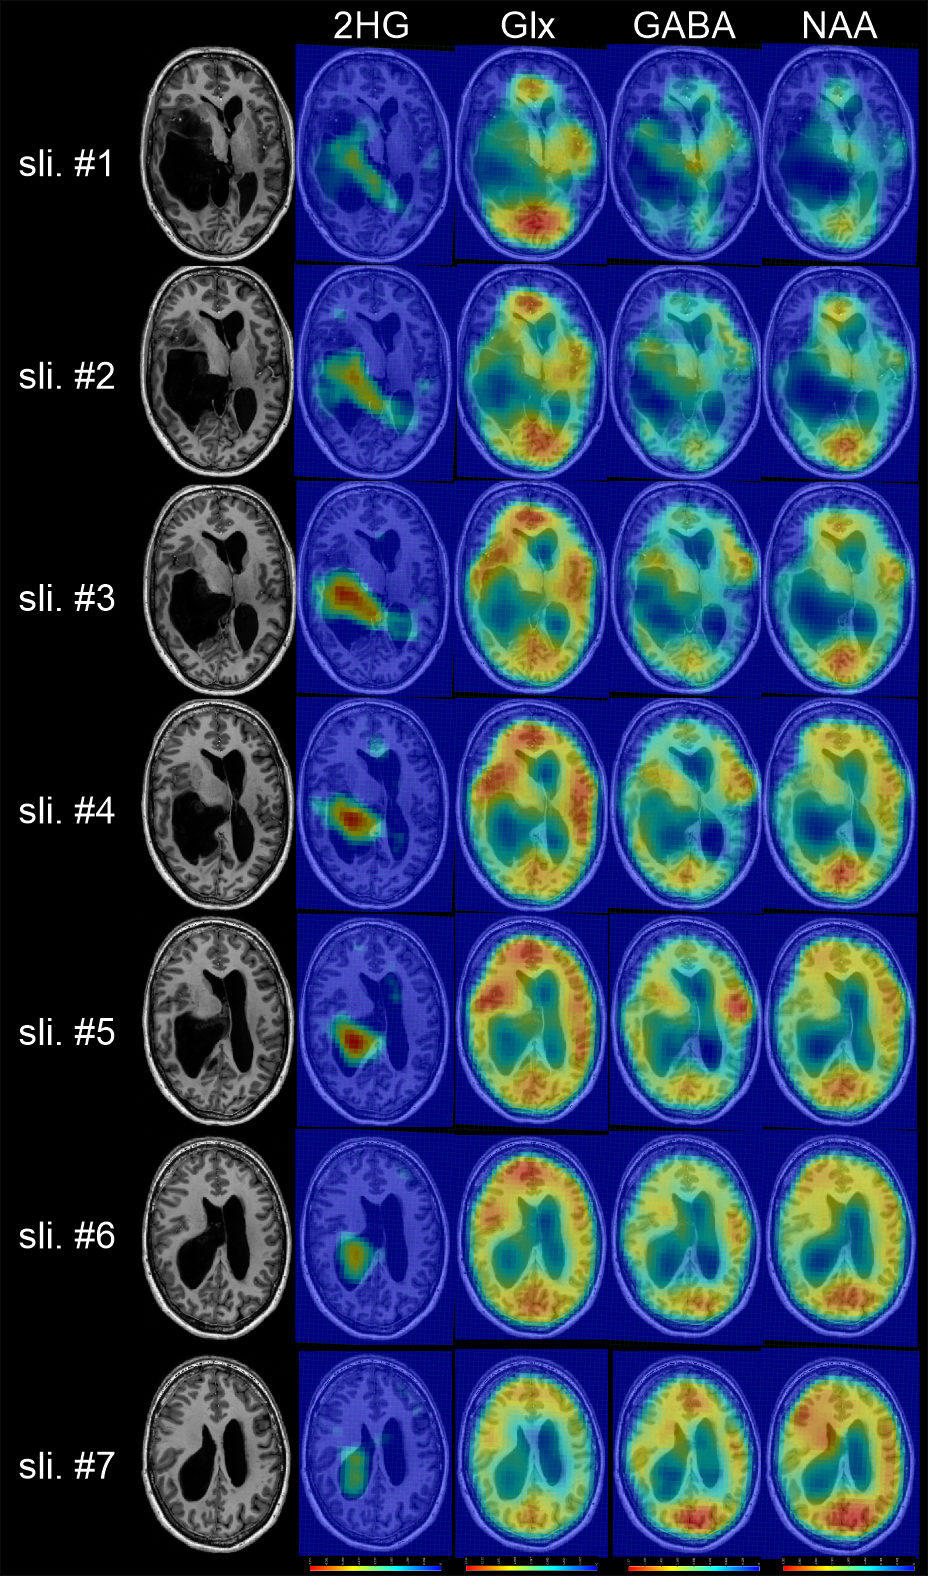
Figure 5: Upfield and spectral editing MRSI of a glioma patient (subject #3). A 7×7×3 moving mean filter was applied. TA = 9:04 min with nominal resolution = 4.3×7.8×6.1 mm.