0255
Imaging brain metabolic alterations of multiple sclerosis using fast high-resolution 3D-CRT-MRSI at 7T1High Field MR Centre, Department of Biomedical Imaging and Image-guided Therapy, Medical University of Vienna, Vienna, Austria, 2Christian Doppler Laboratory for MR Imaging Biomarkers (BIOMAK), Department of Biomedical Imaging and Image-guided Therapy, Medical University of Vienna, Vienna, Austria, 3Department of Neurology, Medical University of Vienna, Vienna, Austria, 4Department of Neurosurgery, Medical University of Vienna, Vienna, Austria
Synopsis
Keywords: Multiple Sclerosis, Brain, MR Spectroscopic Imaging
Motivation: MR spectroscopy offers biomarkers like myo-inositol and N-acetylasparate that can better predict disability progression and clinical status in multiple sclerosis. However, traditional MR spectroscopic imaging faces challenges like limited resolution and lengthy acquisition times, hampering its clinical utility.
Goal(s): This study aimed to assess a novel 7T 3D-concentric-ring-trajectory-readout MRSI, addressing these limitations, for reliable metabolic marker imaging in MS.
Approach: Metabolic images were obtained from 26 MS patients and compared with 13 healthy controls.
Results: Altered brain metabolism in MS was effectively visualized across a large brain volume, revealing significant differences in metabolite levels within normal-appearing white matter.
Impact: We showcase extensive, high-resolution brain metabolic mapping of multiple sclerosis within a clinically viable timeframe. This can enhance disease monitoring and improve the assessment of treatment effectiveness.
Introduction
MRI has been indispensable in diagnosing and monitoring multiple sclerosis (MS), primarily by detecting brain and spinal cord lesions. Yet, clinical symptoms often diverge from lesion severity. Factors like inflammation and axonal damage outside demyelinating lesions play vital role in the clinical presentation and progression of MS. MR Spectroscopy offers unique insights into the metabolic aspects of the disease and identifies additional biomarkers such as myo-inositol to N-acetylaspartate ratio (mI/NAA), offering better correlation with clinical status and disability progression1,2. Longitudinal monitoring of these biomarkers can enhance assessment of disease activity and treatment effectiveness. However, MR spectroscopic imaging (MRSI) typically faces limitations in spatial coverage, resolution, or acquisition times.This study explores a novel 3D-MRSI approach with fast, high-resolution, concentric ring readout (CRT) acquisition at 7T3, aiming to reliably map metabolic abnormalities in MS within white matter lesions and normal-appearing white matter (NAWM) across an extended brain volume.
Methods
In this IRB approved study, we included 26 participants with relapsing-remitting MS (RRMS) (8M/18F; mean age: 35.2±6.6 years) with mild to moderate disability and 13 age- and sex- matched healthy controls (4M/9F; 34±6.7 years). The 7T (Terra dot Plus, Siemens) MRI protocol included 3D-T1w-MP2RAGE and T2w-FLAIR MRI for anatomical reference and visualization of WM lesions and 3D-CRT-MRSI3 with the following parameters: acquisition delay/TR 1.3/320ms, FOV 220×220×133mm3; acquisition matrix 64×64×33; nominal voxel volume 3.4×3.4×4mm3; flip angle 34°; spectral bandwidth 2778 Hz; optimized WET water suppression; three variable temporal interleaves and acquisition time of 8:20 min. The volume of interest was positioned automatically using Autoalign® (to ensure reproducible position among the study participants) parallel to corpus callosum and covering almost the whole cerebrum.MRSI data were processed offline with an in-house developed software pipeline4 utilizing Matlab and Bash including coil combination, k-space data reconstruction, spatial hamming filtering, lipid signal removal via L2-regularization, LCModel spectral fitting in 1.8-3.88 ppm range and visualization with Minc. Mean metabolic ratios were calculated from voxels with minimum content of WM of 90% (based on FAST of FSL) and excluding WM lesions. Spectral quality and quality of LCModel fit was assessed with signal-to-noise ratio (SNR) of fitted NAA peak and Cramér-Rao lower bounds (CRLB). Data comparison between study groups was performed with Mann-Whitney-U-test and Holm-Bonferroni correction for multiple comparisons.
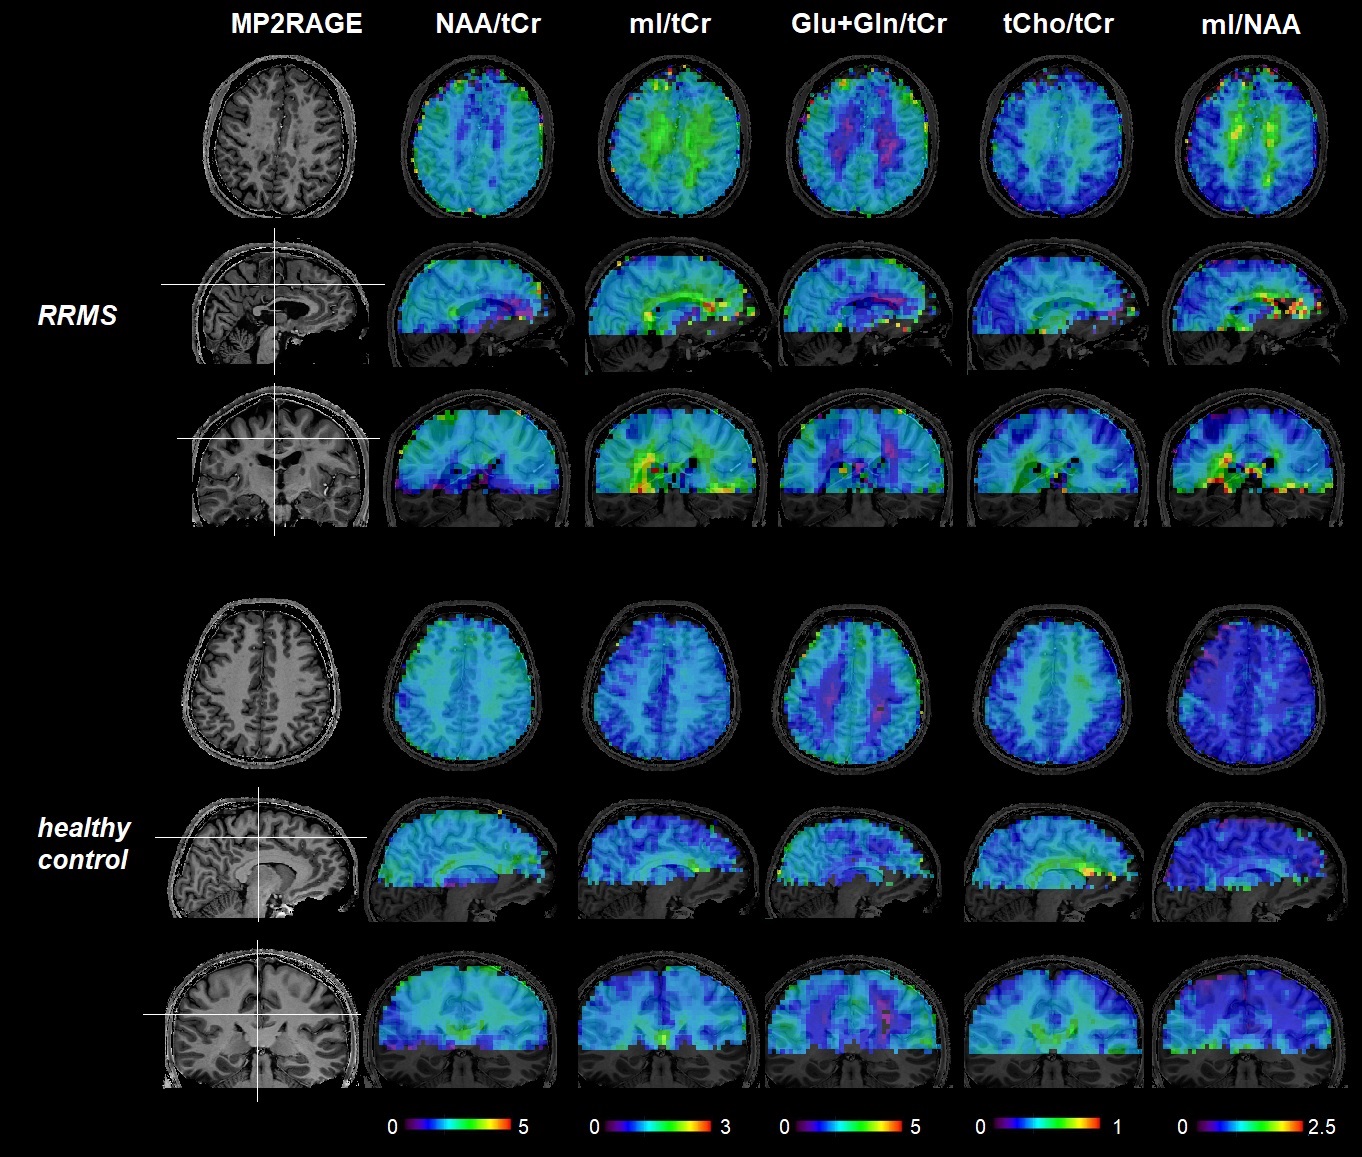
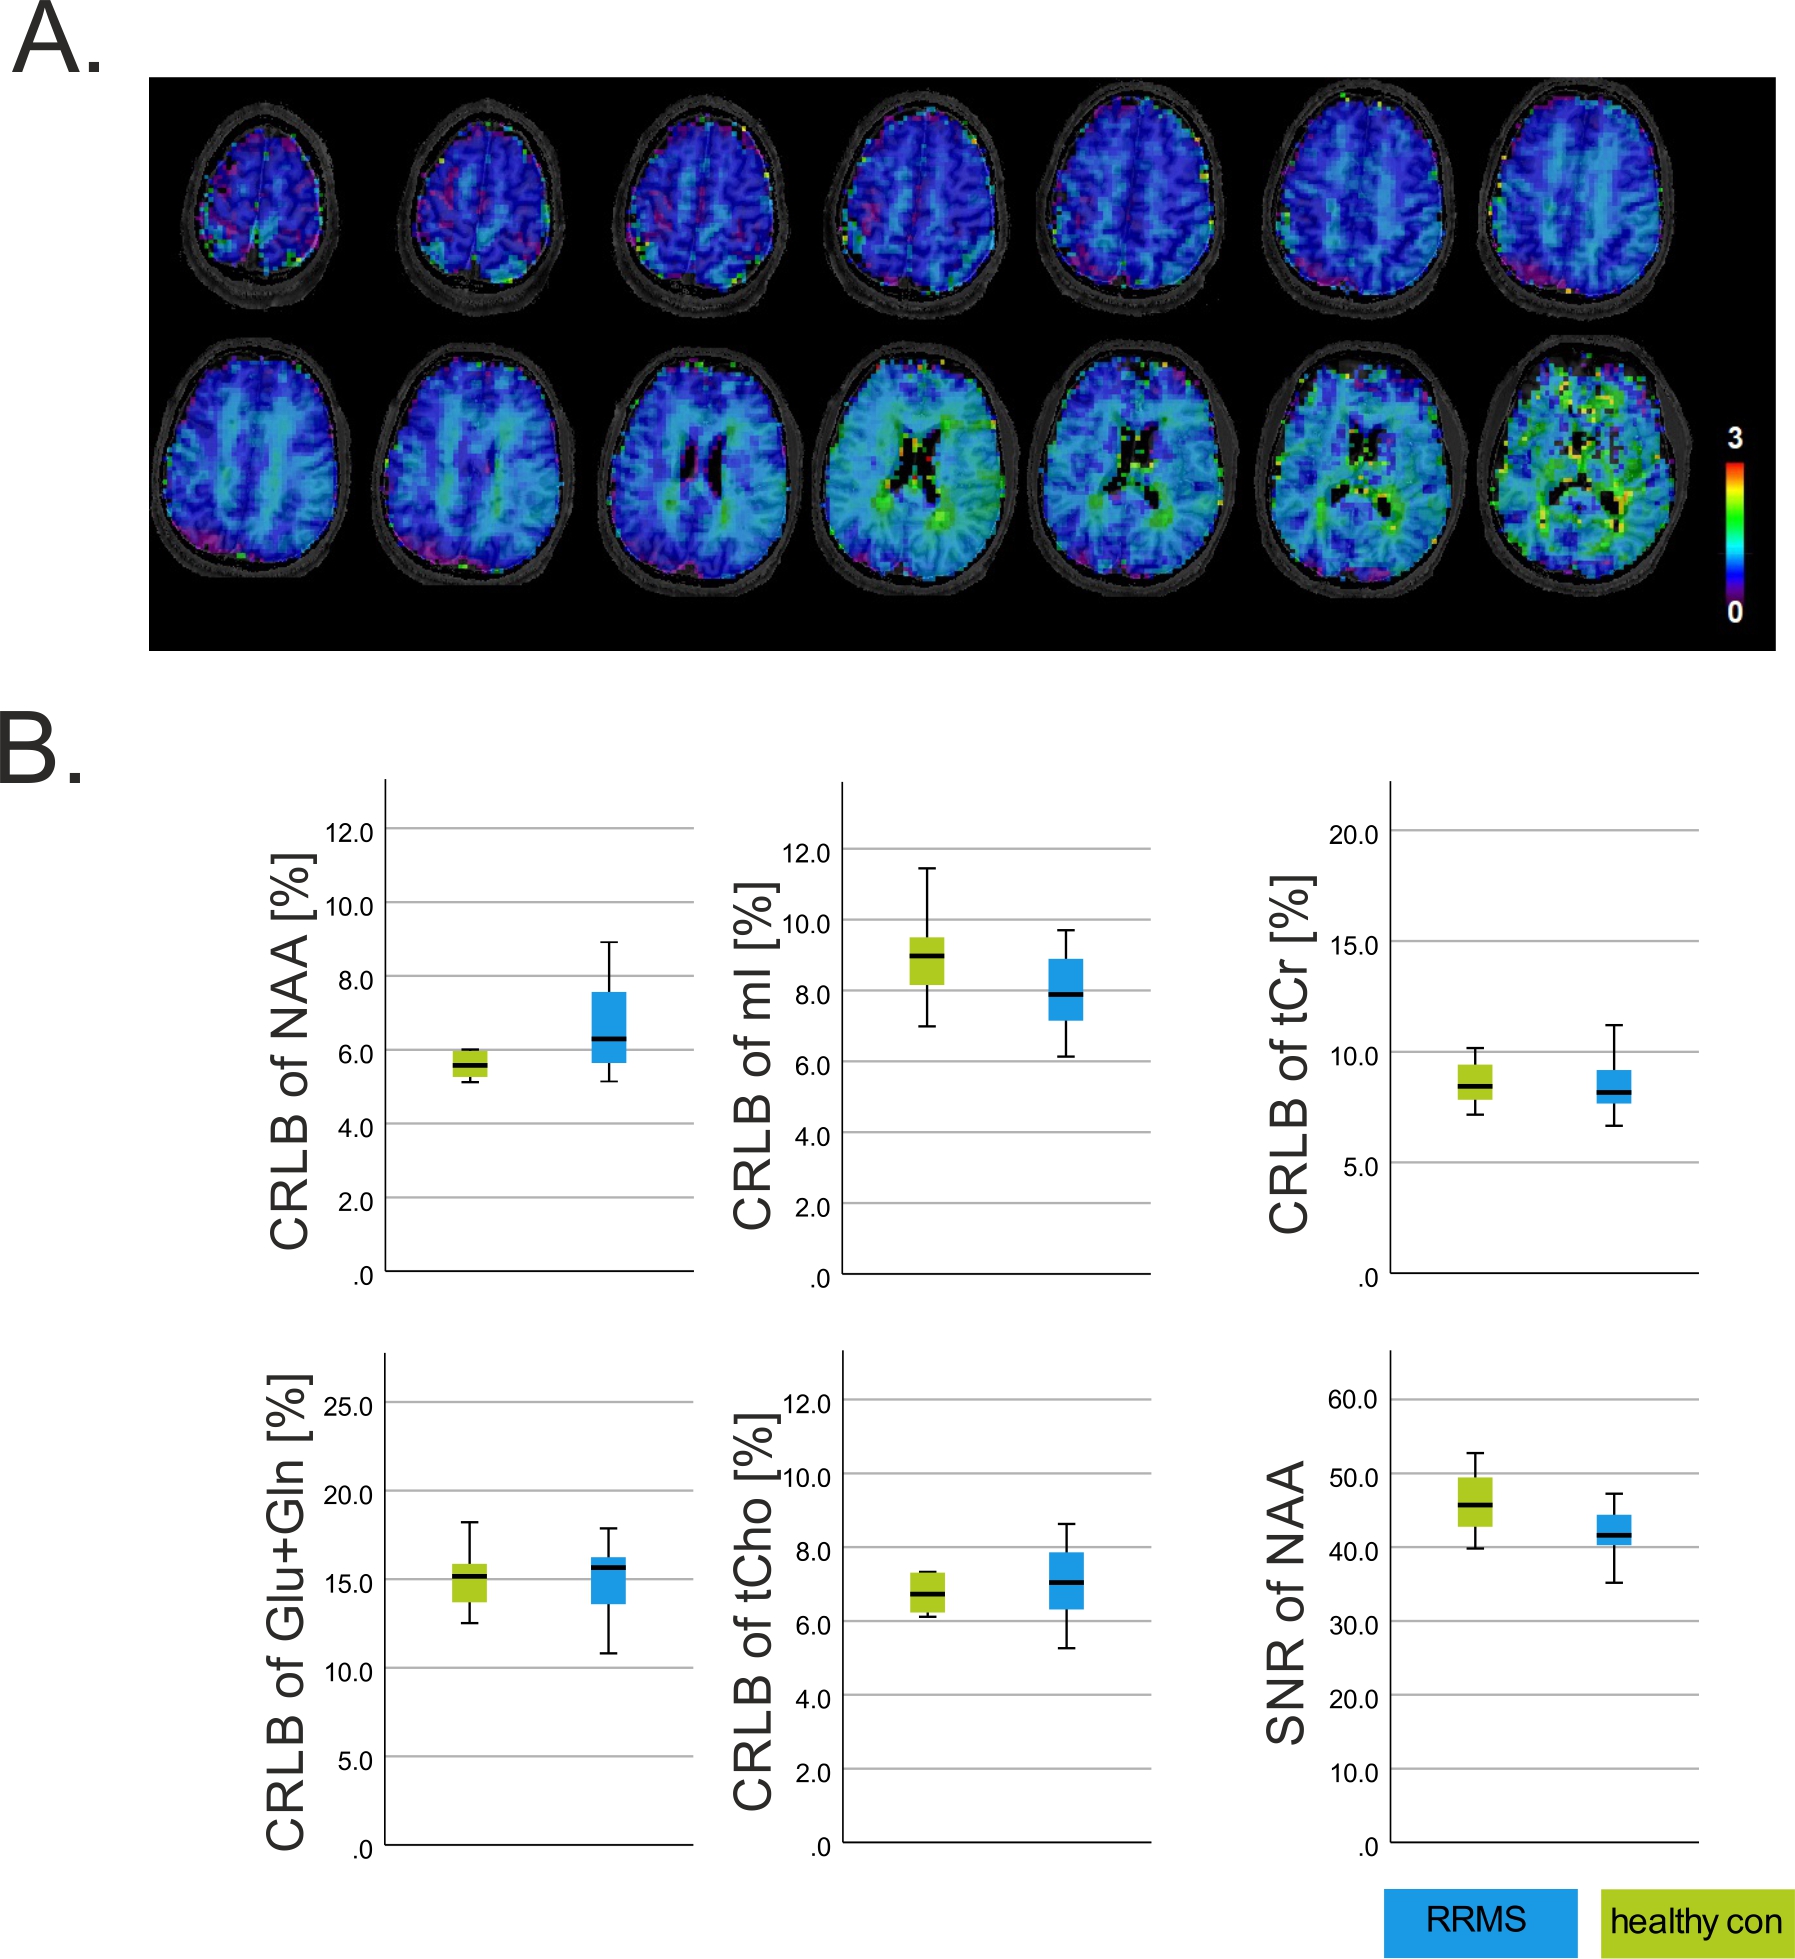
Results
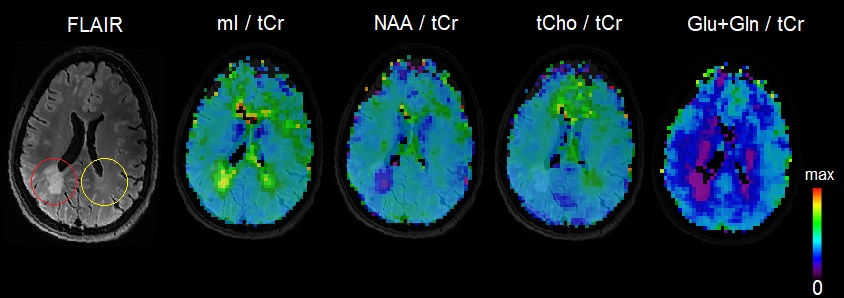
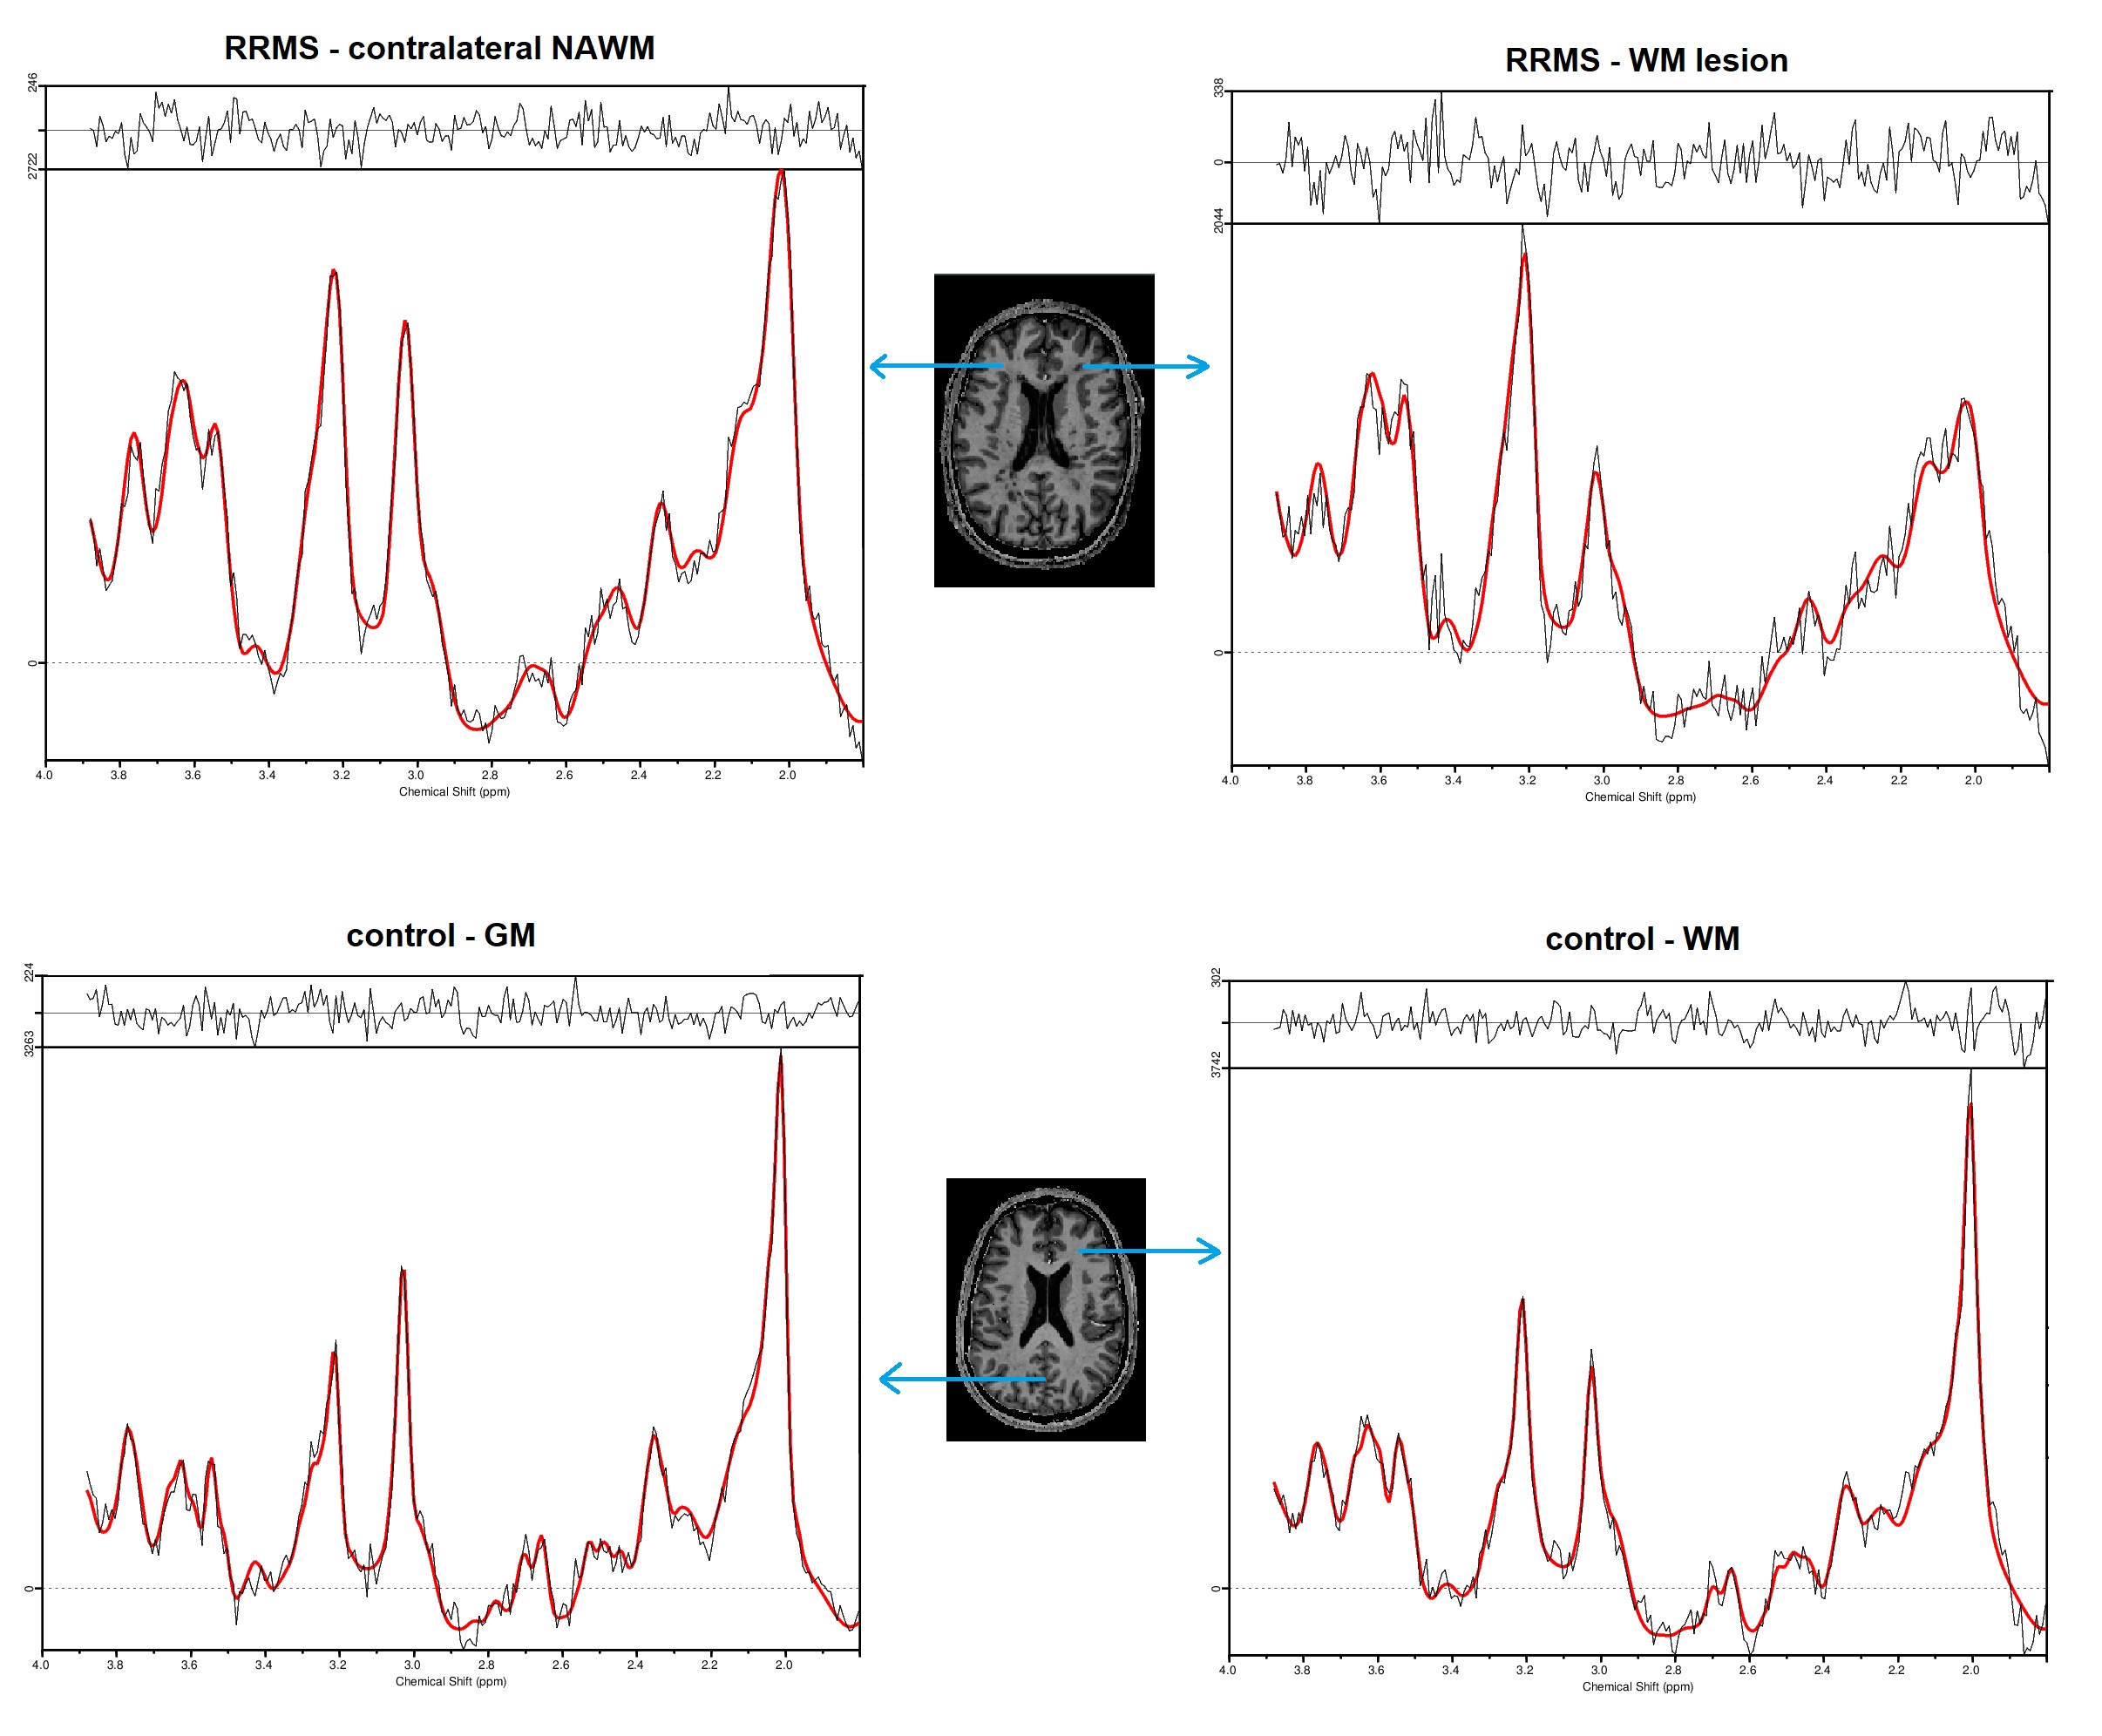
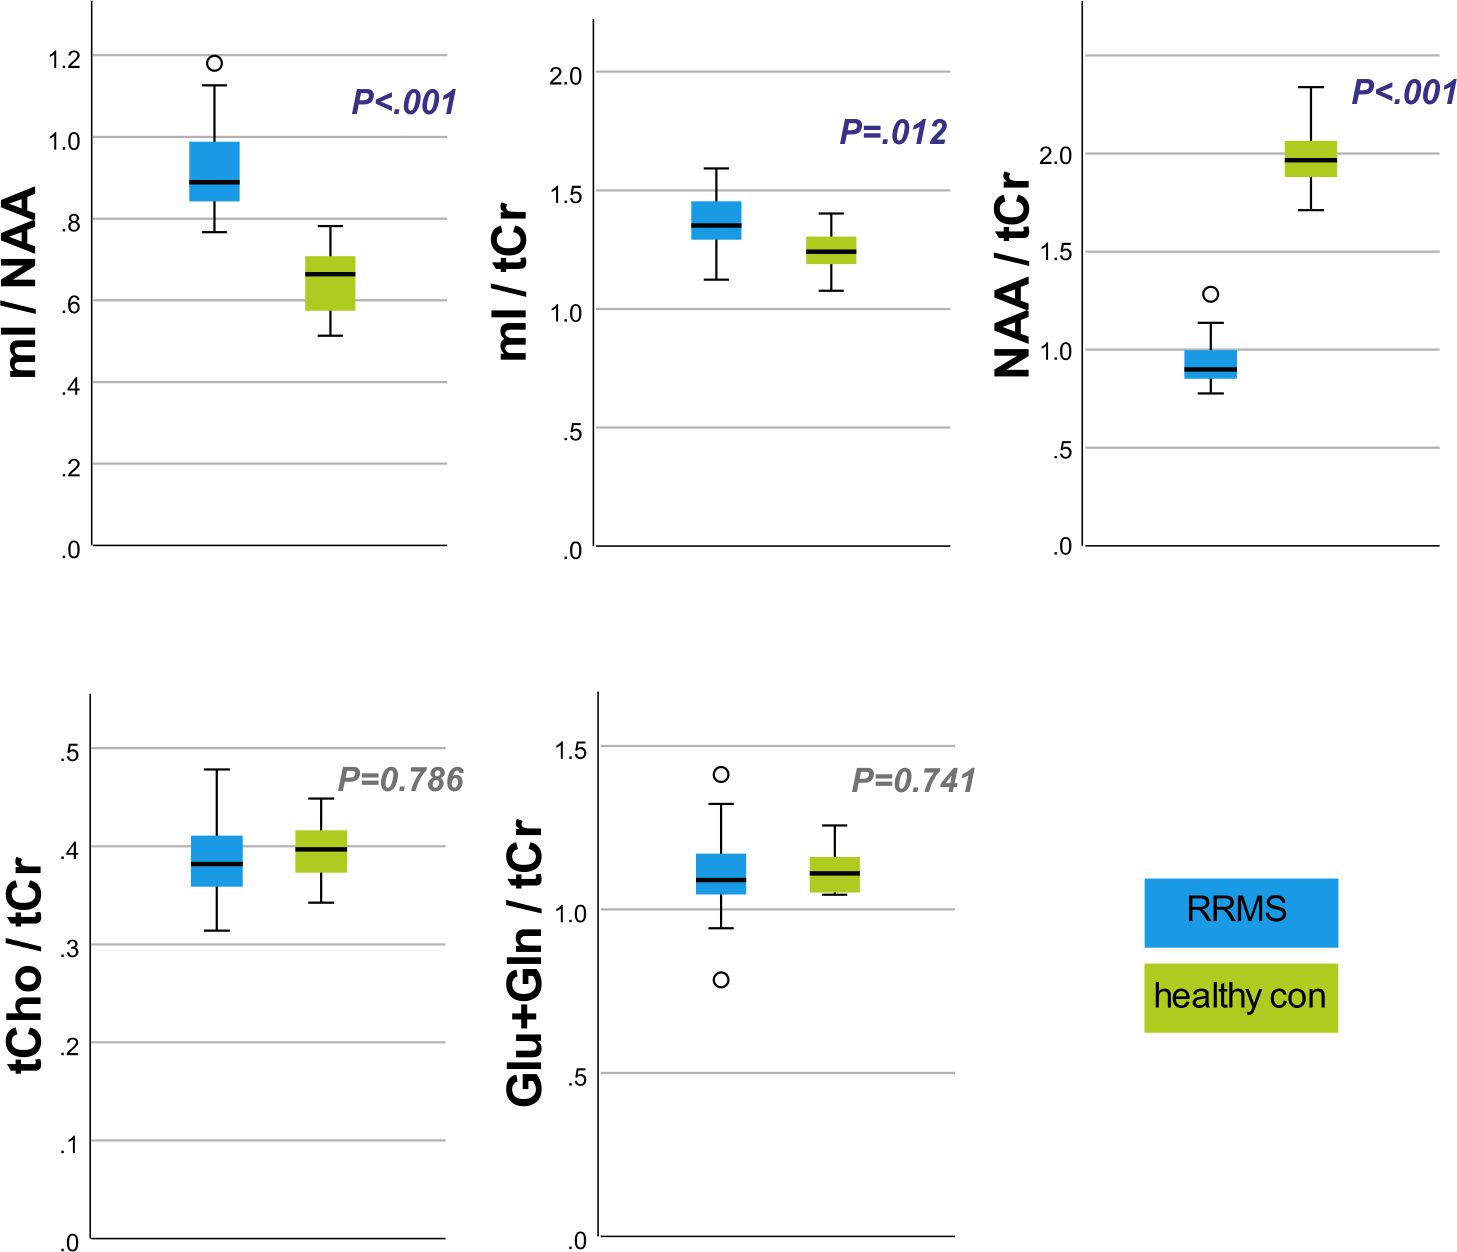
Three-dimensional metabolic images of N-acetylaspartate (NAA), myo-inositol (mI), total creatine (tCr), glutamate+glutamine (Glu+Gln) and total choline (tCho) (Figure 1) were obtained with high spectral quality (SNR of NAA>35 on average for every study participant), precision of fit (CRLB<18% on average for every study participant) and almost over the whole cerebrum leaving out only the lowest parts of frontal, occipital and temporal lobes (Figure 2).In the RRMS group, widespread metabolic abnormalities were revealed in WM lesions (mainly higher mI and lower NAA) as well as in NAWM, especially in periventricular and deep WM areas (Figure 3; sample spectra in Figure 4). We observed +30% higher mI/tNAA (0.64±0.09 vs. 0.83±0.12; P<.001); +10% higher mI/tCr (1.23±0.10 vs. 1.37±0.11; P=.012) and -58% lower NAA/tCr (1.98±0.18 vs. 0.83±0.12; P<.001) within NAWM of RRMS relative to WM of controls. There were no differences observed in tCho/tCr (P=.786) or Glu+Gln/tCr (P=.741) related to MS pathology (Figure 5).
Discussion
Our study successfully visualized altered brain metabolism associated with MS across a large brain volume using 3D-CRT-MRSI. Despite a slightly larger voxel volume (0.046 cm3) compared to our previous 2D-MRSI study1(0.039 cm3), we extended brain coverage significantly (from 8 mm to 60 mm) without substantial acquisition time increase (8:20 min for 3D-MRSI vs. 6 min for single-slice 2D-MRSI), owing to rapid CRT encoding. This enabled precise mapping of elevated mI levels, linked to glial proliferation and inflammation in MS, within and beyond WM lesions. Notably, these changes were predominantly located in the periventricular NAWM, consistent with earlier reports5.Metabolic ratio differences, especially the reduction in NAA/tCr, were more pronounced compared to our earlier 2D-MRSI study. This could be because these alterations surfaced in regions previously unexplored by single-slice MRSI. Additionally, the variation could be also attributed to differences in the study cohorts; as 9/26 MS participants were untreated at the time of scanning.
Our next objective is to conduct voxel-based analysis to statistically map brain regions where metabolic changes occur in MS, identifying preferential locations of these alterations and exploring their correlations with clinical deficits.
Conclusion
Our study showcases noninvasive high-resolution mapping of MS-related metabolic abnormalities across a larger brain volume in just 8 minutes using 3D-CRT-MRSI. Further studies are needed to fully evaluate its potential for advanced monitoring of disease progression and treatment effectiveness.Acknowledgements
The financial support by the Austrian Federal Ministry for Digital and Economic Affairs, the National Foundation for Research, Technology and Development and the Christian Doppler Research Association is gratefully acknowledged.References
- Heckova E, et al. Extensive Brain Pathologic Alterations Detected with 7.0-T MR Spectroscopic Imaging Associated with Disability in Multiple Sclerosis. Radiology. 2022
- Llufriu S, et al. Magnetic resonance spectroscopy markers of disease progression in multiple sclerosis. JAMA Neurol. 2014
- Hingerl L, et al. Clinical High-Resolution 3D-MR Spectroscopic Imaging of the Human Brain at 7T. Invest Radiol. 2020
- Povazan M, et al. Automated routine for MRSI data processing. In Proceedings 2nd TRANSACT Meeting–Quality Issues in Clinical MR Spectroscopy. 2014
- Donadieu M, et al. Metabolic voxel-based analysis of the complete human brain using fast 3D-MRSI: Proof of concept in multiple sclerosis. J. Magn. Reson. Imaging. 2016
Figures