0254
Multilayer Metabolic Networks of Mesial Temporal Lobe Epilepsy: Insights from Simultaneous PET/MRSI1School of Biomedical Engineering, Shanghai Jiao Tong University, Shanghai, China, 2Department of Nuclear Medicine, Ruijin Hospital, Shanghai Jiao Tong University School of Medicine, Shanghai, China, 3Department of Electrical and Computer Engineering, University of Illinois at Urbana Champaign, Urbana, IL, United States, 4Beckman Institute for Advanced Sciences and Technology, University of Illinois at Urbana Champaign, Urbana, IL, United States, 5National Center for Supercomputing Applications, University of Illinois at Urbana Champaign, Urbana, IL, United States
Synopsis
Keywords: Epilepsy, Metabolism, PET/MR
Motivation: How chronic epilepsy impacts the interplay between neuronal metabolites and inter-regional metabolic connectivity remains unclear.
Goal(s): To identify neurometabolic imaging biomarkers for epilepsy progression using PET/MRSI.
Approach: Forty-eight patients with drug-resistant mesial temporal lobe epilepsy and fifteen patients with extratemporal epilepsy underwent simultaneous high-resolution MRSI and FDG PET. Moderation effects of disease duration were evaluated for multiple brain regions; multilayer metabolic networks were constructed to investigate metabolic changes of NAA, FDG and their interplay.
Results: We found disease duration moderated changes in the interplay between NAA and FDG. Metabolic networks form distinct modules in short duration and long duration groups.
Impact: This is the first simultaneous PET/MRSI study to investigate multilayer metabolic network associated with disease duration of mTLE, which could offer a comprehensive view of neurometabolic profile, facilitating the exploration of imaging markers in epileptic lesion detection and disease progression.
Introduction
Epilepsy, characterized by recurrent seizures, significantly impacts neuronal metabolism, increasing energy demands and potentially depleting reserves1. Chronic seizures may lead to mitochondrial dysfunction, affecting energy metabolism in the brain. Epilepsy is also recognized as a "network disease", which involves complex networks that include not only the regions of seizure onset, but those appear to be functionally or structurally connected2. Hybrid PET/MR scanners provide a unique capability for the simultaneous assessment of glucose uptake and intrinsic neuronal metabolites such as NAA3. This study employed high-resolution whole-brain MRSI4 with simultaneous FDG PET to investigate multilayer metabolic network in mesial temporal lobe epilepsy (mTLE), aiming understand the metabolic underpinnings of epilepsy progression.Methods
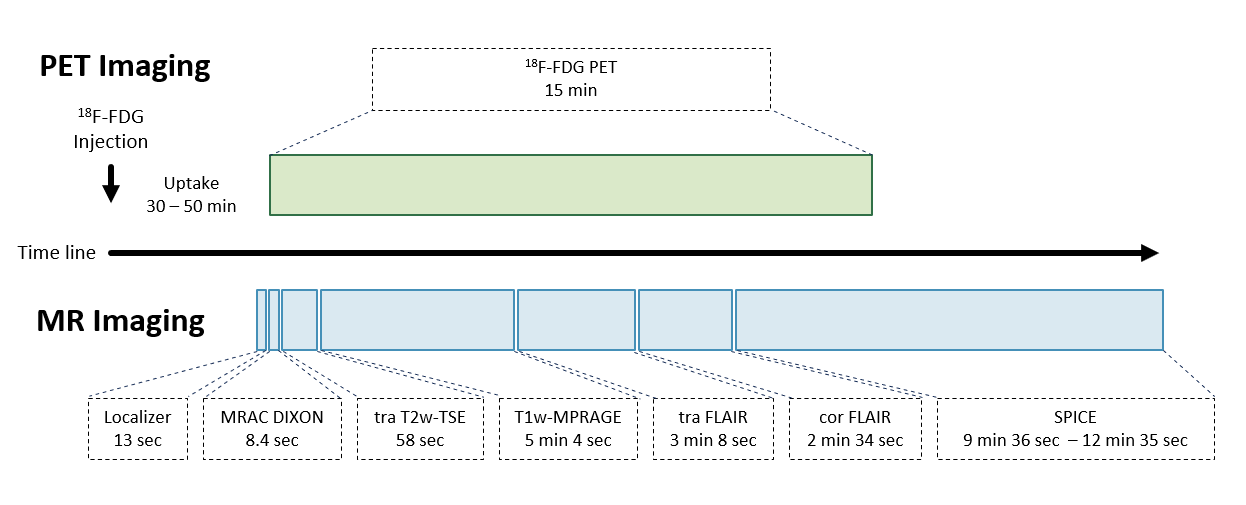
Data acquisition:In this IRB-approved study, Forty-eight drug-resistant mTLE patients (M/F 31/17, age 12–58) underwent MRSI and [18F]FDG PET on integrated 3.0 T hybrid PET/MR system (Biograph mMR; Siemens Healthcare, Erlangen, Germany). The acquisition workflow of PET/MR scan is summarized in Figure 1, patients were monitored and confirmed to have no seizures within 24 hours before the scans. All subjects were required to fast for 4–6 hours before the PET/MR scan, and remain awake with their eyes closed, throughout the scan.
The MR experimental protocols included high-resolution MRSI scans using SPICE5 (2.0 × 3.1 × 2.7 mm3 with FOV=240×240×96 mm3, or 2.0 × 3.1 × 3.8 mm3 with FOV=240×240×160 mm3, TR/TE=160/1.6 ms, 9 minutes or 12 min) and T1-weighted anatomical images using MPRAGE (0.5×0.5×1.0 mm3, TR/TE=1900/2.44 ms, matrix size=256×256, 192 slices). The PET images were obtained at 15 minutes post a bolus injection of [18F]FDG (mean dose of 3.7 MBq/kg, matrix size=344×344, voxel size=2.0×2.0×2.0 mm3, 127 slices).
Data processing and analysis:
Reconstruction of the desired spatiospectral functions from acquired MRSI data was performed using a union-of-subspaces model, incorporating pre-learned spectral basis functions as described in previous publications6-8. Then, spectral quantification was done using an improved LCModel-based algorithm that incorporated both spatial and spectral priors6, which generated concentration maps of NAA, Cho, and Cr. The FDG uptakes (SUVRs) were obtained using intensity normalization by global mean scaling of [18F]FDG PET images, to correct individual variations in global brain metabolism. TLE-related brain regions were parcellated using FreeSurfer image analysis v7.0 package based on the T1-weighted MPRAGE. Mean values of NAA/Cr and FDG uptake were calculated for each ROI, the asymmetry indices (AIs) were defined as AI = (L-R)/(L+R).
Hierarchical moderated multiple regression analysis was carried out to evaluate whether adding the interaction term in either prediction models:
$$$FDG_{AI}=a\times{NAA_{AI}}+b\times{t}+c\times{NAA_{AI}}\times{t}$$$
$$$NAA_{AI}=a^{'}\times{FDG_{AI}}+b^{'}\times{t}+c^{'}\times{FDG_{AI}}\times{t}$$$
where t represents disease duration, increased the variance explained by the model in successive regression steps9. To control for confounds, gender and age were entered as nuisance variables.
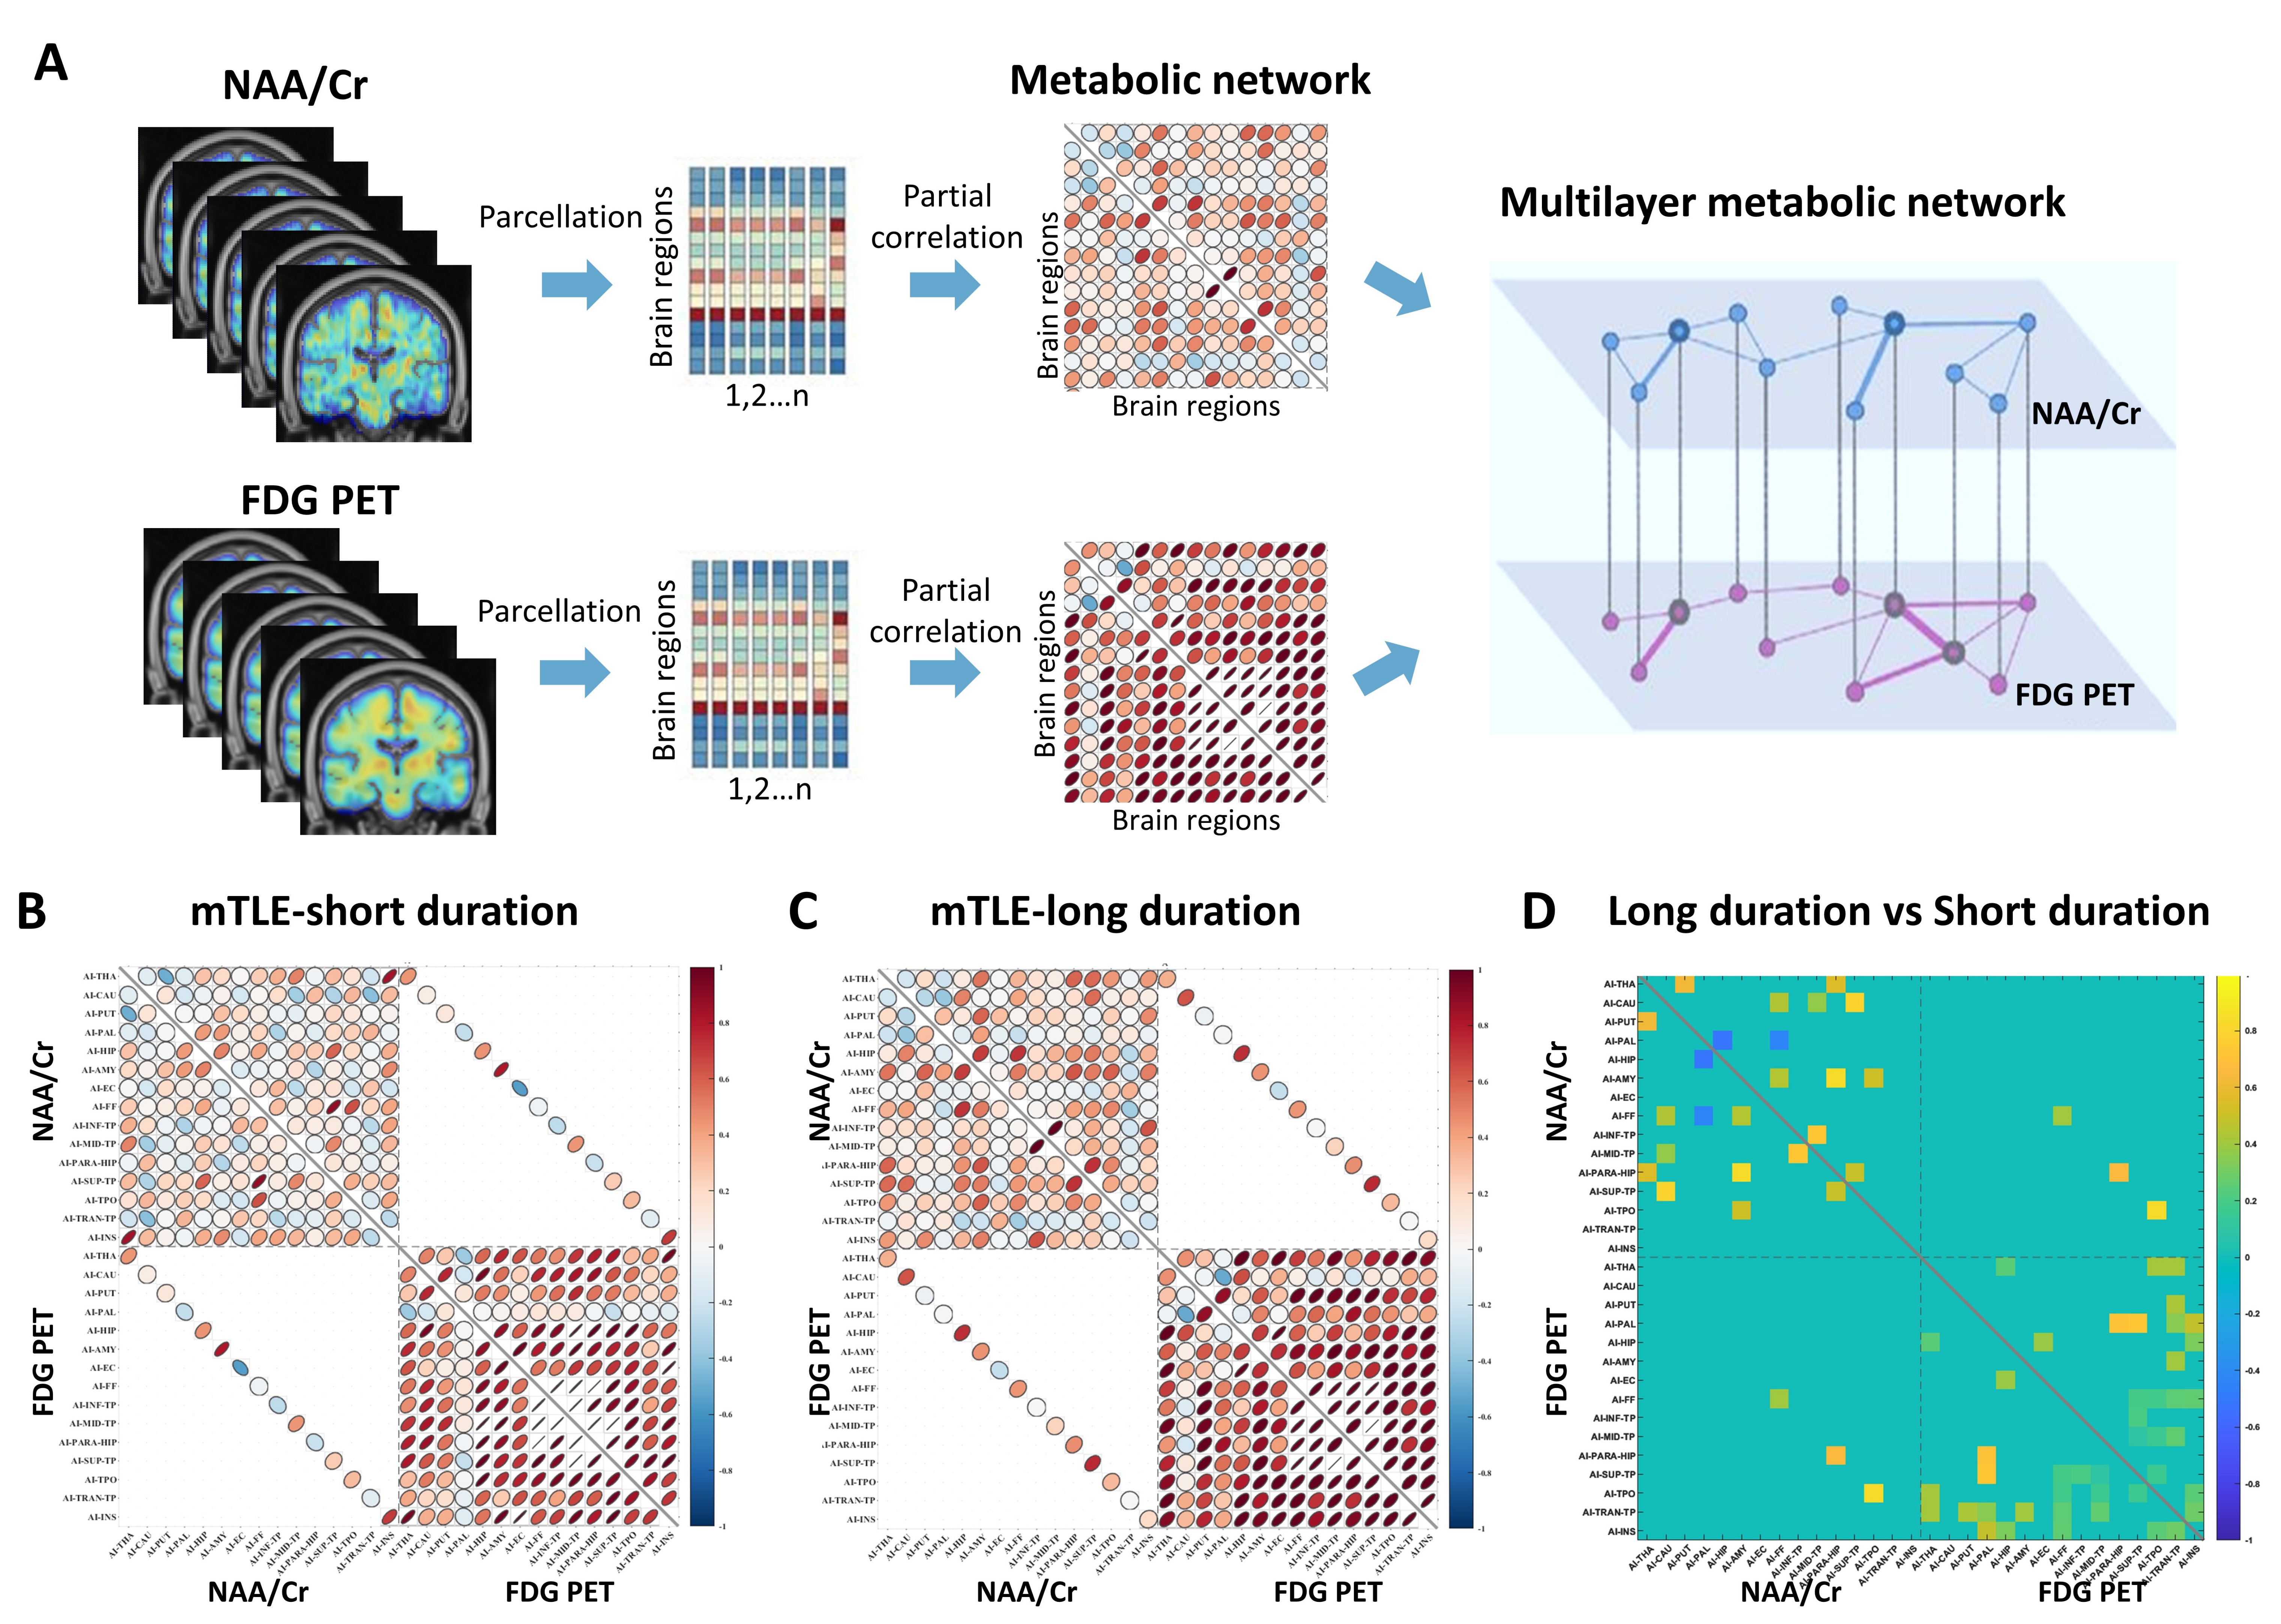
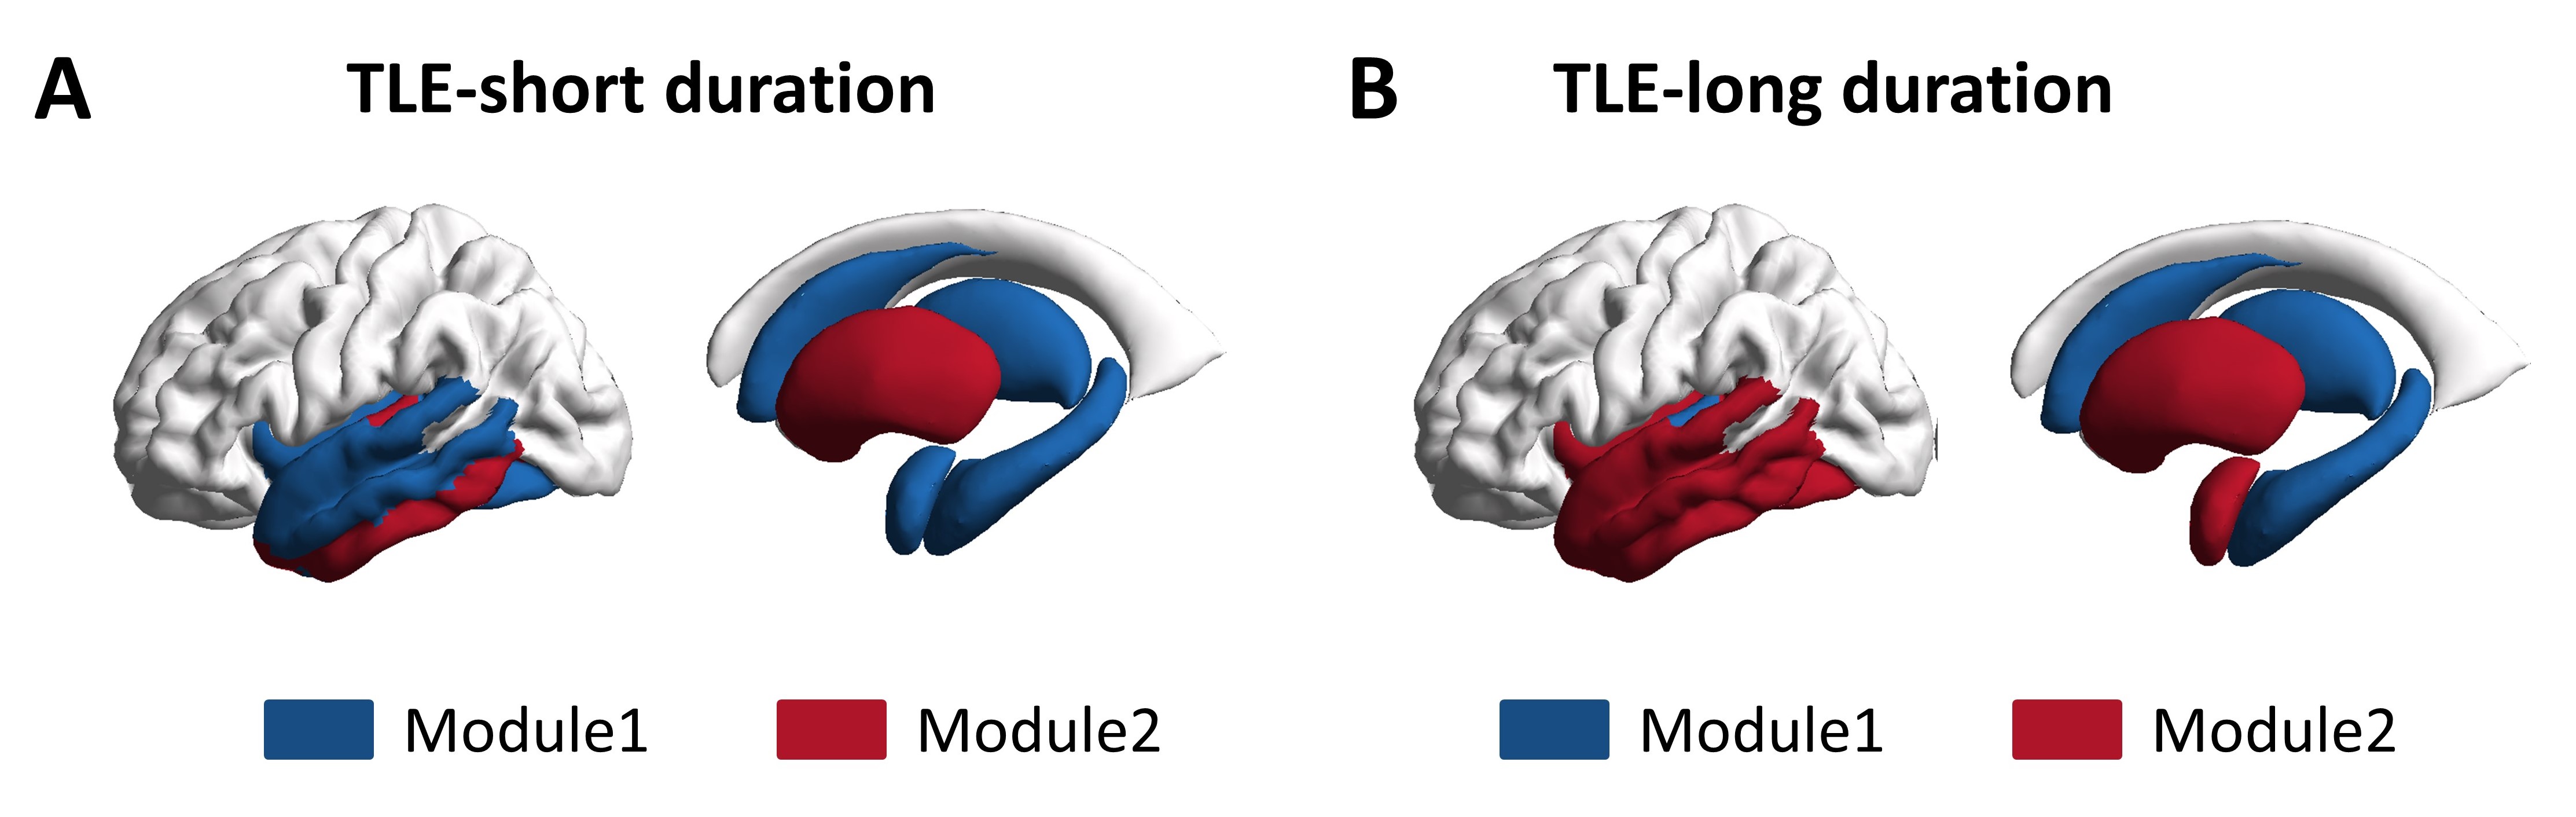
Metabolic networks were constructed with two layers: one with NAA/Cr network and the other with FDG uptake network, where edges were calculated as the partial correlation coefficient between every pair of ROIs using Pearson’s R. The NAA layer and the FDG layer were integrated into a multilayer network10. Differences between patient groups were evaluated using a non-parametric permutation test. The multilayer communities were analyzed to identify multilayer brain modules, defined as groups of nodes that exhibited denser connections within themselves than with the rest of the network.
Results
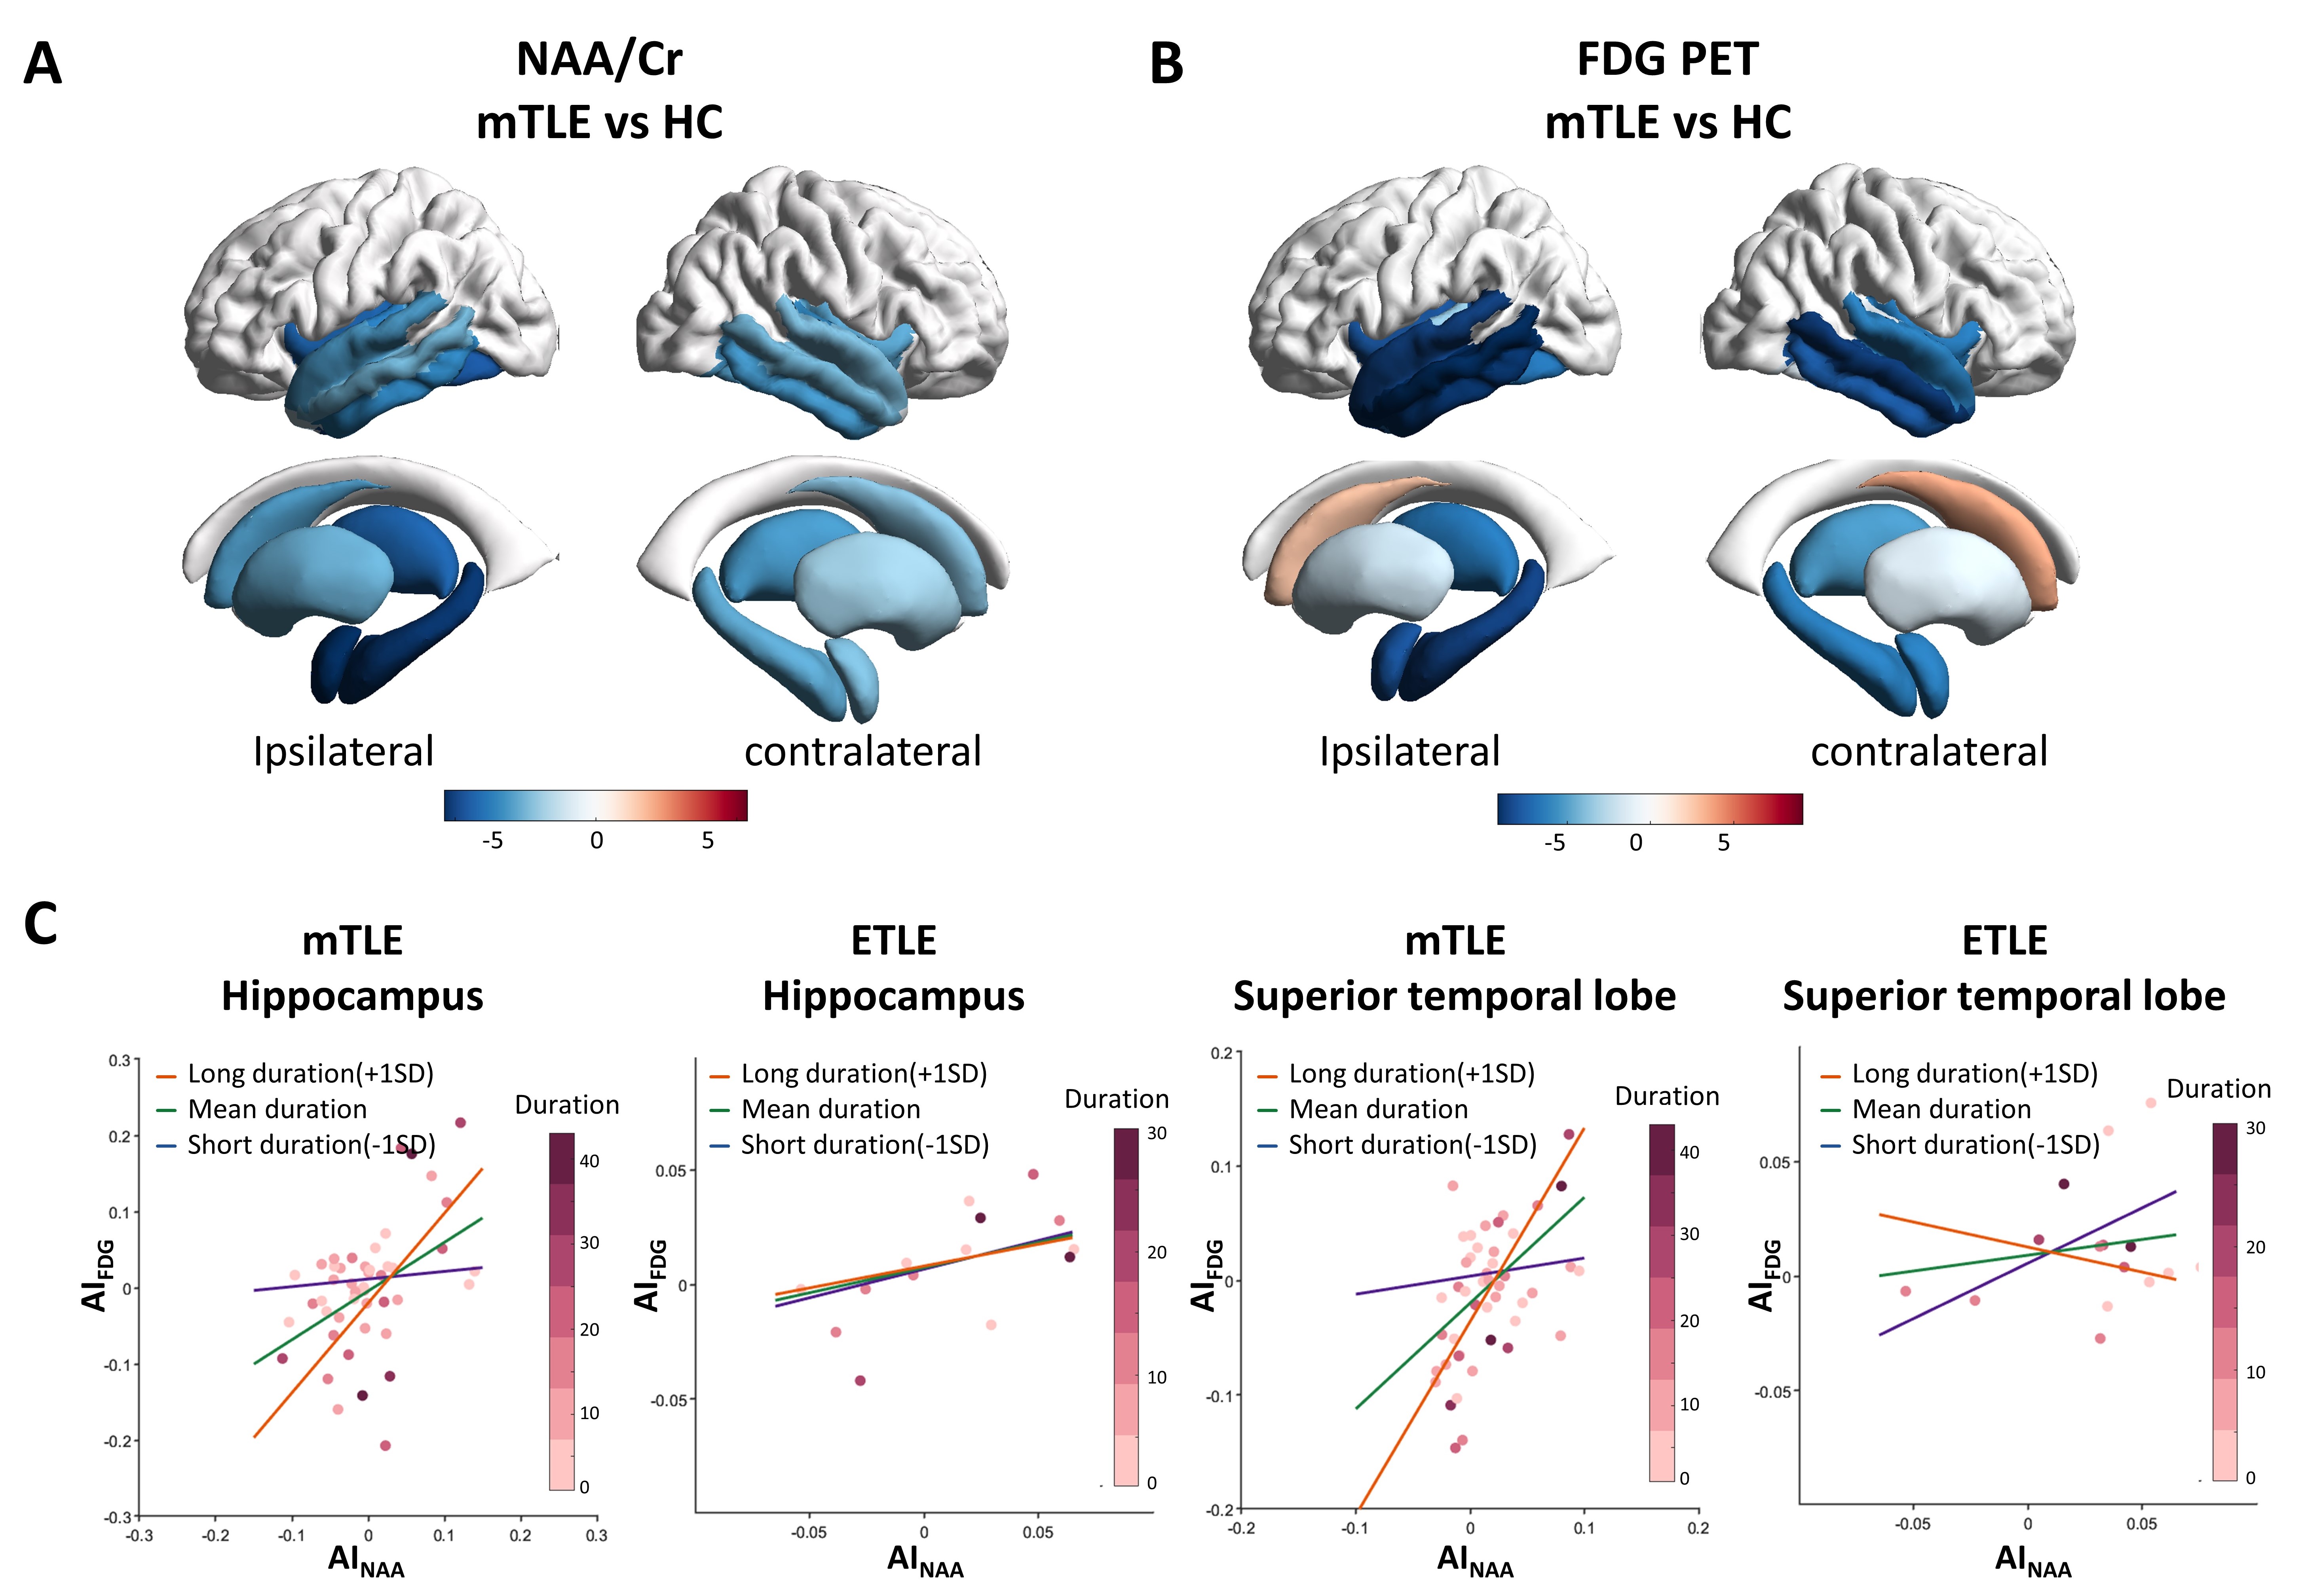
The patient demographics and clinical information are provided in Table 1. Compared to normal controls, hippocampus, amygdala, thalamus, insula, and temporal cortices show significant NAA/Cr reduction and significant FDG uptake reduction in both ipsilateral and contralateral hemisphere (Figure 2A and 2B). Although no significant changes along disease duration were found in NAA/Cr or FDG uptake, we found moderation effect of disease duration in prediction of FDG uptake (Figure 2C). Further, such moderation effect was only found in patients with mTLE, not those with extratemporal epilepsy. Multilayer metabolic networks show distinct inter-regional connections in the NAA matrix and in FDG matrix, as well as intra-regions cross-modal interactions (Figure 3), revealing stronger connectivity in those with longer-duration. Multilayer community analysis identified distinct modules in short and long disease duration groups (Figure 4).Discussion
Current technological limitations precluded tracking fluctuations of FDG or NAA levels at the scale of seconds to minutes. Simultaneous [18F]FDG PET and MRSI of human brain largely eliminate confounding physiological fluctuations11,12, such as serum glucose level, or circadian rhythms cycle, allowing capture of the NAA and glucose uptake under the same pathophysiological status.Conclusion
This study is the first simultaneous PET/MRSI one to investigate the multilayer metabolic network associated with disease duration of mTLE, which could offer a comprehensive view of neurometabolic profile, facilitating the exploration of imaging markers in epileptic lesion detection and disease progression.Acknowledgements
The study was partially supported by the National Natural Science Foundation of China (No. 62101321, and No. 82372073), Shanghai Municipal Health Commission (No. 202240031), and Shanghai Municipal Key Clinical Specialty (shslczdzk03403).References
- Rho, J.M., Boison, D. The metabolic basis of epilepsy. Nat Rev Neurol. 2022 Jun;18(6):333-347
- Royer J, Bernhardt BC, Larivière S, et al. Epilepsy and brain network hubs. Epilepsia. 2022 Mar;63(3):537-550.
- Huang H, Zhang M, Zhao Y, et al., Simultaneous high-resolution whole-brain MR spectroscopy and [18F]FDG PET for temporal lobe epilepsy. Eur J Nuc Med Mol Imag, 2023.
- Lam F, Ma C, Clifford B, Johnson CL, Liang Z-P. High-resolution (1) H-MRSI of the brain using SPICE: data acquisition and image reconstruction. Magn Reson Med. 2016 Oct;76(4):1059-70.
- Guo R, Zhao Y, Li Y, Li Y, Liang Z-P. Simultaneous metabolic and functional imaging of the brain using SPICE. Magn Reson Med. 2019 Dec;82(6):1993-2002.
- Li Y, Lam F, Clifford B, Liang Z-P. A subspace approach to spectral quantification for MR spectroscopic imaging. IEEE Trans Biomed Eng. 2017;64:2486–9.
- Peng X, Lam F, Li Y, Clifford B, Liang Z-P. Simultaneous QSM and metabolic imaging of the brain using SPICE. Magn Reson Med. 2018 Jan;79(1):13-21
- Liang Z-P. Spatiotemporal imaging with partially separable functions. 2007 4th IEEE international symposium on biomedical imaging: from nano to macro: IEEE; 2007; 988-91.
- Aguinis H, Gottfredson RK. Best-practice recommendations for estimating interaction effects using moderated multiple regression. J Organ Behav. 2010;31:776–86.
- Canal-Garcia A, Gómez-Ruiz E, Mijalkov M, et al. Alzheimer’s Disease Neuroimaging Initiative. Multiplex Connectome Changes across the Alzheimer's Disease Spectrum Using Gray Matter and Amyloid Data. Cereb Cortex. 2022 Aug 3;32(16):3501-3515.
- van der Veen DR, Shao J, Chapman S, Leevy WM, Duffield GE. A 24-hour temporal profile of in vivo brain and heart pet imaging reveals a nocturnal peak in brain 18F-fluorodeoxyglucose uptake. PLoS One. 2012;7(2):e31792.
- Soreni N, Noseworthy MD, Cormier T, et al. Intraindividual variability of striatal (1)H-MRS brain metabolite measurements at 3 T. Magn Reson Imaging. 2006 Feb;24(2):187-94.
Figures
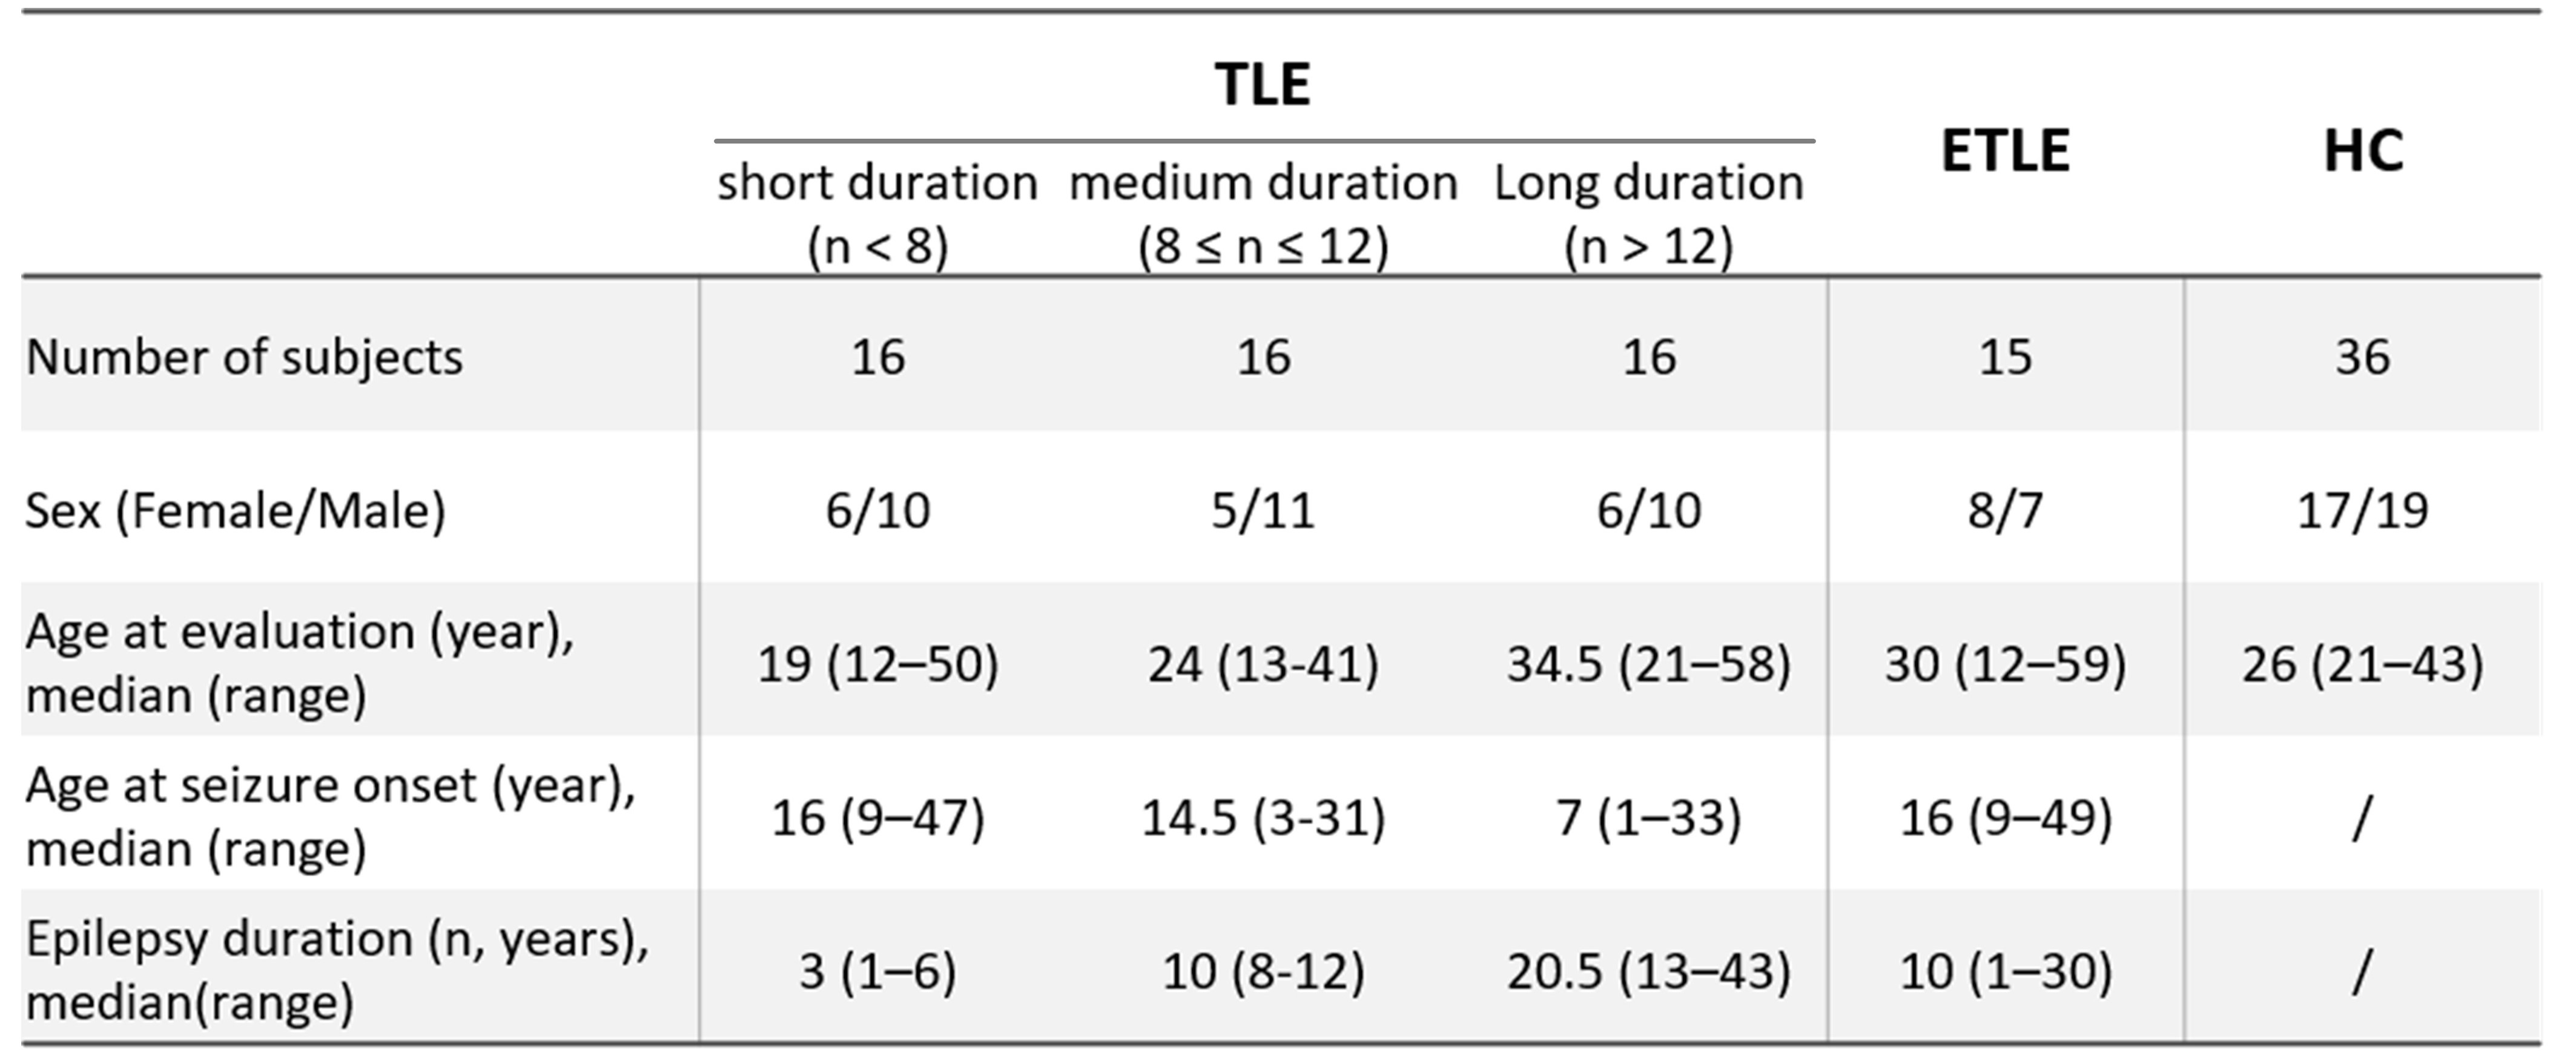
Abbreviations: ETLE, extratemporal lobe epilepsy; HC, healthy control; mTLE, mesial temporal lobe epilepsy