0252
Metabolite-cycling at 14.1T: sequence implementation and initial explorations using SPECIAL and diffusion-weighted SPECIAL1CIBM Center for Biomedical Imaging, Lausanne, Switzerland, 2Animal Imaging and Technology, EPFL, Lausanne, Switzerland, 3Magnetic Resonance Methodology, Institute of Diagnostic and Interventional Neuroradiology, University of Bern, Bern, Switzerland, 4Translational Imaging Center, sitem-insel, Bern, Switzerland
Synopsis
Keywords: Spectroscopy, Brain, MRS, metabolite-cycling, sequence development, SPECIAL, diffusion, DW-MRS, downfield
Motivation: Water suppression leads to saturation of exchanging protons which biases metabolite concentration estimates and prevents the study of downfield resonances in the 1H spectrum.
Goal(s): Apply metabolite-cycling (MC) to study these resonances with high sensitivity using the short-TE, full-intensity SPECIAL sequence at ultra-high field on an animal scanner.
Approach: The MC pulse was optimized for 14.1T. MC SPECIAL and MC diffusion-weighted SPECIAL were implemented and tested in vivo.
Results: Underestimation of specific upfield metabolite concentrations with water-suppressed SPECIAL compared to MC SPECIAL was observed. Downfield resonances attribution was further validated with diffusion-weighted acquisitions, uniquely showing the presence of macromolecules in the 6.5-7.5ppm region.
Impact: The introduction of metabolite-cycling in the short echo-time, full intensity SPECIAL and diffusion-weighted SPECIAL 1H MRS sequences at 14.1T paves the way for in-depth exploration of the downfield resonances of the 1H spectrum with high sensitivity on animal scanners.
Introduction
1H MRS sequences usually employ water suppression techniques such as VAPOR1 to observe upfield metabolites (< 4.7 ppm) 10000 times less concentrated than water. Water suppression (WS) RF pulses lead to indirect saturation of resonances with exchanging protons2 and direct, undesired saturation of resonances close to the water signal at 4.7 ppm. Metabolite-cycling (MC) has been introduced to circumvent these effects by alternatively inverting the upfield and downfield regions of the spectrum without water pre-saturation3. Combined with STEAM and sLASER sequences, MC enabled in-depth exploration of downfield resonances (> 4.7 ppm) of the 1H MRS spectrum3–6.SPECIAL localization7,8 enables short echo-time (TE) acquisitions with full-magnetization, which in turn improves the quantification of short T2 and J-coupled metabolites.
In this work, we combined the semi-adiabatic SPECIAL localization with MC at 14.1T, both in the single-voxel semi-adiabatic SPECIAL sequence and in the recently proposed diffusion-weighted (DW-) SPECIAL sequence9. Doing so, we benefitted from the high sensitivity offered by short TEs and ultra-high magnetic field and aimed at 1) evaluating the bias introduced by WS pulses in the upfield metabolite concentration estimates, and 2) exploring the downfield region of the 1H MRS spectrum both with single-voxel MRS (SVS) and DW-MRS.
Methods
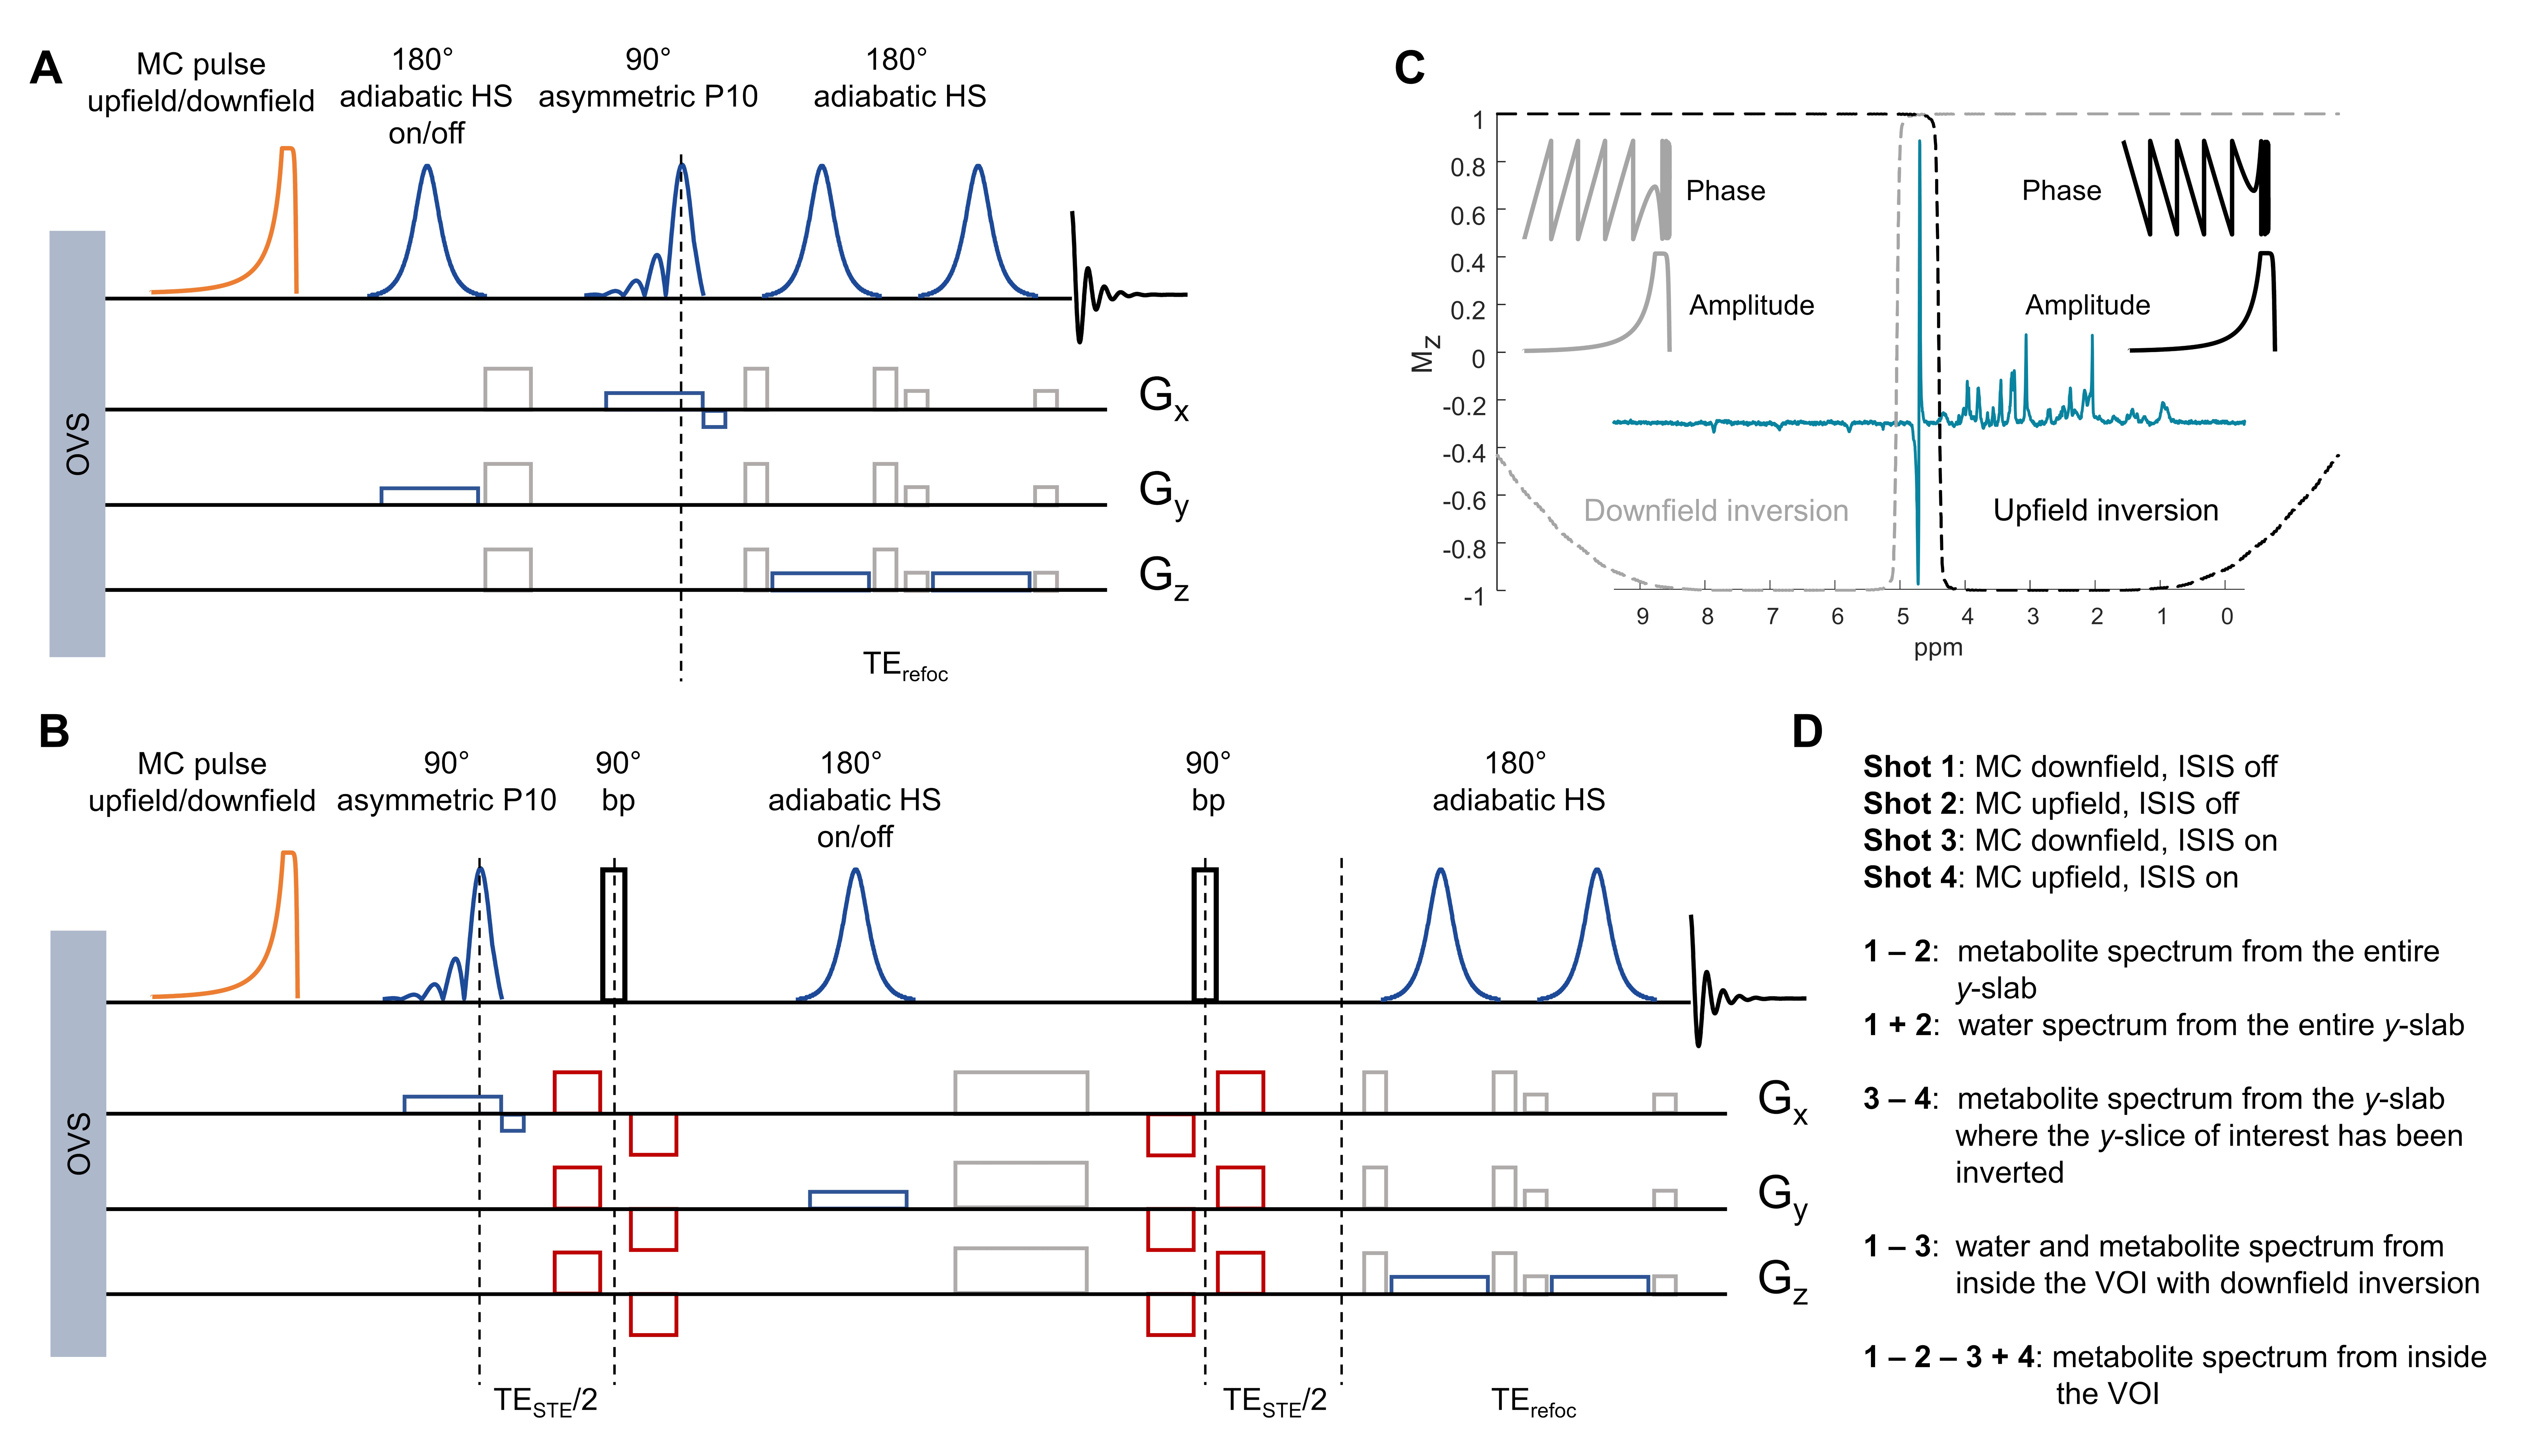
The SPECIAL and DW-SPECIAL sequence diagrams are presented in Fig 1. The MC RF pulse was optimized for 14.1T (Fig 2) and inserted before the first 90° pulse in each sequence. The downfield/upfield inversions are applied consecutively, resulting in a 4-shot sequence (Fig 1D).SVS: N=2 male Wistar rats were scanned with VAPOR WS SPECIAL and with MC SPECIAL to compare upfield resonances quantification (15.6µL voxel, striatum, TE=9.3ms, 256 shots, TR=4s) (Fig 3). N=5 rats were scanned with MC SPECIAL in the same conditions to investigate the downfield region (Fig 4). Spectral registration10 was performed on the water region on each 4 (for MC) or 2 (for WS) subsets of shots individually. The basis set was simulated with NMRScopeB/jMRUI11, the macromolecules (MM) acquired in the striatum with metabolite nulling by double-inversion recovery (TI1/TI2=2200/850ms) and residual metabolites removed12. Metabolite concentrations from WS SPECIAL and MC SPECIAL were referenced to the same separately-acquired water signal and corrected for water (T2 at 14.1T in the striatum: 29ms) versus metabolites T2 relaxation.
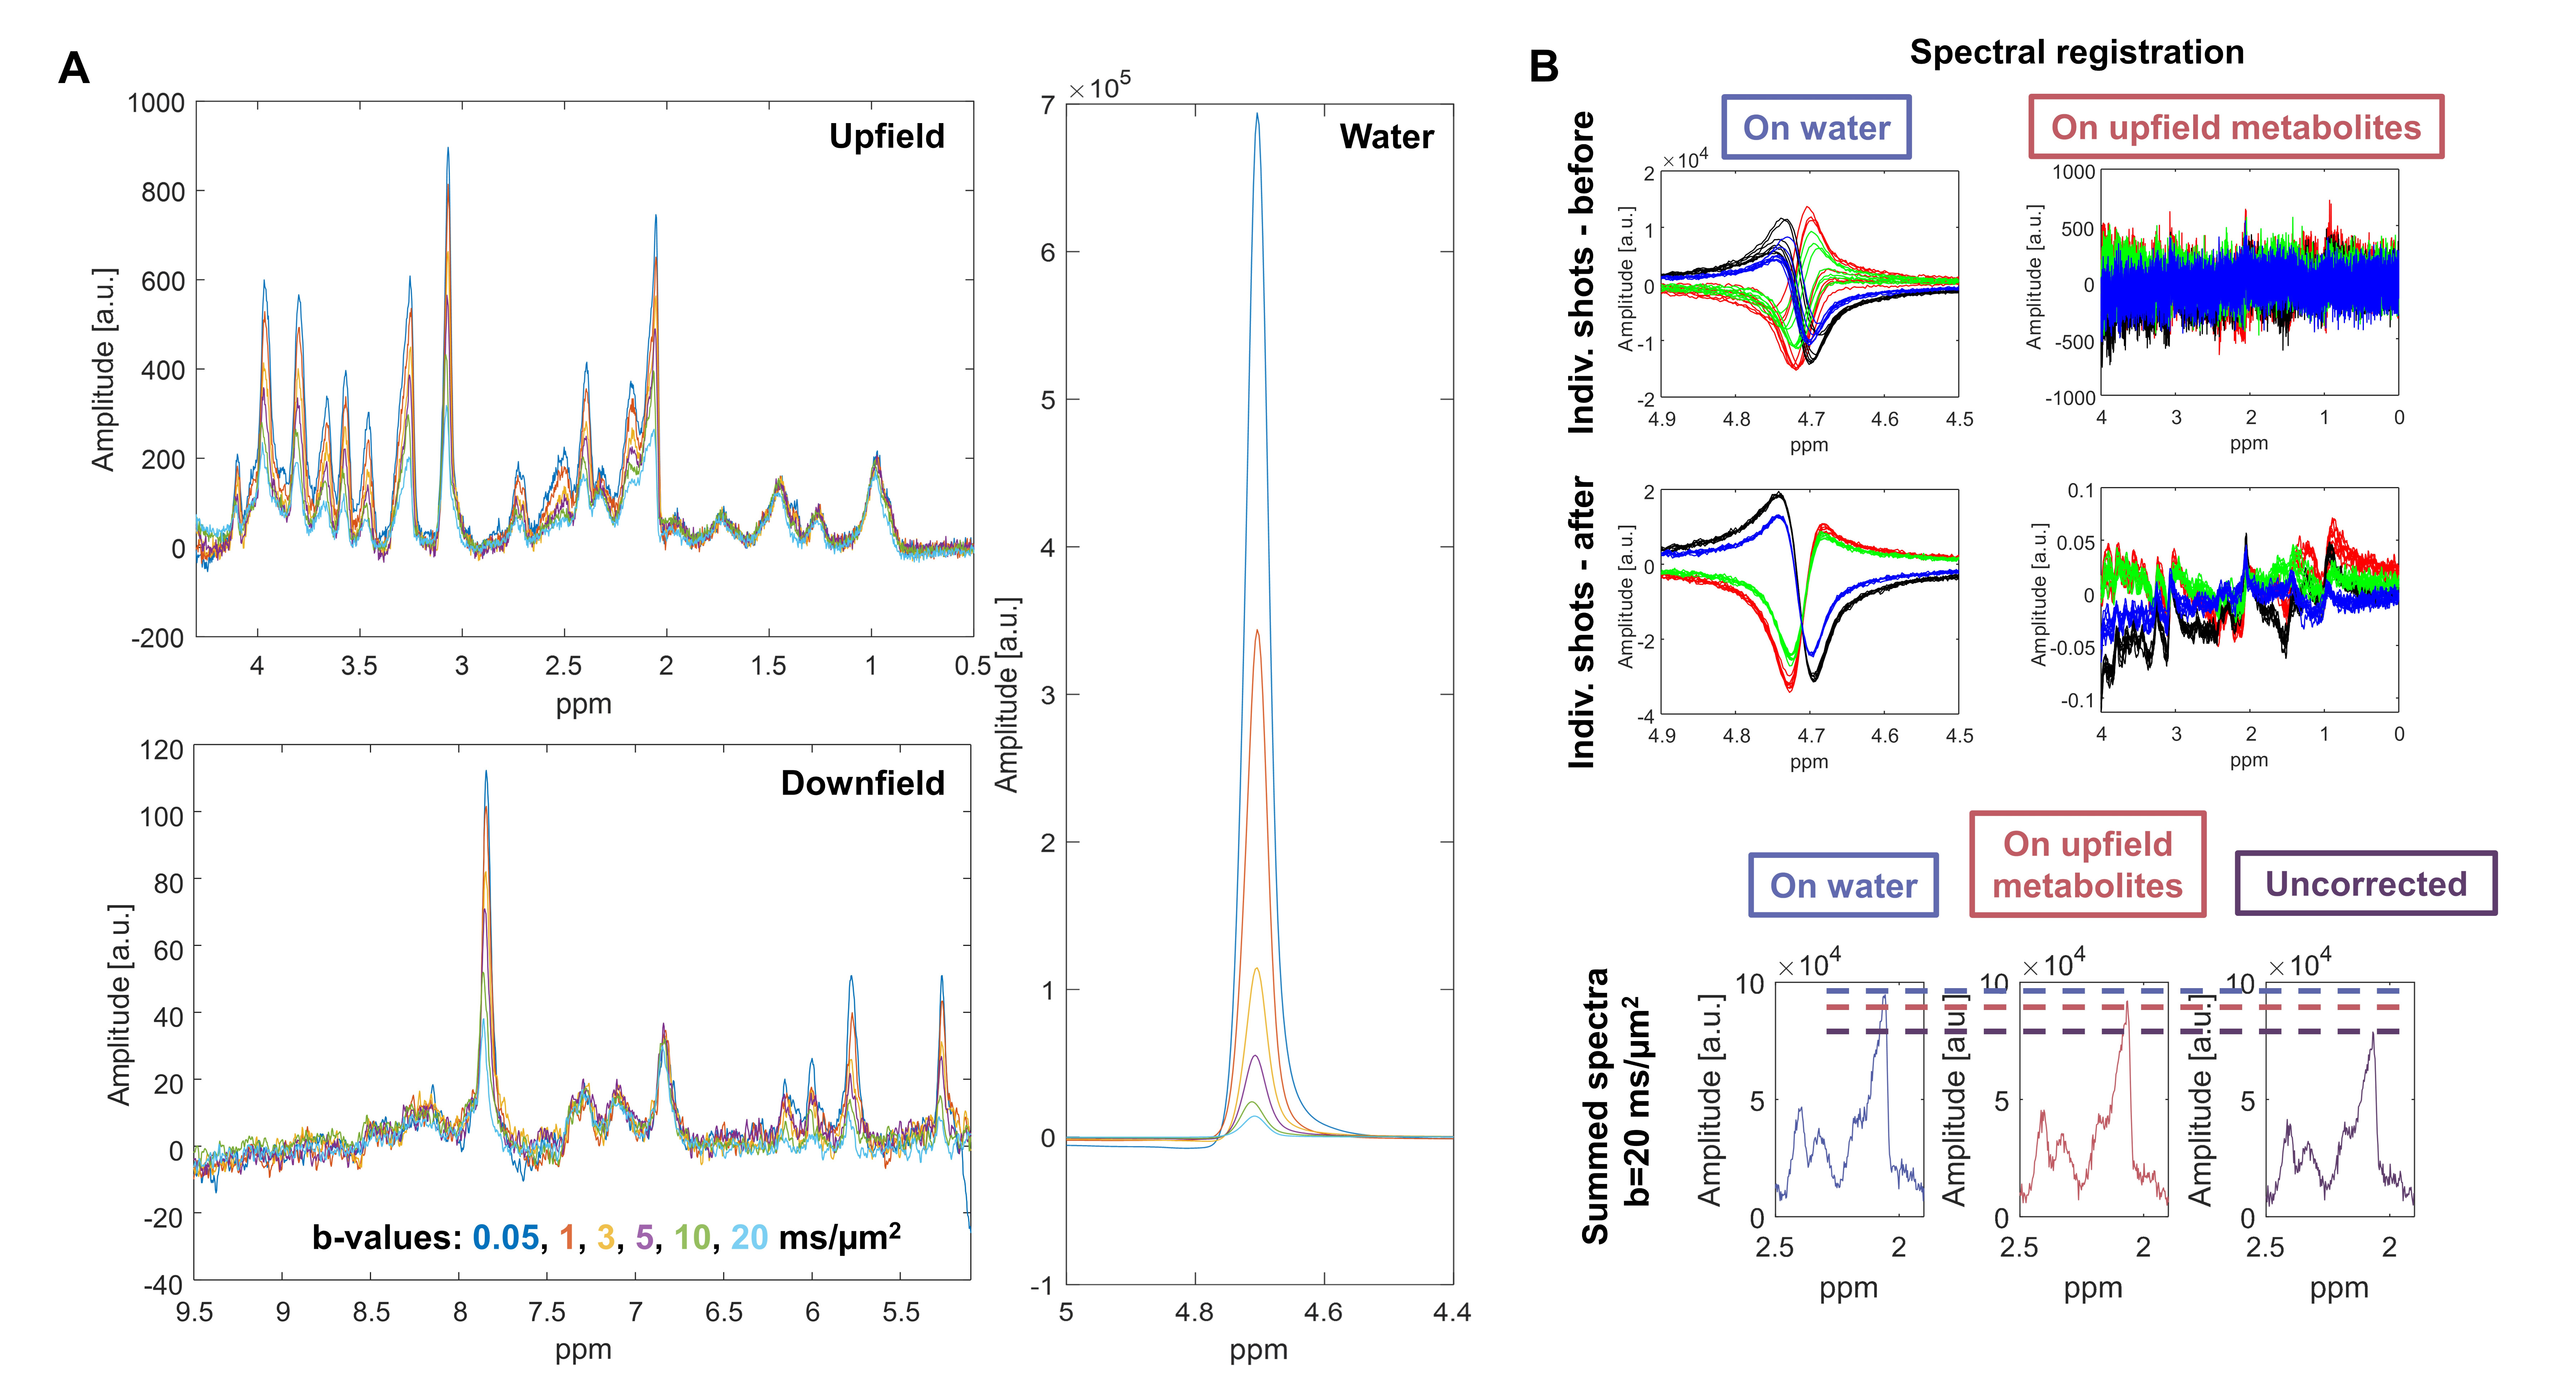
DW-MRS: N=1 rat was scanned with MC DW-SPECIAL (175µL voxel, centre of the brain, 6 b-values between 0.05 to 20ms/µm2, TE/TR/Δ/δ=18.5/3000/43/3ms, Δ/δ: diffusion gradient spacing/duration). Spectral registration was performed either on the water region or the upfield region to compare the two processing strategies.
Results and Discussion
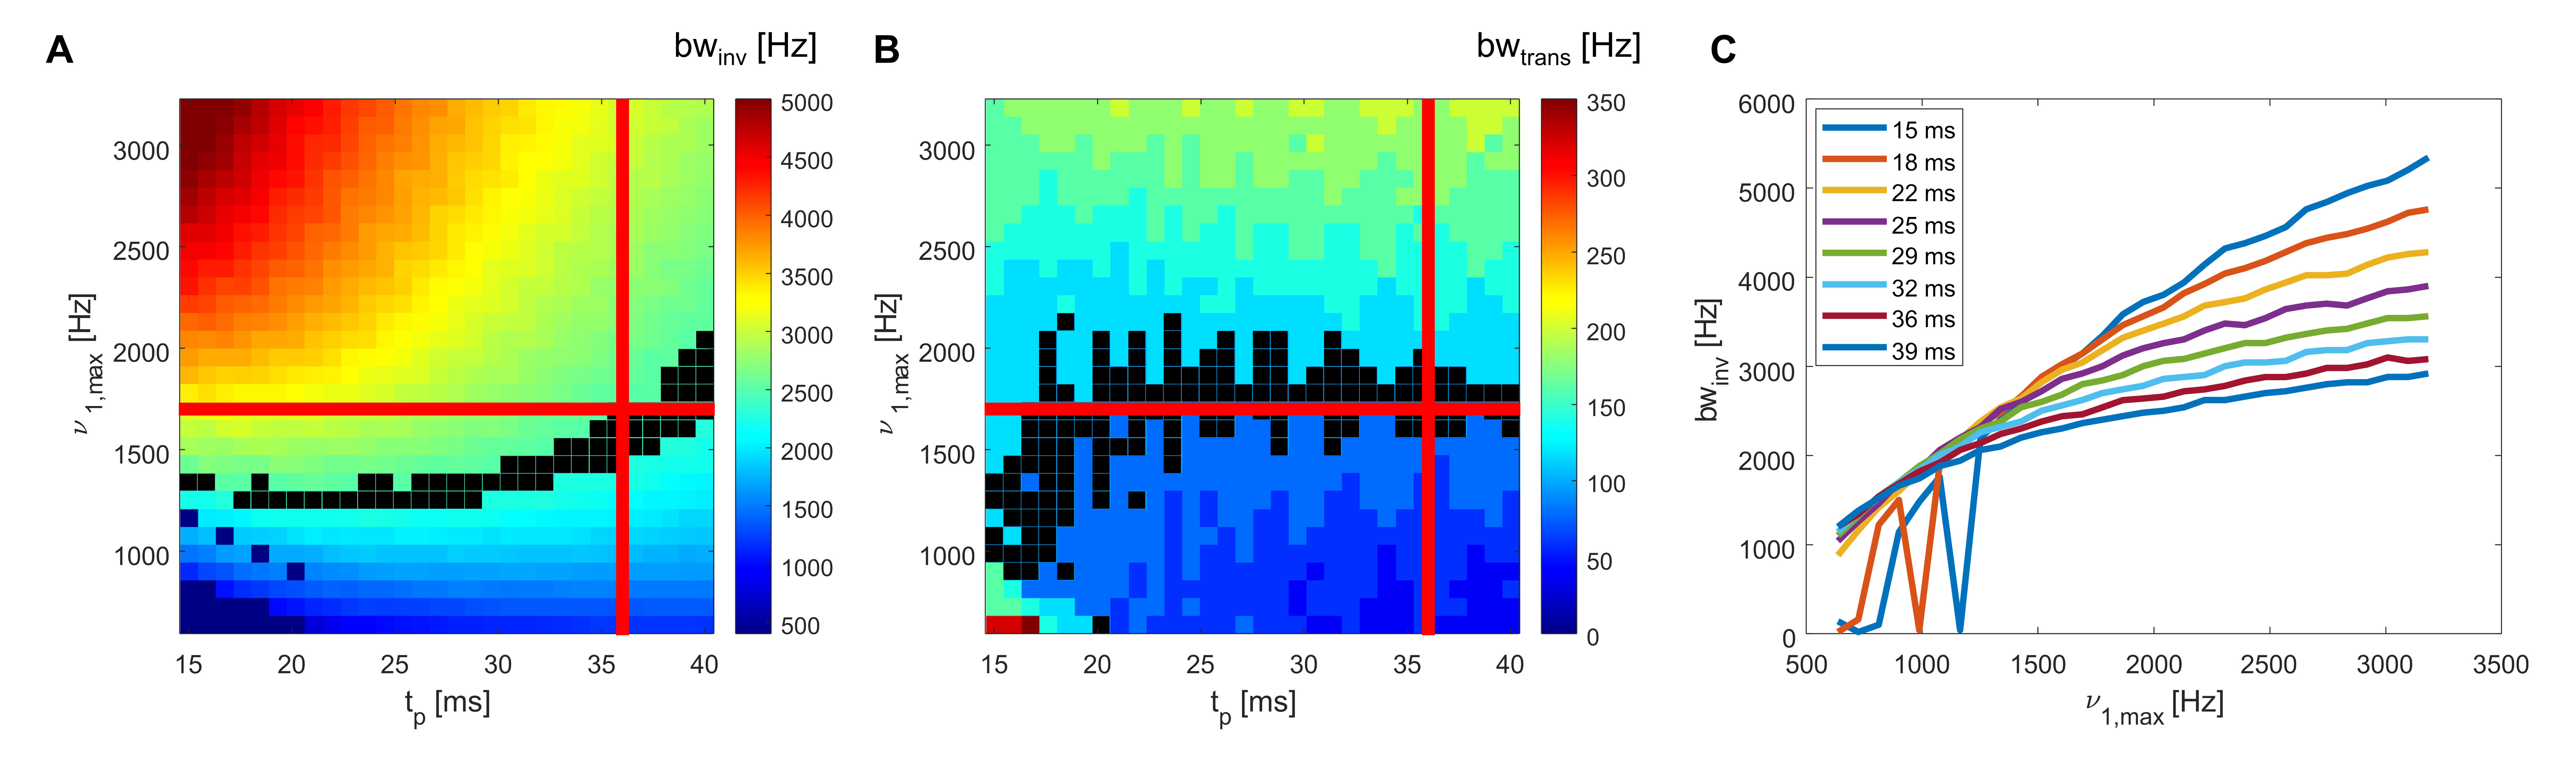
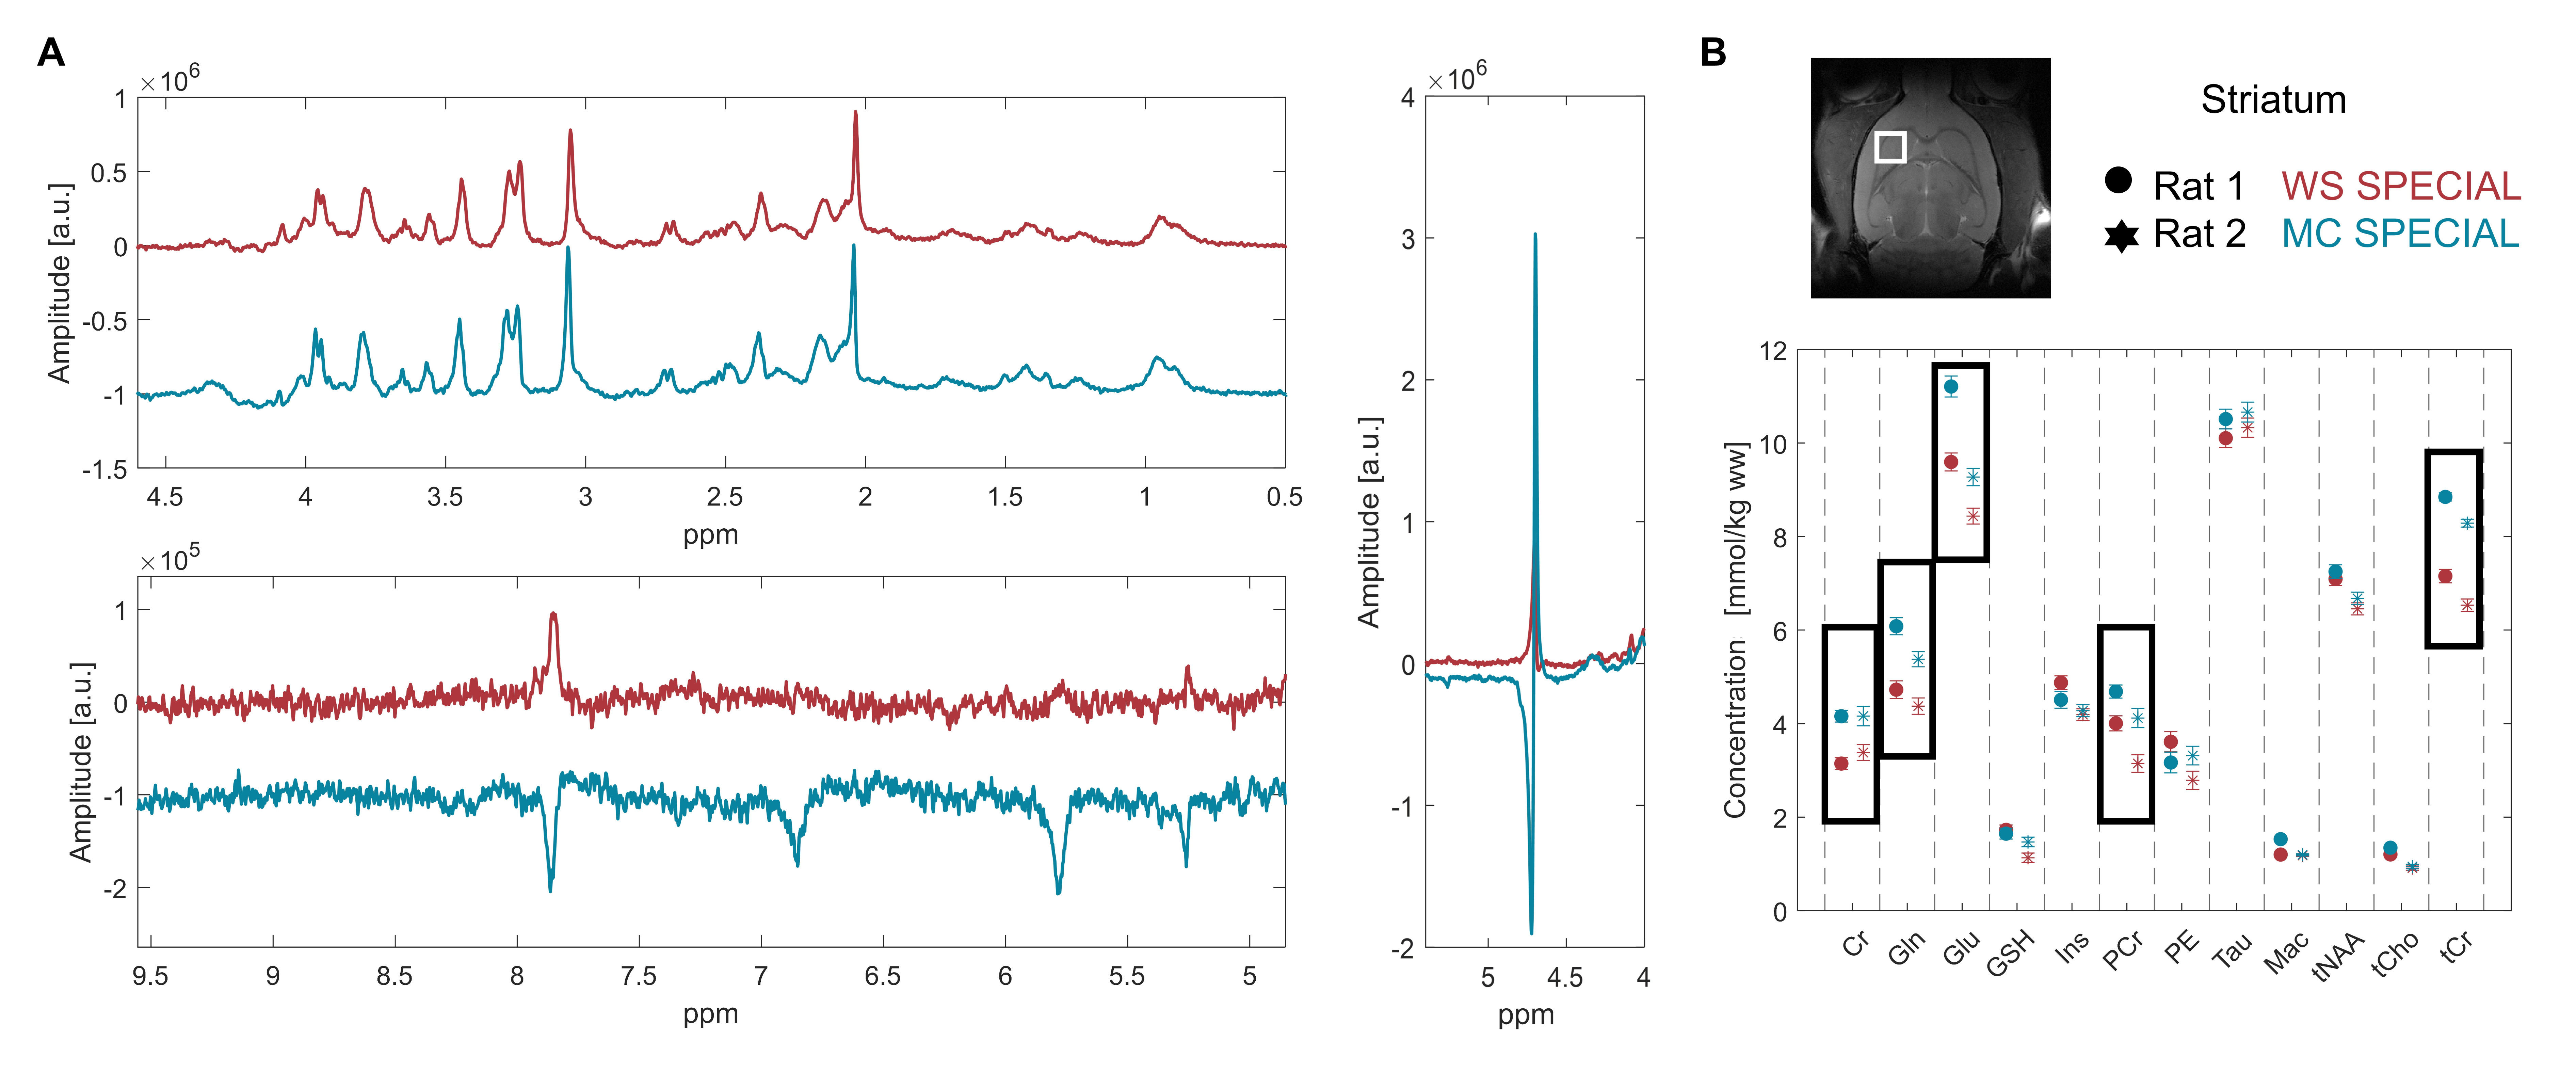
Fig 2 shows the results of the MC pulse optimization at 14.1T, performed following refs3,5, based on the initial pulse of Hwang et al.13. Pulse duration tp and RF peak amplitude ν1,max were chosen to reach the desired inversion bandwidth (2400Hz, 4 ppm at 14.1T) and transition bandwidth (100Hz) (Fig 2A,B). The longer the pulse, the more robust bwinv to ν1,max inhomogeneities, expected with surface coils, guiding the choice for a long tp among the possible choices (Fig 2C). The final combination of parameters was: ν1,max=1700Hz, tp=36ms, ±350Hz offset with respect to water frequency.Fig 3A shows the comparison between WS and MC SPECIAL in the striatum of two animals. Good upfield spectral quality and efficient water suppression were obtained with both sequences, the downfield region with MC SPECIAL featuring additional resonances. Cr, PCr, Gln and Glu concentrations are systematically underestimated with WS SPECIAL compared to MC SPECIAL, possibly caused by magnetization transfer on metabolites pools linked to solid-like macromolecules (Fig 3B).
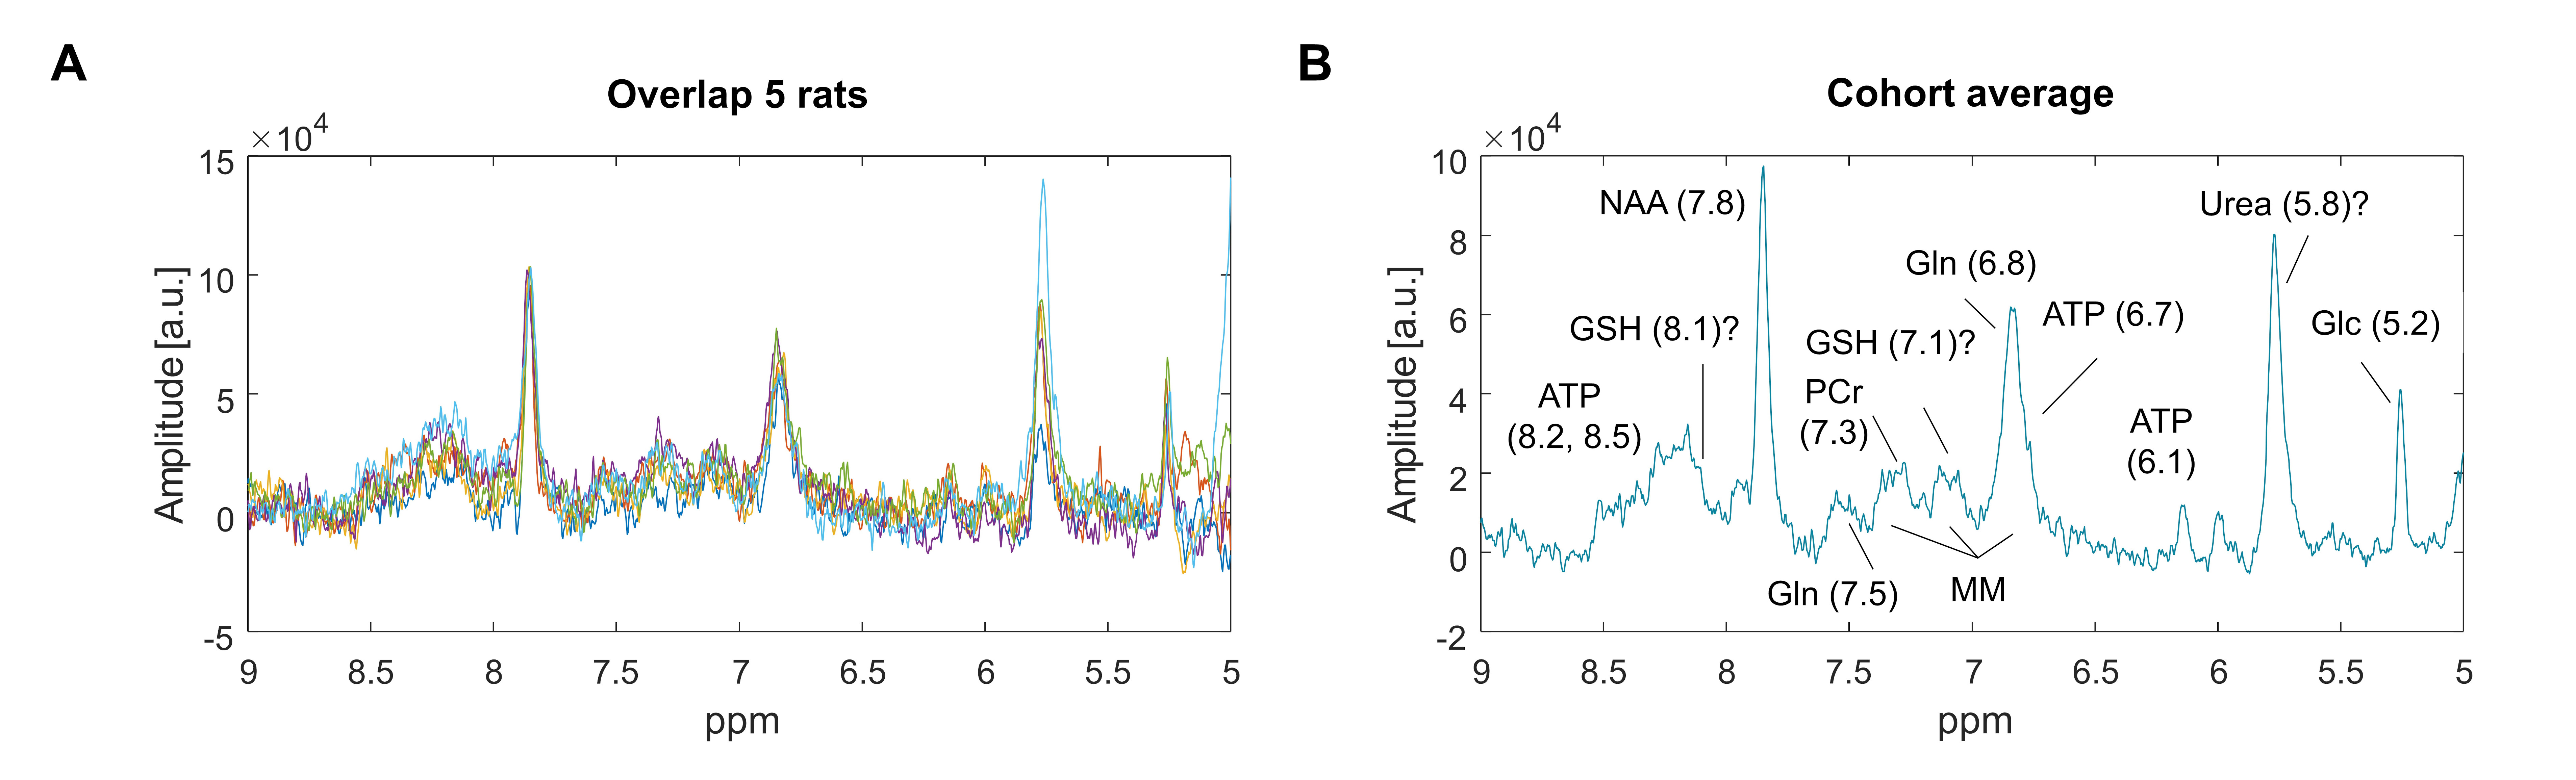
Fig 4 shows a tentative assignment of the downfield resonances in the striatum (ATP, Gln, PCr, Glc, NAA, GSH, MM) based on literature4,14,15. The resonance at 5.8 ppm, possibly blood-borne urea16, was highly variable between animals.
Fig 5A shows upfield, downfield and water diffusion spectra acquired in one animal with MC DW-SPECIAL, of good quality up to the highest b=20ms/µm2 used. The downfield resonances between 6.5 and 7.5 ppm barely decay, suggesting the presence of macromolecules in this region. Spectral registration and intensity scaling applied on water or on upfield metabolites perform similarly at correcting high b-value spectra and better than without any correction (Fig 5B). For human experiments more prone to motion artefacts or with poorer shimming conditions, alignment of the ISIS shots based on MC water rather than on metabolites could become crucial.
Conclusion
A short TE (DW-)SPECIAL combined with MC at 14.1T was successfully implemented. With their high sensitivity, the two sequences enable further exploration of the downfield region enhanced by diffusion measurements, and improved accuracy of 1H MRS upfield metabolite concentrations estimation.Acknowledgements
This project was supported by the European Union's Horizon 2020 research and innovation program under the Marie Sklodowska-Curie grant agreement No 813120 (INSPiRE-MED), the SNSF projects no 310030_173222, 310030_201218 and the Leenaards and Jeantet Foundations. We acknowledge access to the facilities and expertise of the CIBM Center for Biomedical Imaging founded and supported by Lausanne University Hospital (CHUV), University of Lausanne (UNIL), Ecole polytechnique fédérale de Lausanne (EPFL), University of Geneva (UNIGE) and Geneva University Hospitals (HUG).References
1. Tkác I, Starcuk Z, Choi IY, Gruetter R. In vivo 1H NMR spectroscopy of rat brain at 1 ms echo time. Magn Reson Med. 1999;41(4):649-656. doi:10.1002/(sici)1522-2594(199904)41:4<649::aid-mrm2>3.0.co;2-g
2. de Graaf RA, van Kranenburg A, Nicolay K. Off-resonance metabolite magnetization transfer measurements on rat brain in situ. Magn Reson Med. 1999;41(6):1136-1144. doi:10.1002/(sici)1522-2594(199906)41:6<1136::aid-mrm9>3.0.co;2-g
3. Dreher W, Leibfritz D. New method for the simultaneous detection of metabolites and water in localized in vivo 1H nuclear magnetic resonance spectroscopy. Magn Reson Med. 2005;54(1):190-195. doi:10.1002/mrm.20549
4. Fichtner ND, Giapitzakis IA, Avdievich N, et al. In vivo characterization of the downfield part of 1 H MR spectra of human brain at 9.4 T: Magnetization exchange with water and relation to conventionally determined metabolite content. Magn Reson Med. 2018;79(6):2863-2873. doi:10.1002/mrm.26968
5. Giapitzakis IA, Shao T, Avdievich N, Mekle R, Kreis R, Henning A. Metabolite-cycled STEAM and semi-LASER localization for MR spectroscopy of the human brain at 9.4T. Magn Reson Med. 2018;79(4):1841-1850. doi:10.1002/mrm.26873
6. MacMillan EL, Chong DGQ, Dreher W, Henning A, Boesch C, Kreis R. Magnetization exchange with water and T1 relaxation of the downfield resonances in human brain spectra at 3.0 T. Magn Reson Med. 2011;65(5):1239-1246. doi:10.1002/mrm.22813
7. Mlynárik V, Gambarota G, Frenkel H, Gruetter R. Localized short-echo-time proton MR spectroscopy with full signal-intensity acquisition. Magnetic Resonance in Medicine. 2006;56(5):965-970. doi:10.1002/mrm.21043
8. Xin L, Schaller B, Mlynarik V, Lu H, Gruetter R. Proton T1 relaxation times of metabolites in human occipital white and gray matter at 7 T. Magn Reson Med. 2013;69(4):931-936. doi:10.1002/mrm.24352
9. Mosso J, Simicic D, Lanz B, Gruetter R, Cudalbu C. Diffusion-weighted SPECIAL improves the detection of J-coupled metabolites at ultrahigh magnetic field. Magnetic Resonance in Medicine. n/a(n/a). doi:10.1002/mrm.29805
10. Near J, Edden R, Evans CJ, Paquin R, Harris A, Jezzard P. Frequency and phase drift correction of magnetic resonance spectroscopy data by spectral registration in the time domain. Magn Reson Med. 2015;73(1):44-50. doi:10.1002/mrm.25094
11. Starčuk Z, Starčuková J. Quantum-mechanical simulations for in vivo MR spectroscopy: Principles and possibilities demonstrated with the program NMRScopeB. Anal Biochem. 2017;529:79-97. doi:10.1016/j.ab.2016.10.007
12. Simicic D, Rackayova V, Xin L, et al. In vivo macromolecule signals in rat brain 1H-MR spectra at 9.4T: Parametrization, spline baseline estimation, and T2 relaxation times. Magnetic Resonance in Medicine. 2021;86(5):2384-2401. doi:10.1002/mrm.28910
13. Hwang TL, van Zijl PC, Garwood M. Asymmetric adiabatic pulses for NH selection. J Magn Reson. 1999;138(1):173-177. doi:10.1006/jmre.1999.1713
14. Fichtner ND, Henning A, Zoelch N, Boesch C, Kreis R. Elucidation of the downfield spectrum of human brain at 7 T using multiple inversion recovery delays and echo times. Magnetic Resonance in Medicine. 2017;78(1):11-19. doi:10.1002/mrm.26343
15. Borbath T, Murali-Manohar S, Wright AM, Henning A. In vivo characterization of downfield peaks at 9.4 T: T2 relaxation times, quantification, pH estimation, and assignments. Magnetic Resonance in Medicine. 2021;85(2):587-600. doi:10.1002/mrm.28442
16. Watanabe T, Frahm J, Michaelis T. Amide proton signals as pH indicator for in vivo MRS and MRI of the brain-Responses to hypercapnia and hypothermia. Neuroimage. 2016;133:390-398. doi:10.1016/j.neuroimage.2016.03.013
Figures