0250
A Novel Pipeline to Automatically Harness Log File Data for Enhanced MRI Parameter Analysis, Patient Care and Radiology Utilisation1Medical Physics, Guy's and St Thomas' NHS Trust, London, United Kingdom
Synopsis
Keywords: Software Tools, MR Value
Motivation: A deeper understanding of how information in log files can contribute to service improvement, for example reducing patient backlog and improving patient safety.
Goal(s): To construct an automated data pipeline that analyses and processes log files, returning quantitative results and graphical visualisations that can be interpreted in a clinically useful way.
Approach: We obtained log files from our scanner fleet and constructed a Python codebase to read, analyse and interpret data pertaining to time utilisation and patient exposure.
Results: We have demonstrated the code’s capability to provide detailed exposure monitoring as well as insights into how productively we use time on our scanners.
Impact: Our work will help us to optimise the patient pathway, improve patient safety and investigate how more obscure parameters can affect our service delivery. Our code will be open source, enabling others to benefit and contribute, improving services more widely.
Introduction
In a clinical MRI setting, the efficiency of scanner utilisation is a priority. Following the COVID-19 pandemic, the NHS has been under significant strain, with MRI referrals increasing 10% annually1,2. There is therefore an operational need for a robust and comprehensive monitoring system for scanner utilisation, helping to reduce patient backlog through optimisation of available resources. Whilst DICOM data and Radiology Information Systems (RIS) are useful tools for obtaining scanning information, log files from the scanners provide a more detailed insight into the activities performed by the scanner, e.g. start and end times of adjustments and individual pulse sequences3.Furthermore, patient safety is of utmost importance, particularly for patients with implants, and information in log files can provide a more detailed insight into specific absorption rate (SAR), B1+RMS and the forward/reflected power than the DICOM metadata or the information on the scanner interface4. They can therefore be used to improve the accuracy of monitoring these parameters for our patients.
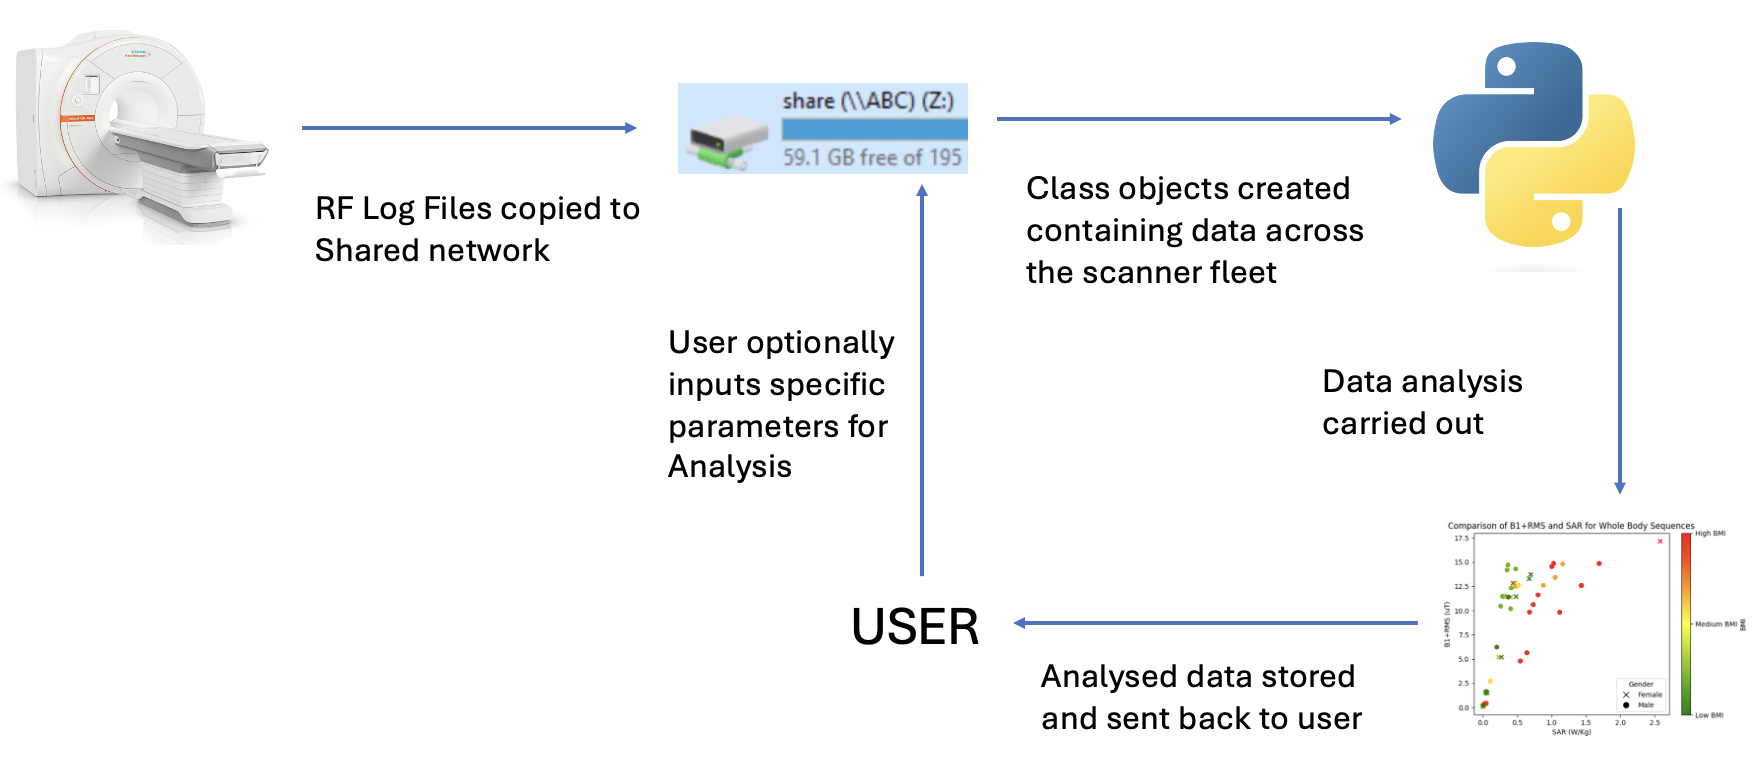
We have devised an automatic framework allowing us to address these issues, using a combination of Python and batch scripting. We present our analysis of both scanner utilisation data and SAR data from a sample of log files.
Methods
We obtained log files from various scans across the fleet of Siemens scanners at Guy's and St Thomas' NHS Foundation Trust. The files are copied over to a shared secure network containing an open-source Python code base. The code automatically analyses the log files using character recognition, and then extracts each line of the log file, pairing the parameter with its corresponding value. The nature of the extracted information is customisable by the user. The code is generalisable to take any data from the log files; however, we are currently focussing on specific parameters related to patient RF exposure and scanner utilisation.The extracted data serves as the foundation for the creation of class objects, which are tailored depending on the specific data selected by the user. The time utilisation objects are derived from manipulating the start and end host time attributes, and the SAR and B1+RMS are derived from their respective attributes in the log files. These objects are saved and easily analysed using the NumPy and Matplotlib libraries.
Results
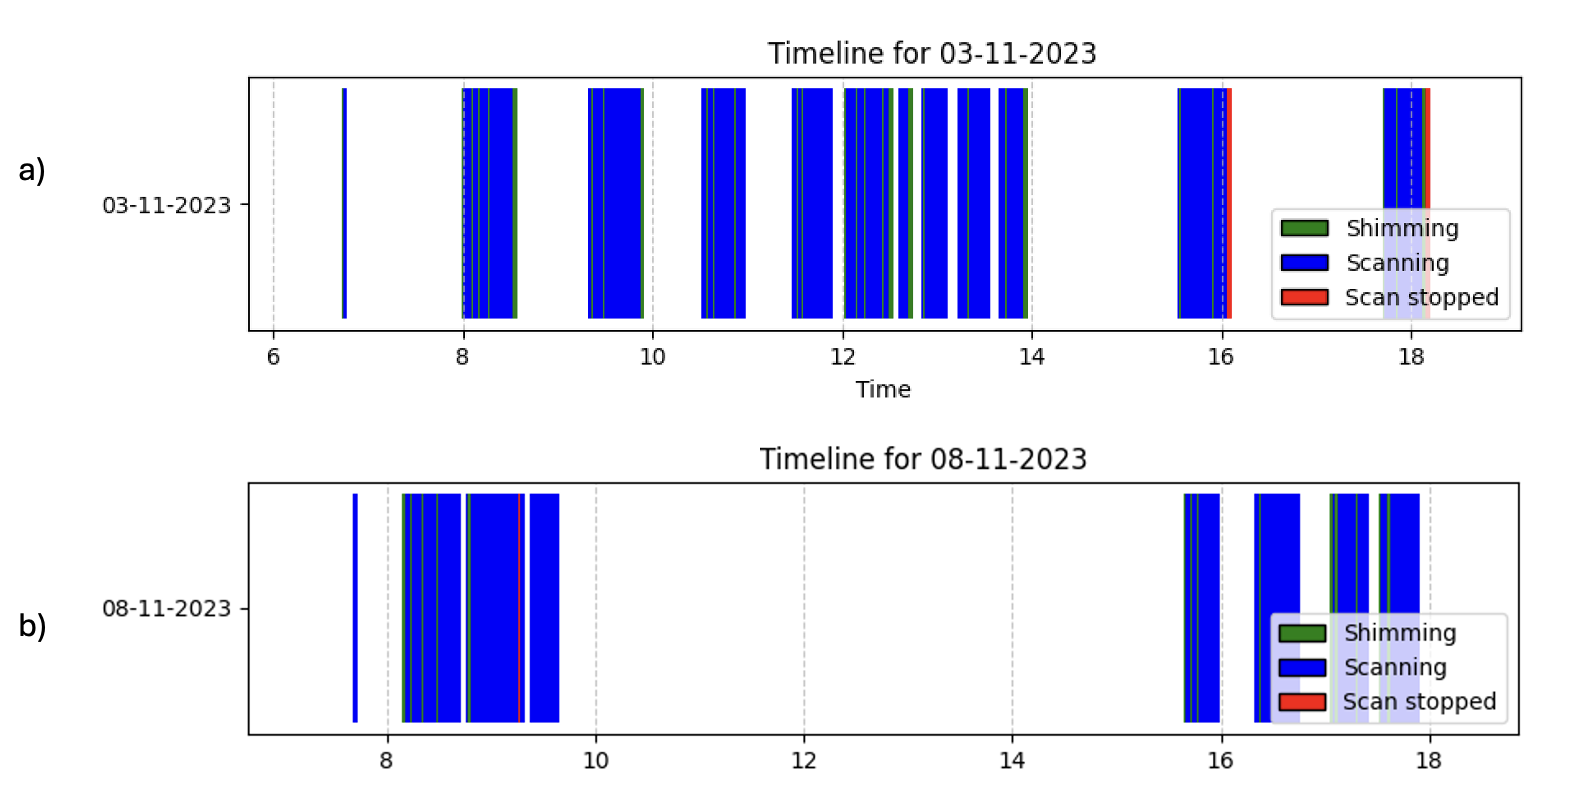
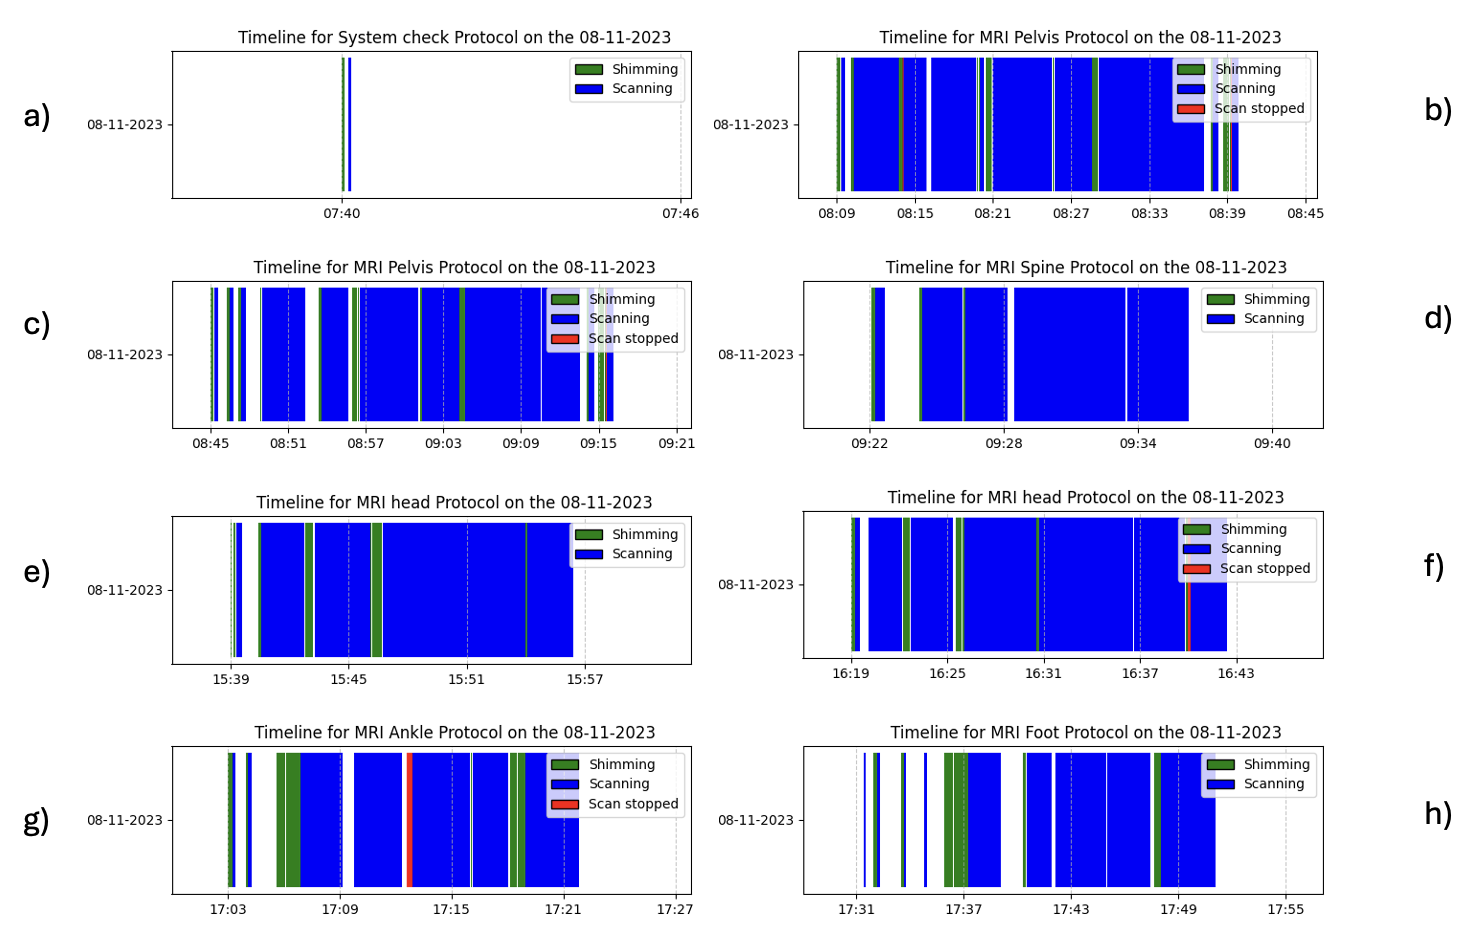
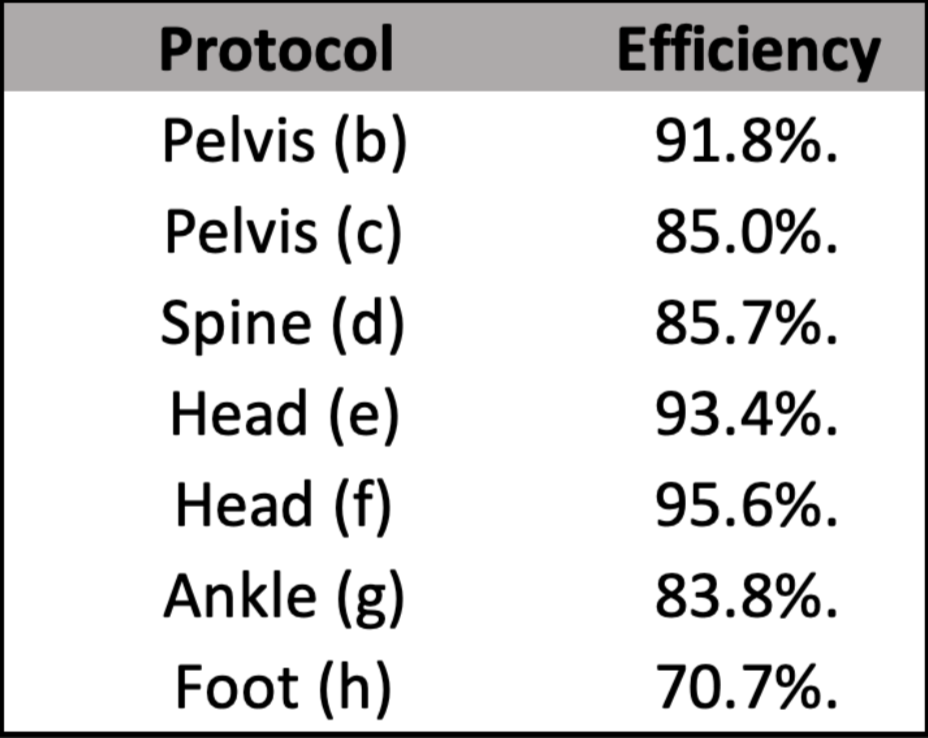
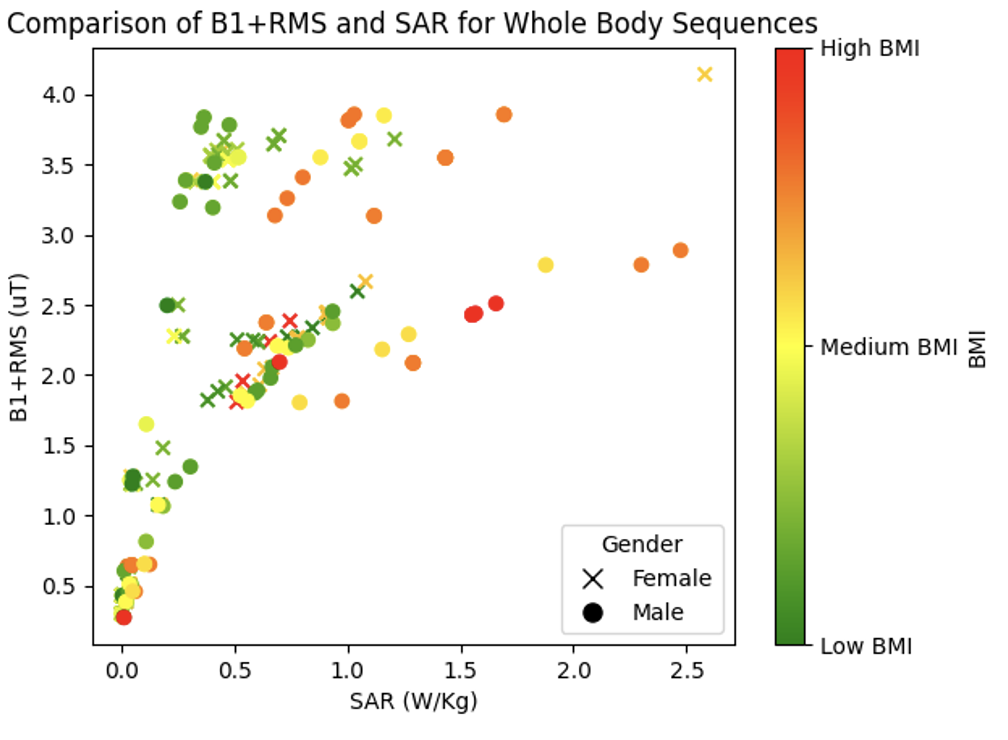
We have analysed the time utilisation, B1+RMS and SAR for a given day of scanning on one of our scanners to demonstrate the potential of the data pipeline for the visualisation of input parameters. Figure 2-4 show the daily time utilisation graphs, time utilisation graphs for individual protocols, and a table of the scanner efficiency.Given the flexibility of the input parameters to analyse, we have also begun to append data points that demonstrate how the SAR varies with gender and BMI across all whole-body protocols for a given week, with the aim of spotting reasons why the SAR limit is reached for particular patients scanned under given protocols, see Figure 5. This is generalisable to other protocols and safety parameters that will be further explored.
Discussion
The information from Figures 2 and 3 can shed light on where improvements can be made to both the patient throughput on our scanners and the efficiency of individual protocols, due to the ability to easily identify when and how the scanners are being used. Discerning this information can help resolve issues such as delegation of staff by measuring which scanners are busiest, as well as assisting in reducing patient backlog by providing more accurate slot times for booking scans.The detailed SAR and B1+RMS insights from the log files facilitate identification of clinically relevant trends that may help us find useful information, such as reasons for the SAR limit to be reached. This granular analysis, made possible by the class objects, not only can help patient safety but also can aid in refining scan protocols.
There is significant scope to investigate many other parameters that are recorded in the log files, such as measured bore temperature and comprehensive estimates of SAR limitations. This provides us with the opportunity to investigate the relationship that any of the log parameters have with other parameters from the log file, or with patient specific parameters from the DICOM metadata.
Conclusion
We have developed an automated framework for the collection and analysis of log file parameters. We have so far visualised trends in scanner utilisation, and in SAR and B1+RMS, with the potential for analysis of further parameters in the future. This framework will be implemented departmentally and will eventually be made open-source, with scope for analysis of multiple additional parameters.Acknowledgements
No acknowledgement found.References
1 Sir Mike Richard, Diagnostics: Recovery and Renewal – Report of the Independent Review of Diagnostic Services for NHS England, https://www.england.nhs.uk/publication/diagnostics-recovery-and-renewal-report-of-the-independent-review-of-diagnostic-services-for-nhs-england/
2 - Zhong, Jim, et al. "The impact of COVID-19 on interventional radiology services in the UK." Cardiovascular and interventional radiology 44 (2021): 134-140.
3 Recht, Michael P., et al. "Optimization of MRI turnaround times through the use of dockable tables and innovative architectural design strategies." AJR. American journal of roentgenology 212.4 (2019): 855.
4 Langman, Deborah Anne, Subashini Srinivasan, and Daniel B. Ennis. "What is the SAR for Routine Clinical MRI Exams at 1.5 T?." Proc. Intl. Soc. Mag. Reson. Med. Vol. 23. 2015.
Figures