0249
QRadAR: A Toolbox for Quantitative Magnetic Resonance Radiomics Analysis and Reliability1Electrical and Computer Engineering, Cornell University, New York, NY, United States, 2Electrical and Computer Engineering, Johns Hopkins University, Baltimore, MD, United States, 3Biomedical Engineering, Cornell University, New York, NY, United States, 4Neurosurgery, Mount Sinai Hospital, New York, NY, United States, 5Radiology, Weill Cornell Medicine, New York, NY, United States
Synopsis
Keywords: Radiomics, Radiomics
Motivation: Radiomic feature robustness as an input to a downstream model is an important consideration for model reliability. Generating a subset of robust, reproducible, and repeatable features is an important step in determining predictive or indicative features.
Goal(s): To provide a framework for radiomics robustness, repeatability, and reproducibility.
Approach: A Python implementation using the pyradiomics, scikit-learn, numpy, and other open-source library is provided as tool to quickly summarize the radiomic features surviving differing sampling, time point, or field strength acquisitions.
Results: The QRadAR Toolbox provides researchers and clinicians with a collection of reliable features for downstream model input.
Impact: The QRadAR Toolbox provides researchers and clinicians with a collection of reliable features for downstream model input by providing a providing Python a framework for radiomics robustness, repeatability, and reproducibility.
Introduction
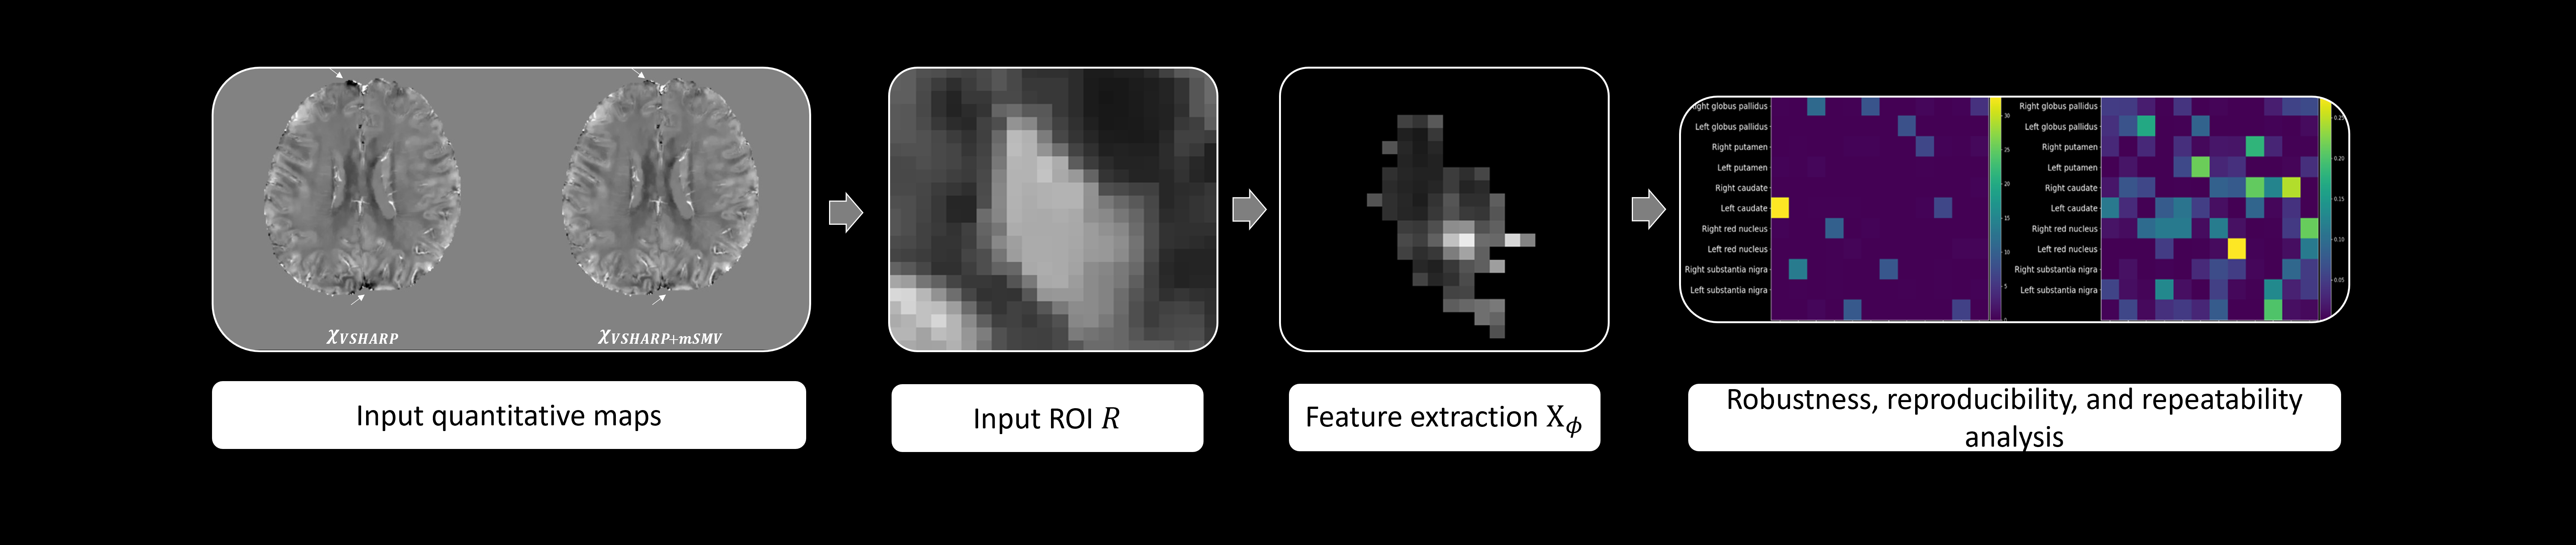
Radiomics is frequently applied as a tool to obtain biomarkers in magnetic resonance imaging.1 However, the sensitivity of radiomic features across acquisition method, institution, reconstruction, and other parameters is well-documented.2,3 Specifically, differing reconstruction methods including sampling variations4 or artifact reduction5,6 has the potential to alter regions of interest (ROIs) and, by extension, radiomic features. Comprehensive toolboxes such as AutoRadiomics7 allow selection models based on extracted features where model evaluation considers feature robustness implicitly. Here, a toolbox is presented to allow users to explicitly assess the robustness, reproducibility, and repeatability of certain features prior to feature reduction and selection and increase confidence in the downstream models that receive radiomic features as input. Specifically, quantitative susceptibility maps (QSMs) and $$$R_2^*$$$ maps are considered under an variety of conditions that may impact radiomic features. From input maps, reliability metrics are returned by the toolbox (Figure 1).Theory
Robustness is defined as the product of $$$\rho_i \rho_c$$$4 where $$$\rho_i$$$ is the intraclass coefficient (ICC)8 and $$$\rho_c$$$ is the concordance correlation coefficient (CCC).9,10 For each feature $$$i$$$, subject $$$j$$$, and ROI $$$k$$$, the CCC $$$\rho_c$$$ is calculated $$\rho^i_c=\frac{2\mathbb{E}[(X_{ij}-\mu_{x,i})(Y_{ij}-\mu_{ij})]}{\sigma^2_{xi}+\sigma_{yi}^2(\mu_{xi}-\mu_{yi})^2}$$ Between feature descriptors from the fully-sampled data $$$X$$$ and under-sampled data $$$Y$$$. For the ICC $$$\rho_i$$$ , assuming a mixed effects model $$\rho^i_i=\frac{s^2_T-s_E^2}{s_T^2+(\kappa-1)s_E^2}$$ Where $$$s_T$$$ is the variation within subjects, $$$s_E^2$$$ is the residual variation for feature descriptor $$$i$$$, and $$$\kappa$$$ is the number of sampling methods being compared. For the under-sampled and fully-sampled comparison, $$$\kappa=2$$$ . The reproducibility is measured by the coefficient of variation4, or $$c_v^i=\frac{\sigma_i}{\mu_i}$$ Where the feature mean $$$\mu_i$$$ and standard deviation $$$\sigma_i$$$ are calculated across field strengths, $$$\mu_i=\mathbb{E}[\phi_{1.5T},\phi_{3T}]$$$, $$$\sigma_i=\mathbb{V}[\phi_{1.5T},\phi_{3T}]$$$ . Between timepoints $$$t_1$$$ and $$$t_2$$$, Bland-Altman analysis quantifies the repeatability of features4 by generating bias and limits of agreement $$$\mu_{\Delta} \pm 1.96\sigma_{\Delta}$$$, where $$$\mu_{\Delta}$$$ is the mean feature difference and $$$\sigma_{\Delta}$$$ is the feature difference standard deviation.Methods
For all applications, features were extracted using pyradiomics.11Application 1: Radiomic features that are robust against undersampling
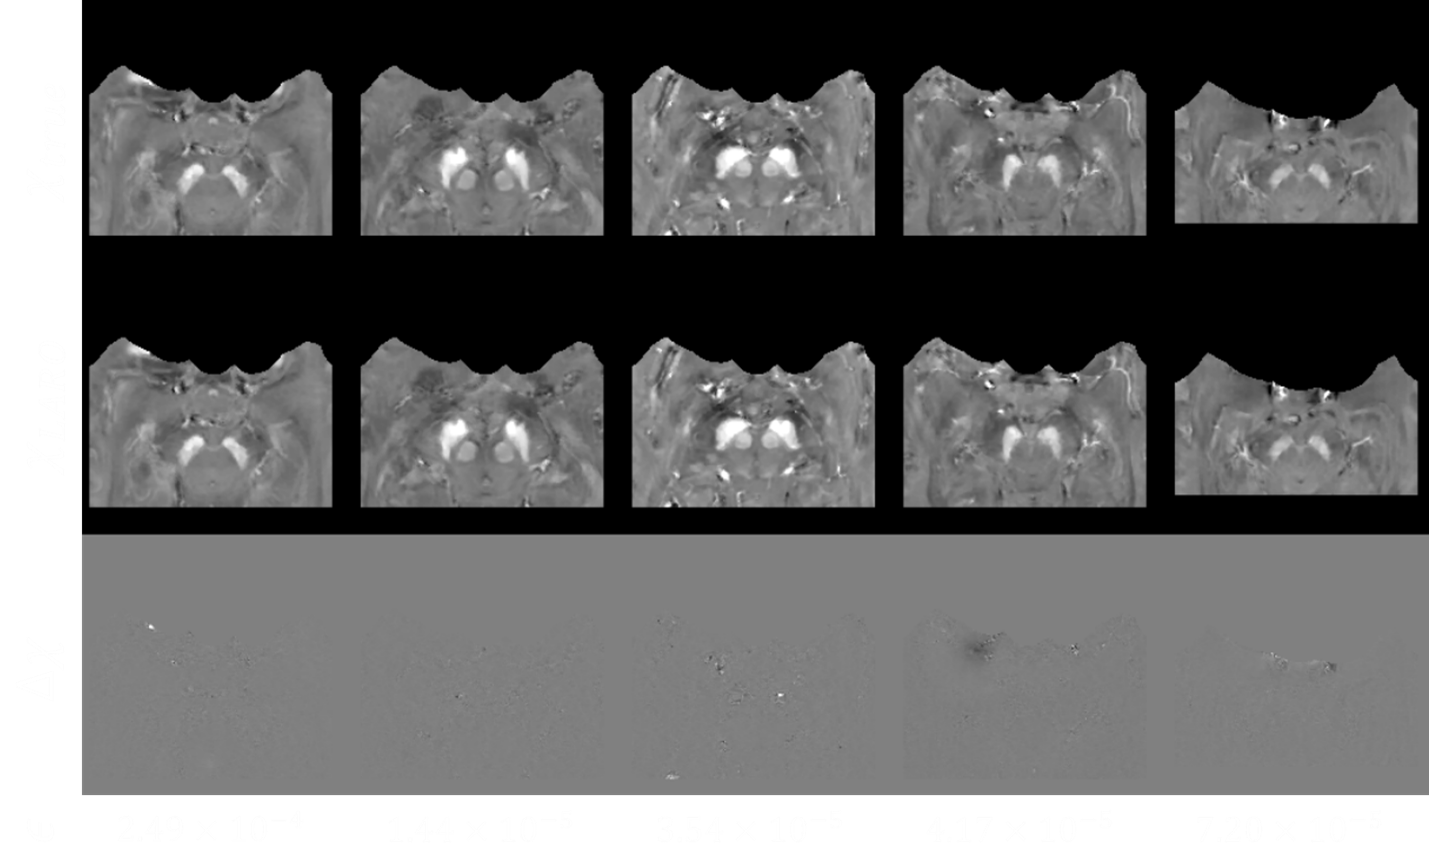
13 candidates for DBS surgery were acquired with a multi-echo gradient echo (mGRE) sequence12 with 10 echoes, acquired resolution $$$0.8\times0.8\times1mm^3$$$ interpolated to $$$0.5 mm^3$$$ isotropic, acquisition matrix of $$$320 \times 320 \times 180$$$, acceleration factor of 2 , repetition time $$$TR=44.1ms$$$ and scan time of 13 minutes. Fully-sampled and under-sampled (LARO13 with $$$K=2$$$ unrolls and $$$R=4$$$). QSMs were reconstructed using MEDI-L1.14 Features were extracted and robustness of each feature was measured using the CCC-ICC product.
Application 2: Radiomic features that are repeatable over time
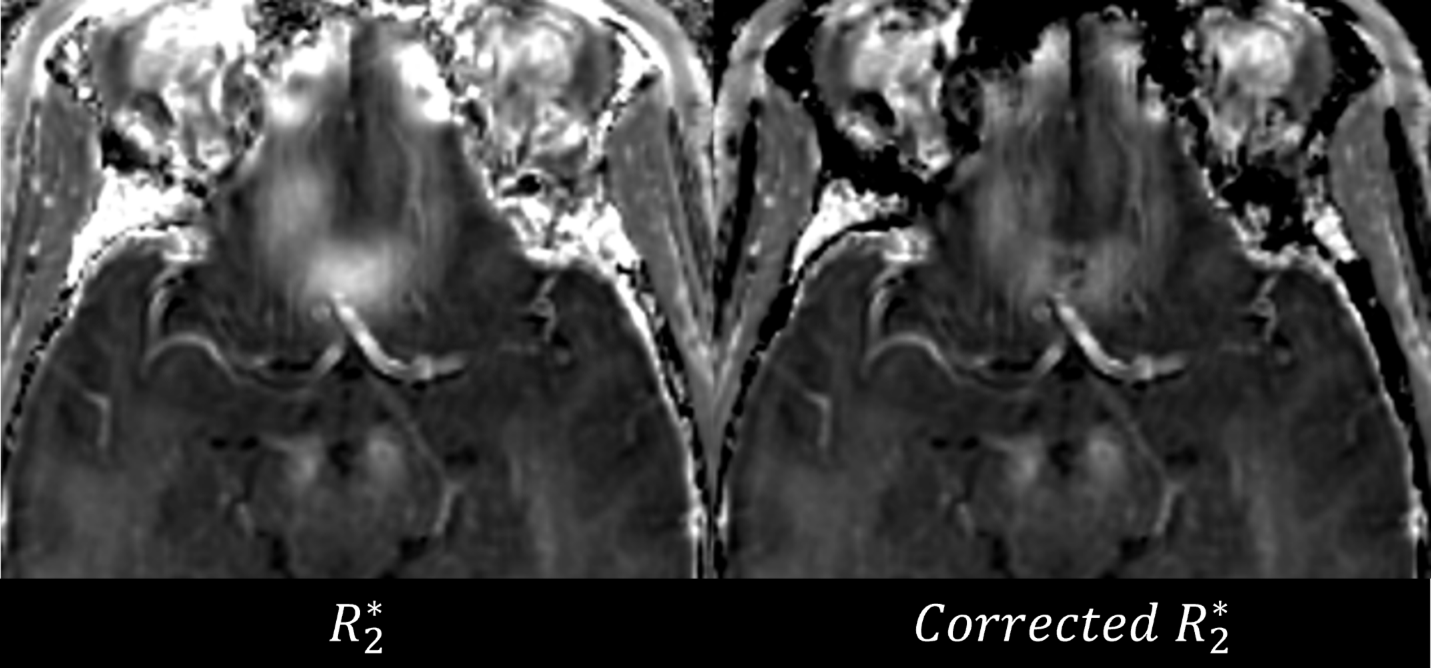
Multi-echo gradient echo (mGRE) data for 9 healthy subjects was acquired at two timepoints according to a 3D spoiled mGRE (SPGR) sequence15 with 11 echoes, echo spacing $$$\Delta TE=4.9 ms$$$ , voxel size $$$0.49\times0.49\times 3 mm^3$$$, and 15 minute scan time. The $$$R_2^*$$$ map at each timepoint was estimated using ARLO16 and an inhomogeneity-corrected map was also computed using the voxel-spread function.17,18 ROIs were extracted from FreeSurfer19-21 from $$$T_1w$$$ images and registered to the mGRE magnitude at each timepoint. Features were extracted from the uncorrected and corrected $$$R_2^*$$$ across two timepoints and feature repeatability was compared with Bland-Altman analysis and linear regression. Features are standardized and the repeatability is computed and compared for $$$R_2^*$$$ using Bland-Altman analysis.
Application 3: Radiomic features that are reproducible across field strengths
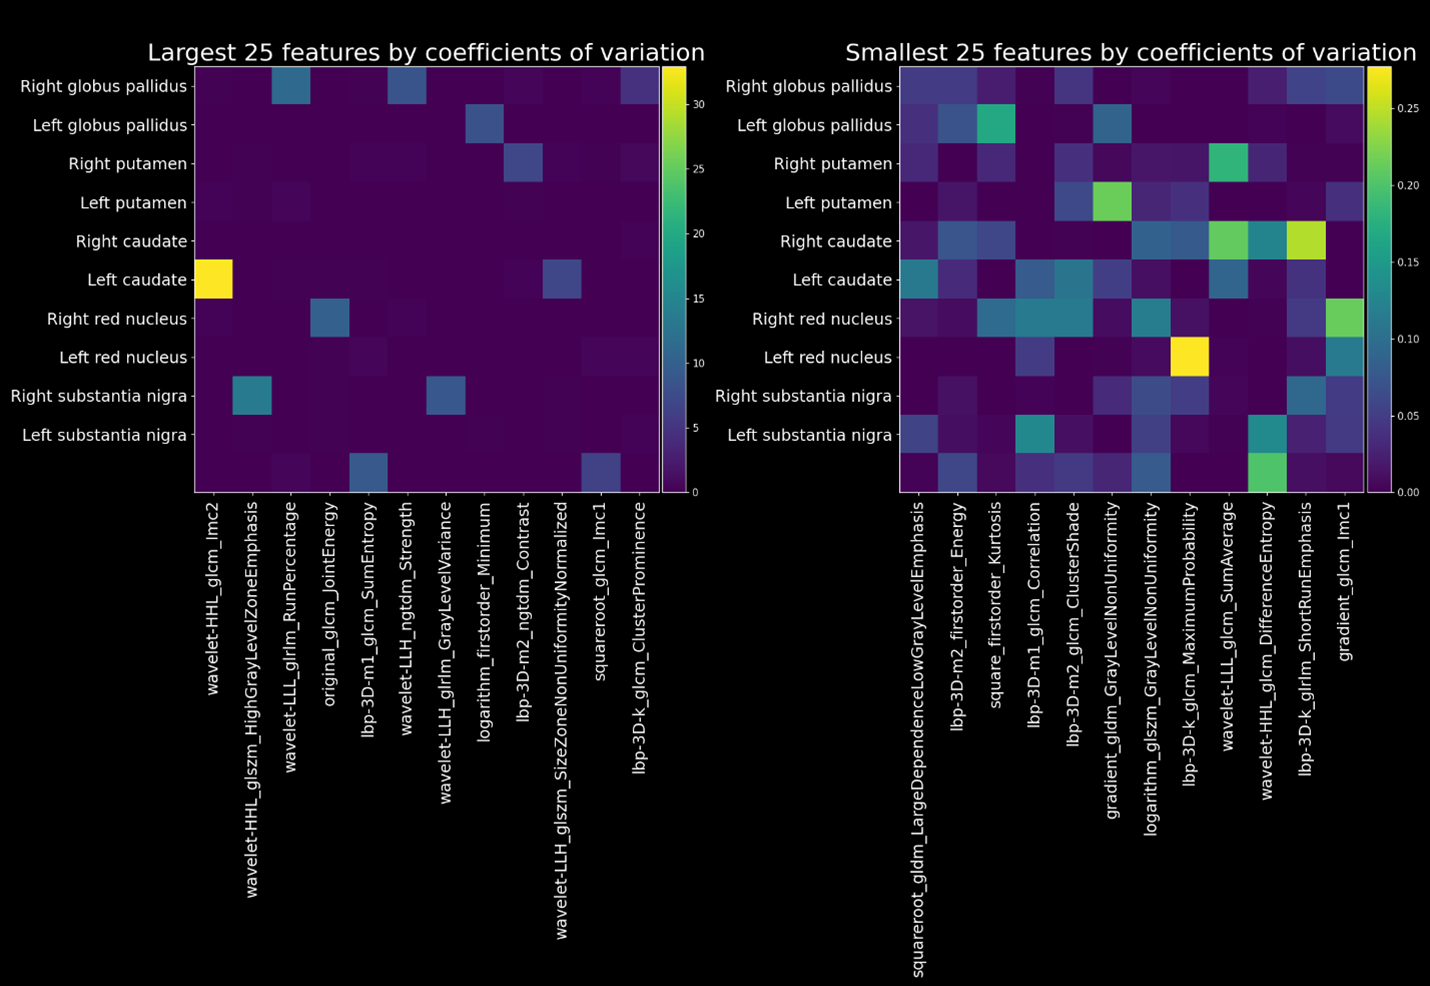
mGRE data for 7 healthy subjects was acquired at $$$1.5T$$$ and $$$3T$$$ (GE Signa HDxt TwinSpeed) according to a 3D SPPGR sequence22 with 11 echoes, field of view $$$FOV$$$ of $$$24cm$$$, matrix size $$$384 \times 384 \times 64$$$, slice thickness of $$$2mm$$$, and scan time of 8 minutes. QSM was reconstructed with both VSHARP+MEDI23 and VSHARP+MEDI-mSMV24,25 across field strengths. Reproducibility was calculated and the mean coefficient of variation (across the subjects) was reported for each feature and each reconstruction method. Features with the highest reproducibility (lowest coefficient of variation) and lowest reproducibility (highest coefficient of variation) are shown in in Figure 5.
Results
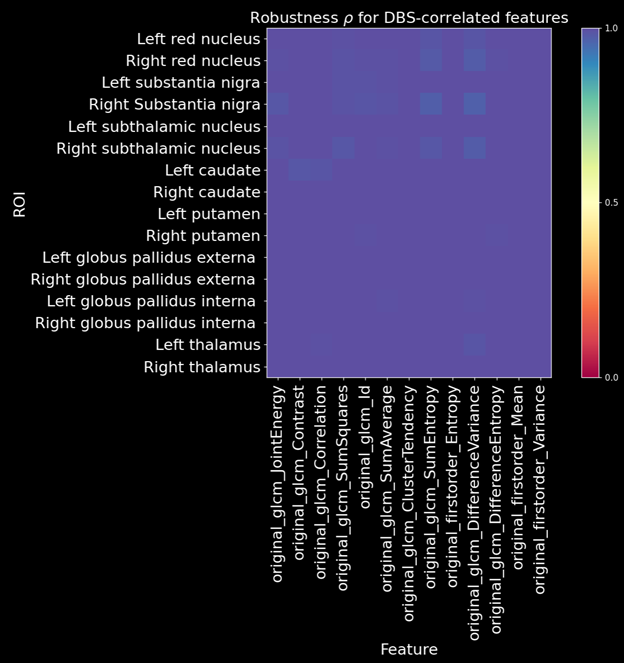
For Application 1, The mean robustness for LARO undersampling (Figure 2) was $$$\bar{\rho}_{LARO}=0.92$$$, an improvement over variable density undersampling $$$\bar{\rho}_{Variable \ density}=0.87$$$. Figure 3 shows robustness for features identified as possible biomarkers for Parkinson’s Disease.26 For Application 2, 28% of features were considered reproducible $$$c_v < 0.1$$$ across field strengths for both reconstruction methods. The median $$$c_v$$$ across features for VSHARP was 0.09 and 0.07 for VSHARP+mSMV. Figure 4 shows the largest and smallest coefficients of variation. For Application 3, VSF correction (Figure 5) provides tighter limits of agreement for repeatability at $$$t_1$$$ and $$$t_2$$$, $$$[-0.58,0.58]$$$ from uncorrected $$$[-0.73,-0.71]$$$ (Figure 5).Conclusion
To facilitate overall accessibility and model reliability in quantitative radiomics, the QRadAR Toolbox is presented alongside 3 example applications.Acknowledgements
No acknowledgement found.References
References 1. Mayerhoefer ME, Materka A, Langs G, et al. Introduction to Radiomics. Journal of Nuclear Medicine. 2020;61(4):488-495. doi:10.2967/jnumed.118.222893
2. Orlhac F, Boughdad S, Philippe C, et al. A Postreconstruction Harmonization Method for Multicenter Radiomic Studies in PET. Journal of Nuclear Medicine. 2018;59(8):1321-1328. doi:10.2967/jnumed.117.199935
3. Orlhac F, Eertink JJ, Cottereau A-S, et al. A Guide to ComBat Harmonization of Imaging Biomarkers in Multicenter Studies. Journal of Nuclear Medicine. 2022;63(2):172-179. doi:10.2967/jnumed.121.262464
4. Zhong J, Xia Y, Chen Y, et al. Deep learning image reconstruction algorithm reduces image noise while alters radiomics features in dual-energy CT in comparison with conventional iterative reconstruction algorithms: a phantom study. European Radiology. 2022;33(2):812-824. doi:10.1007/s00330-022-09119-1 5. Roberts A, Spincemaille P, Nguyen T, Wang Y. MEDI-d: Downsampled Morphological Priors for Shadow Reduction in Quantitative Susceptibility Mapping. presented at: International Society for Magnetic Resonance in Medicine; 2021; Vancouver, Canada. https://cds.ismrm.org/protected/21MPresentations/abstracts/2599.html
6. Roberts A, Spincemaille P, Nguyen T, Wang Y. MEDI-FM: Field Map Error Guided Regularization for Shadow Reduction in Quantitative Susceptibility Mapping. presented at: International Society for Magnetic Resonance in Medicine; 2022; London, England. https://archive.ismrm.org/2022/2359.html 7. Woznicki P, Laqua F, Bley T, Baeßler B. AutoRadiomics: A Framework for Reproducible Radiomics Research. Original Research. Frontiers in Radiology. 2022-July-07 2022;2doi:10.3389/fradi.2022.919133
8. Koo TK, Li MY. A Guideline of Selecting and Reporting Intraclass Correlation Coefficients for Reliability Research. Journal of Chiropractic Medicine. 2016;15(2):155-163. doi:10.1016/j.jcm.2016.02.012 9. Lawrence IKL. A Concordance Correlation Coefficient to Evaluate Reproducibility. Biometrics. 1989;45(1):255-268. doi:10.2307/2532051
10. Liao JJ, Lewis JW. A note on concordance correlation coefficient. PDA J Pharm Sci Technol. Jan-Feb 2000;54(1):23-6.
11. Van Griethuysen JJM, Fedorov A, Parmar C, et al. Computational Radiomics System to Decode the Radiographic Phenotype. Cancer Research. 2017;77(21):e104-e107. doi:10.1158/0008-5472.can-17-0339
12. Dimov AV, Gupta A, Kopell BH, Wang Y. High-resolution QSM for functional and structural depiction of subthalamic nuclei in DBS presurgical mapping. Journal of Neurosurgery. 2019;131(2):360-367. doi:10.3171/2018.3.jns172145
13. Zhang J, Spincemaille P, Zhang H, et al. LARO: Learned acquisition and reconstruction optimization to accelerate quantitative susceptibility mapping. Neuroimage. Mar 2023;268:119886. doi:10.1016/j.neuroimage.2023.119886
14. De Rochefort L, Liu T, Kressler B, et al. Quantitative susceptibility map reconstruction from MR phase data using bayesian regularization: Validation and application to brain imaging. Magnetic Resonance in Medicine. 2010;63(1):194-206. doi:10.1002/mrm.22187
15. Zhang J, Zhou D, Nguyen TD, Spincemaille P, Gupta A, Wang Y. Cerebral metabolic rate of oxygen (CMRO<sub>2</sub>) mapping with hyperventilation challenge using quantitative susceptibility mapping (QSM). Magnetic Resonance in Medicine. 2017;77(5):1762-1773. doi:10.1002/mrm.26253 16. Pei M, Nguyen TD, Thimmappa ND, et al. Algorithm for fast monoexponential fitting based on Auto-Regression on Linear Operations (ARLO) of data. Magnetic Resonance in Medicine. 2015;73(2):843-850. doi:10.1002/mrm.25137
17. Liu Y, Ye Q, Zeng F, et al. Library‐driven approach for fast implementation of the voxel spread function to correct magnetic field inhomogeneity artifacts for gradient‐echo sequences. Medical Physics. 2021;48(7):3714-3720. doi:10.1002/mp.14904
18. Yablonskiy DA, Sukstanskii AL, Luo J, Wang X. Voxel spread function method for correction of magnetic field inhomogeneity effects in quantitative gradient-echo-based MRI. Magnetic Resonance in Medicine. 2013;70(5):1283-1292. doi:10.1002/mrm.24585
19. Fischl B, Liu A, Dale AM. Automated manifold surgery: constructing geometrically accurate and topologically correct models of the human cerebral cortex. IEEE Transactions on Medical Imaging. 2001;20(1):70-80. doi:10.1109/42.906426
20. Fischl B, Salat DH, Busa E, et al. Whole Brain Segmentation. Neuron. 2002;33(3):341-355. doi:10.1016/s0896-6273(02)00569-x
21. Fischl B, van der Kouwe A, Destrieux C, et al. Automatically parcellating the human cerebral cortex. Cereb Cortex. Jan 2004;14(1):11-22. doi:10.1093/cercor/bhg087
22. Deh K, Nguyen TD, Eskreis-Winkler S, et al. Reproducibility of quantitative susceptibility mapping in the brain at two field strengths from two vendors. Journal of Magnetic Resonance Imaging. 2015;42(6):1592-1600. doi:10.1002/jmri.24943
23. Li W, Wu B, Liu C. Quantitative susceptibility mapping of human brain reflects spatial variation in tissue composition. NeuroImage. 2011;55(4):1645-1656. doi:10.1016/j.neuroimage.2010.11.088
24. Roberts A, Spincemaille P, Nguyen T, Wang Y. Whole Brain Spherical Mean Value Filtering for Shadow Reduction in Quantitative Susceptibility Mapping. Paper No. 2172. presented at: International Society for Magnetic Resonance in Medicine; 2023; Toronto, Canada.
25. Roberts AG, Romano DJ, Sisman M, et al. Maximum Spherical Mean Value (mSMV) Filtering for Whole Brain Quantitative Susceptibility Mapping. arXiv pre-print server. 2023-04-22 2023;doi:None arxiv:2304.11476
26. Zhao W, Yang C, Tong R, et al. Relationship Between Iron Distribution in Deep Gray Matter Nuclei Measured by Quantitative Susceptibility Mapping and Motor Outcome After Deep Brain Stimulation in Patients With Parkinson's Disease. Journal of Magnetic Resonance Imaging. 2023;58(2):581-590. doi:10.1002/jmri.28574
Figures