0248
An open-source platform for image simulation, denoising, and super-resolution for point-of-care MRI devices1LUMC, Leiden, Netherlands
Synopsis
Keywords: Software Tools, Low-Field MRI, Simulation, denoising, super-resolution
Motivation: Low-field MRI is increasingly being applied in lower- and middle-income countries, but due to limited resources, training is scare.
Goal(s): Provide an open-source plateform for simulation, teaching, and a denoising and super-resolution pieline of low-field MRI images.
Approach: Using 3D maps of relaxation times, proton density, B0 and low-field system-specific parameters, such as limited gradient linearity, simulation of low-field images are created. Application of bm4d denoising and AI super-resolution on low-field images is additionally proposed.
Results: We provide an open-source graphical interface that can simulate and generate multiple sequences of low-field MRI, and a denoised and super-resolution pipeline increasing low-field image enhancement.
Impact: This study provides a simple open-source python platform to simulate point-of-care low-field MRI images, reflecting specific system-specific parameters for teaching purposes, and a fast advanced denoising and AI-based super-resolution pipeline for low-field images.
Introduction
Recent papers have highlighted the lack of accessible and sustainable medical imaging infrastructure in large portions of the world1-3. For MRI, there is not only a shortage of hardware, but also of trained personnel and training material. With low-field portable systems such as Hyperfine and Halbach-based systems starting to be sited in both academic and clinical settings, simple simulation software based on the physics and hardware components associated with low-field MRI could play an important role in increasing the knowledge base for users of such equipment. Various MRI simulators are available on the internet4-6, yet most of these software packages incur charges, and as far as we are aware, none provide a simulation of a low-field MRI environment. We present details of our initial developments in this area, with open-source simulation code written in Python, which is easily run on several different mobile devices. Additionally, we provide early work on an open-source image processing pipeline to incorporate advanced image processing methods such as state-of-the-art denoising and AI-based super-resolution.Materials and methods
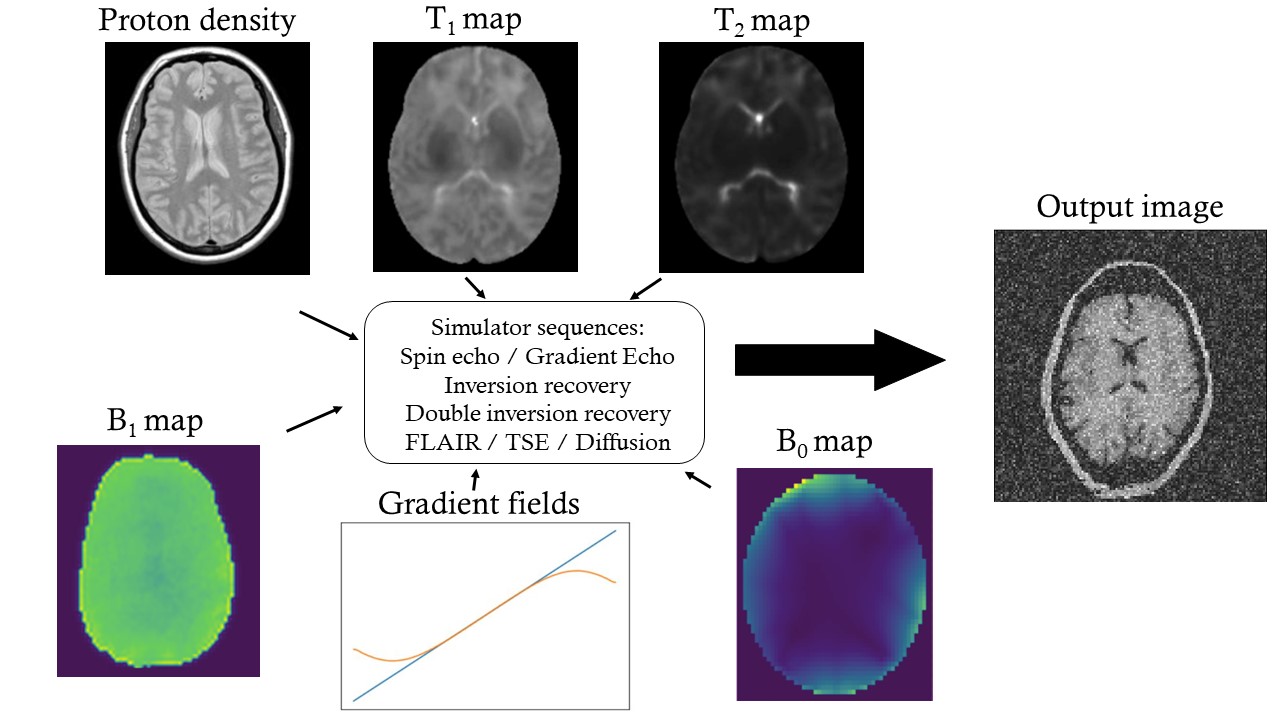
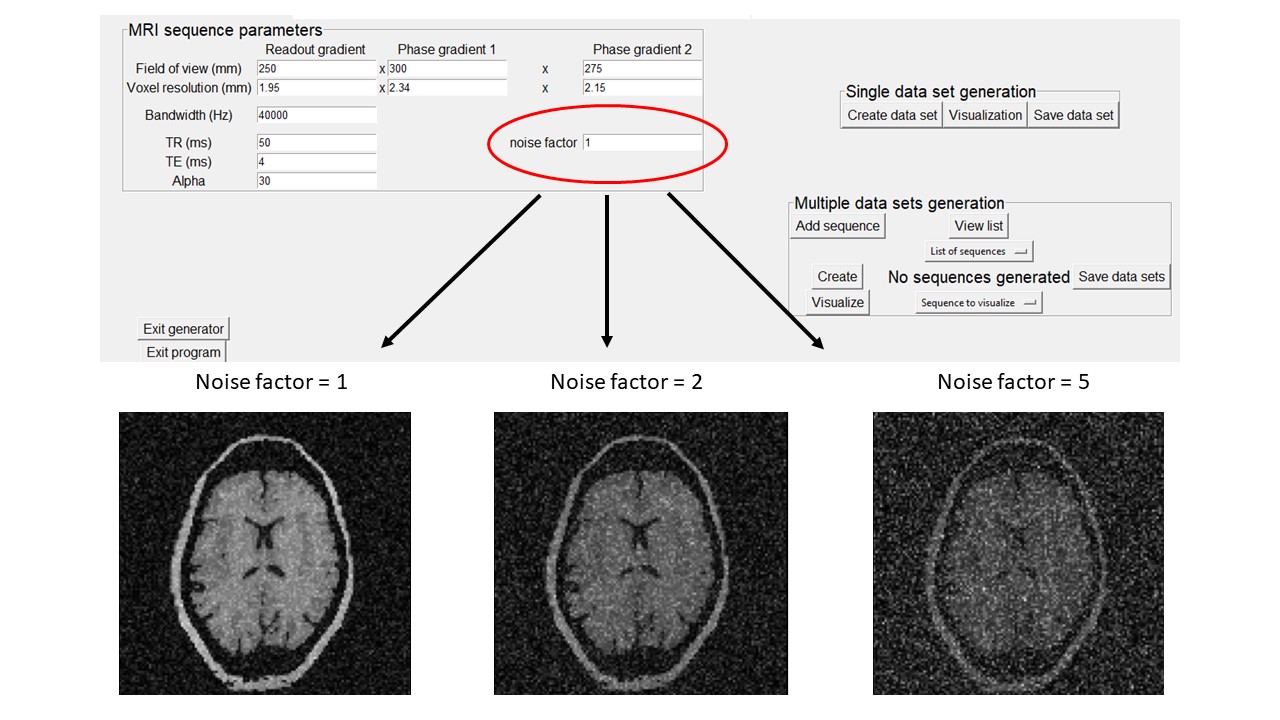
The simulation code is written in Python 3.7, can be run on a standard laptop computer, and uses the following freely downloadable packages: numpy, scipy, matplotlib, cv2, cmath, tkinter, and PIL. Calculations are performed primarily in the image domain. Morphometric data was derived from the ITis Duke model at 1 x 1 x 1 mm resolution. Since most POC studies are neurological, the tissue model was truncated at the level of the neck. Tissues were assigned to be white matter, gray matter, lipid, or cerebrospinal fluid with corresponding relaxation times from in vivo measurements at 46 mT. Inputs to the simulation package (Figure 1) include a 3-dimensional B1+ map, a 3-dimensional B0 map, and a 3-axis map of the magnetic field produced by the gradient coil: each of these can be easily adapted to see the effects on the image. Image processing includes simple high-pass and low-pass spatial, as well as non-local mean filtering. Sequences are gradient-echo, spin-echo, inversion recovery (IR), double IR, FLAIR, unbalanced-SSFP, diffusion, and TSE with different k-space trajectories (linear, in-out, out-in). The user can also input measured or estimated B0, T1, or T2 relaxation maps from the interface, and change the noise level, implemented as Gaussian noise with the appropriate mean and standard deviation (Figure 4). The parameters characterizing each sequence (TR, TE, etc.) can also be changed interactively in a 3D environment to view their effect.Simulations were performed using our 46 mT Halbach-array hardware system characteristics. The 3D B0 map was measured using an asymmetric turbo spin echo sequence; the 3D B1+ map from the Litz wire spiral elliptical solenoid was measured using a double angle method; the fields produced by the optimized gradient coils were simulated from the wire patterns using the Biot-Savart law. Each of these inputs is a simple 3D matrix of values: different maps can be easily changed or loaded.
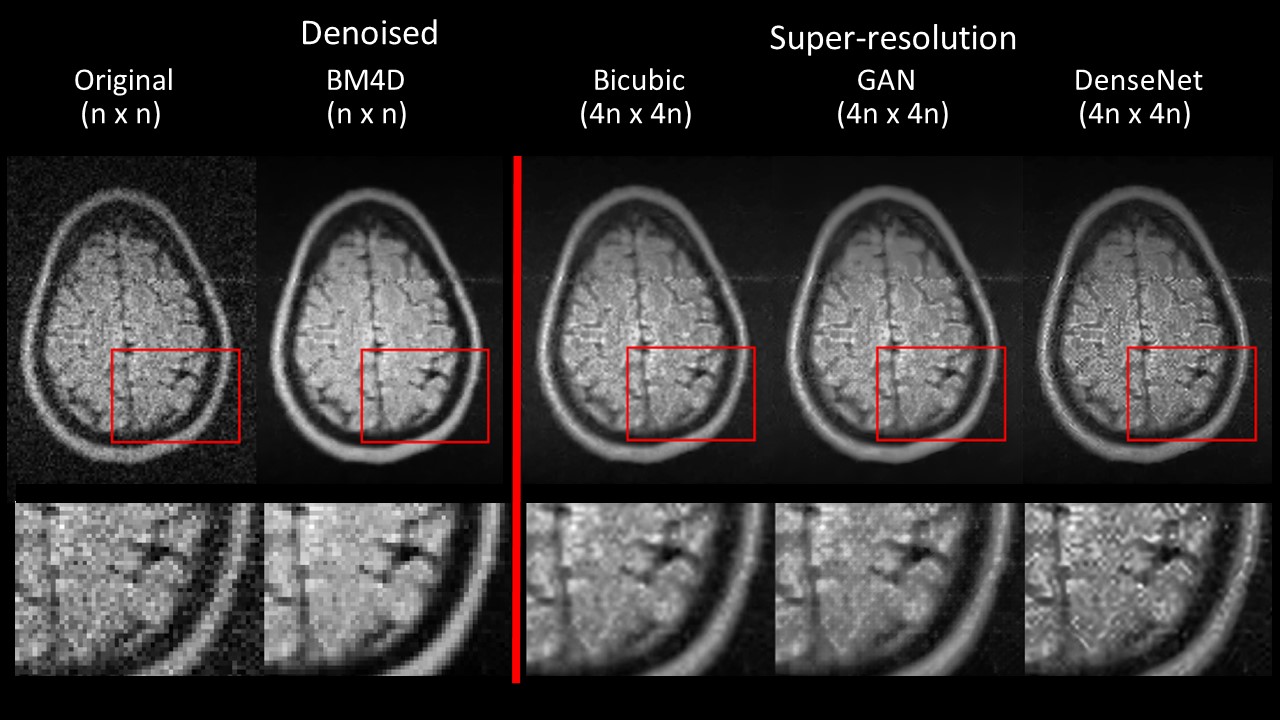
An implementation of bm4d7 was used to provide a fast, 3D denoising on in-vivo data. With only the standard deviation of the noise as a tunable parameter, this version of bm4d facilitates a streamlined and uncomplicated implementation. The following 2D super-resolution methods can be applied: Generative Adversarial Network8 (GAN), bicubic interpolation9, and a Dense Neural Network9 (DenseNet). These methods are publicly available, and the pre-trained models regarding neural networks were used for fast computation and application.
Results and discussion
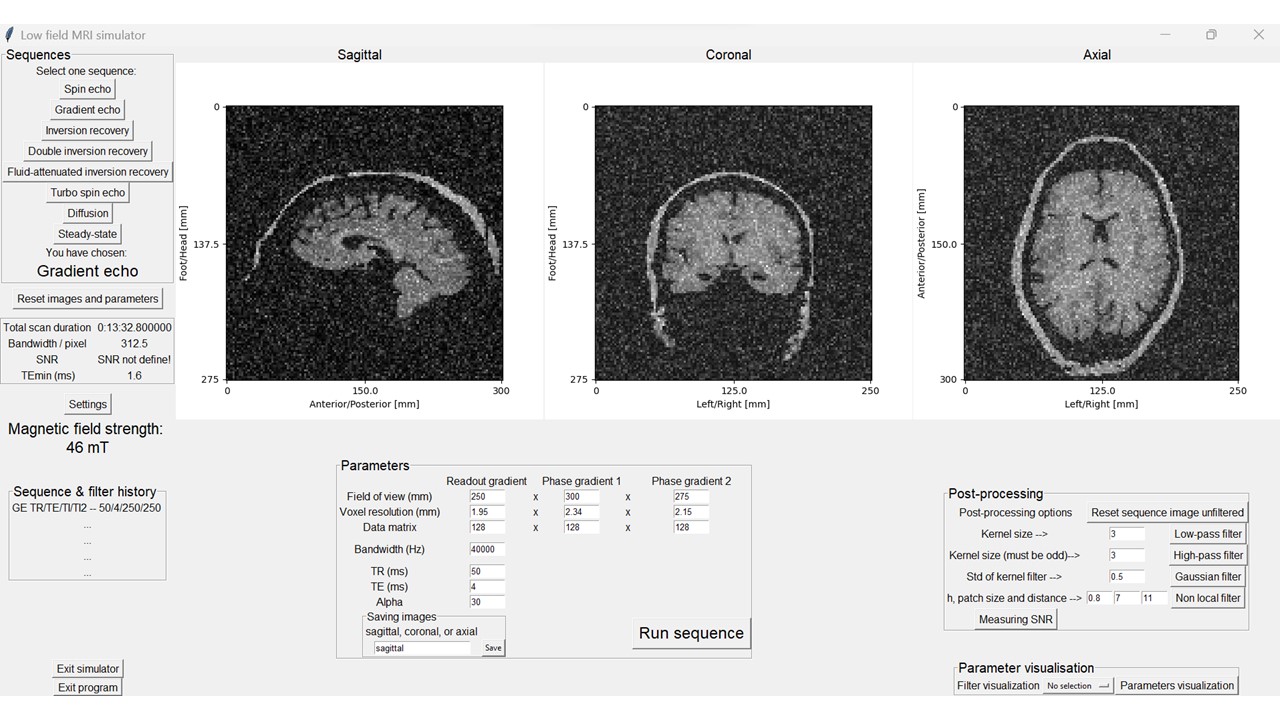
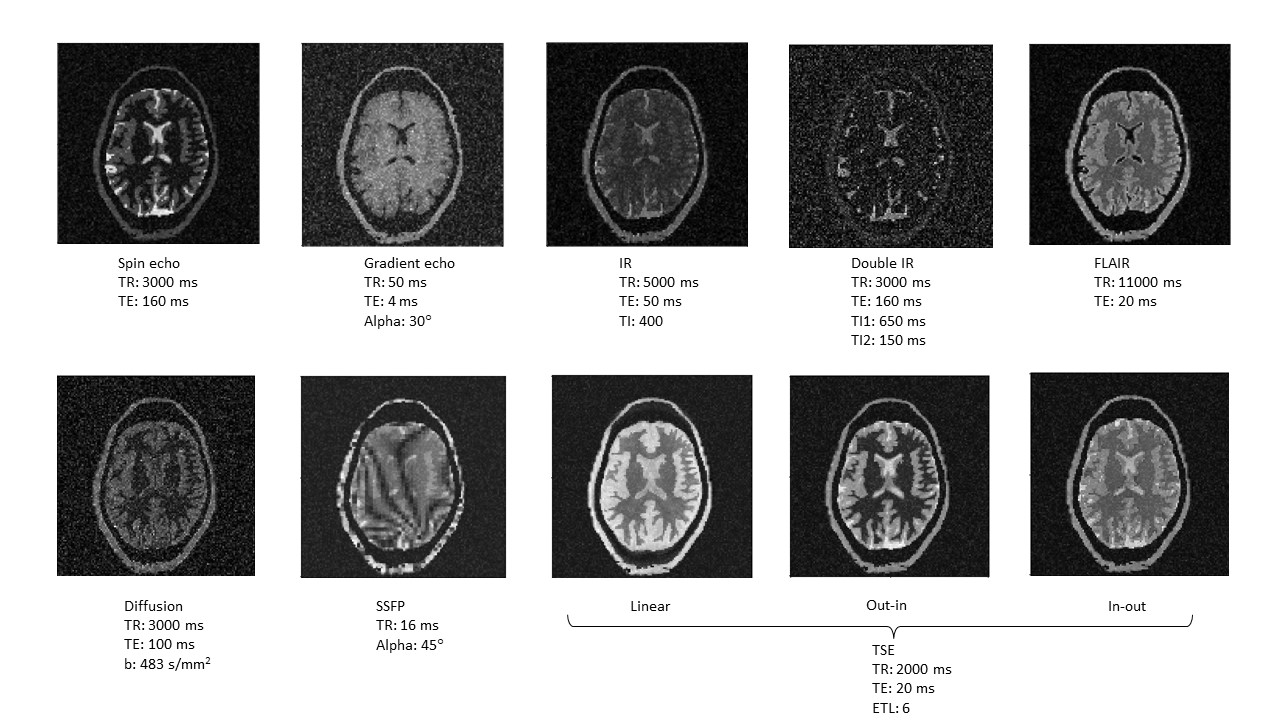
Figure 2 shows the user graphical interface, and gradient echo images in axial, sagittal, and coronal planes without any post-processing. The effects of the gradient non-linearities (particularly along the bore of the Halbach) are shown by distortions. Figure 3 shows axial images from different sequences with corresponding parameters. Figure 4 shows the part of the generator interface which offers a fast and user-friendly way to generate low and high SNR datasets that can be used for teaching purposes, or to provide inputs for AI testing data, for example. Figure 5 shows examples of denoising and super-resolution.Conclusion
This work represents an initial implementation of a simple simulation package especially designed for low-field POC MRI systems as well as low-field denoising and super-resolution. Compared to typical clinical scanners, effects such as B1 interactions with the body are negligible and subject-independent, whereas DB0 effects, limited and their time-dependence, as well as limited gradient strength, are much more important to consider. In the future, the platform will expand to enable k-space undersampling, iterative and model-based reconstructions.Acknowledgements
This project has received funding from Horizon 2020 ERC Advanced PASMAR 101021218.References
1. Ogbole GI, Adeyomoye AO, Badu-Peprah A, Mensah Y, Nzeh DA. Survey of magnetic resonance imaging availability in West Africa. Pan Afr Med J 2018;30:240.
2. Geethanath S, Vaughan JT, Jr. Accessible magnetic resonance imaging: A review. J Magn Reson Imaging 2019.
3. Anazodo UC, Ng JJ, Ehiogu B, Obungoloch J, Fatade A, Mutsaerts H, Secca MF, Diop M, Opadele A, Alexander DC, Dada MO, Ogbole G, Nunes R, Figueiredo P, Figini M, Aribisala B, Awojoyogbe BO, Aduluwa H, Sprenger C, Wagner R, Olakunle A, Romeo D, Sun Y, Fezeu F, Orunmuyi AT, Geethanath S, Gulani V, Nganga EC, Adeleke S, Ntobeuko N, Minja FJ, Webb AG, Asllani I, Dako F, Conesortium for Advancement of MRIE, Research in A. A Framework for Advancing Sustainable MRI Access in Africa. NMR Biomed 2022:e4846.
4. https://www.corsmed.com/
5. https://pstnet.com/products/iaci-mri-simulation-software/
6. https://scanlabmr.com/
7. https://pypi.org/project/bm4d/
8. https://pypi.org/project/super-resolution/#description
9. https://github.com/yjn870/SRDenseNet-pytorch
Figures