0247
ProFit-1D for quantifying J-difference edited data at 3T1Advanced Imaging Research Center, The University of Texas Southwestern, Dallas, TX, United States, 2Max Planck Institute for Biological Cybernetics, Tübingen, Germany, 3Biomedical Engineering, University of Texas Dallas, Dallas, TX, United States, 4Department of Internal Medicine, The University of Texas Southwestern, Dallas, TX, United States, 5Department of Neurology, University of Texas Southwestern Medical Center, Dallas, TX, United States, 6Department of Neurological Surgery, The University of Texas Southwestern, Dallas, TX, United States, 7The University of Texas Southwestern, Dallas, TX, United States
Synopsis
Keywords: Software Tools, Brain, MRS, fitting, editing, GABA, 2HG
Motivation: Reproducible and accurate fitting of the MR spectrum is critical in estimating metabolite concentrations. We have previously developed a fitting software called ProFit-1D which was shown to fit 9.4T sLASER data from the human brain with high accuracy and precision.
Goal(s): Here, ProFit-1D was optimized for fitting 3T J-difference edited data.
Approach: ProFit-1D was evaluated for accuracy and precision in simulated and in vivo 2HG-edited and GABA-edited data and compared to that of Gannet and LCModel
Results: ProFit-1D was found to be more accurate than LCModel in fitting the GABA-edited and 2HG-edited data and more precise than Gannet in fitting the GABA-edited spectra.
Impact: Here, we show that ProFit-1D produces more accurate measurements than LCModel and more precise measurements than Gannet in simulated and in vivo spectra from tumors and healthy participants. ProFit-1D is a promising fitting software with high clinical applicability.
Purpose
Magnetic resonance spectroscopy (MRS) allows for noninvasive quantification of brain neurochemicals implicated in a wide variety of diseases such as tumors1. Accurate and precise spectral fitting is critical for these measurements. We have previously developed a fitting algorithm called ProFit-1D which uses adaptive spectral baseline determination and a cost function based on the frequency-domain residual and time-domain residual in the error minimization process2.ProFit-1D was shown to produce fits with slightly higher accuracy than that of LCModel and also high precision, which was however, slightly lower than that of LCModel2.ProFit-1D, however, was optimized for 9.4T sLASER data. Here, ProFit-1D was optimized for 3T data acquired with J-difference editing, the gold-standard for detecting low-concentration metabolites, and evaluated for accuracy and precision in simulated and in vivo GABA-edited and 2HG-edited data acquired in healthy participants (GABA-editing) and brain tumor patients (2HG-editing). The performance of ProFit-1D was compared to that of Gannet3 and LCModel4, two commonly-used edited-MRS fitting software.
Methods
In ProFit-1D, the fitting range was limited to 4.05-1.75 ppm and the metabolites present in the edited spectrum. The adaptive baseline algorithm was altered so that the maximum candidate baseline flexibility was changed from 10 to 7 effective dimensions per ppm while Akaike’s information criterion (smoothing factor) was changed from 15 to 5 as done previously3 to avoid overfitting the 3T spectra.Data were acquired on a Philips Achieva 3T with TR=2s, 2048 points, and a spectral width=2 kHz. GABA-edited data was acquired in 12 healthy volunteers (6 female, 24.8±2.3 years) in a (3 cm)3 region in the occipital lobe (OCC) and in 8 healthy volunteers (6 female, 26±2.6 years) in a 2.5x3.5x3cm3 region in the medial prefrontal cortex (mPFC). Other parameters included 320-transients, TE=80ms and edit-ON/edit-OFF=1.9/1.5ppm. 2HG-edited data were acquired 5 glioma patients (5 female, 41.6±8.1 years) with a TE/TR=70ms/2s, edit-ON/edit-OFF=1.9/7.5 ppm and 352-transients. The voxel varied in location and was (3.5 cm)3 or (3 cm)3 depending on the tumor size. Data were preprocessed using Gannet4 with retrospective time-domain phase and frequency correction6.
The accuracy and precision of ProFit-1D2, Gannet 3.1.34, and LCModel5, were evaluated on in vivo-quality spectra which were simulated with FID-A6 (12-17 simulations per parameter). Baselines were created from cubic spline fits with manual definition of baseline points to previously-acquired GABA-edited spectra8,9. LCModel fits to the edit-OFF spectra, Gannet fits to the OCC difference spectra (GABA), and ProFit fits to the 2HG-edited spectra (2HG) were used as starting values in the simulated healthy and glioma spectra. To evaluate the precision in fitting the in vivo GABA-edited spectra, two test-retest spectra (160 averages each) were created from all available spectral averages and used to calculate coefficients-of-variation (CoV).
Results
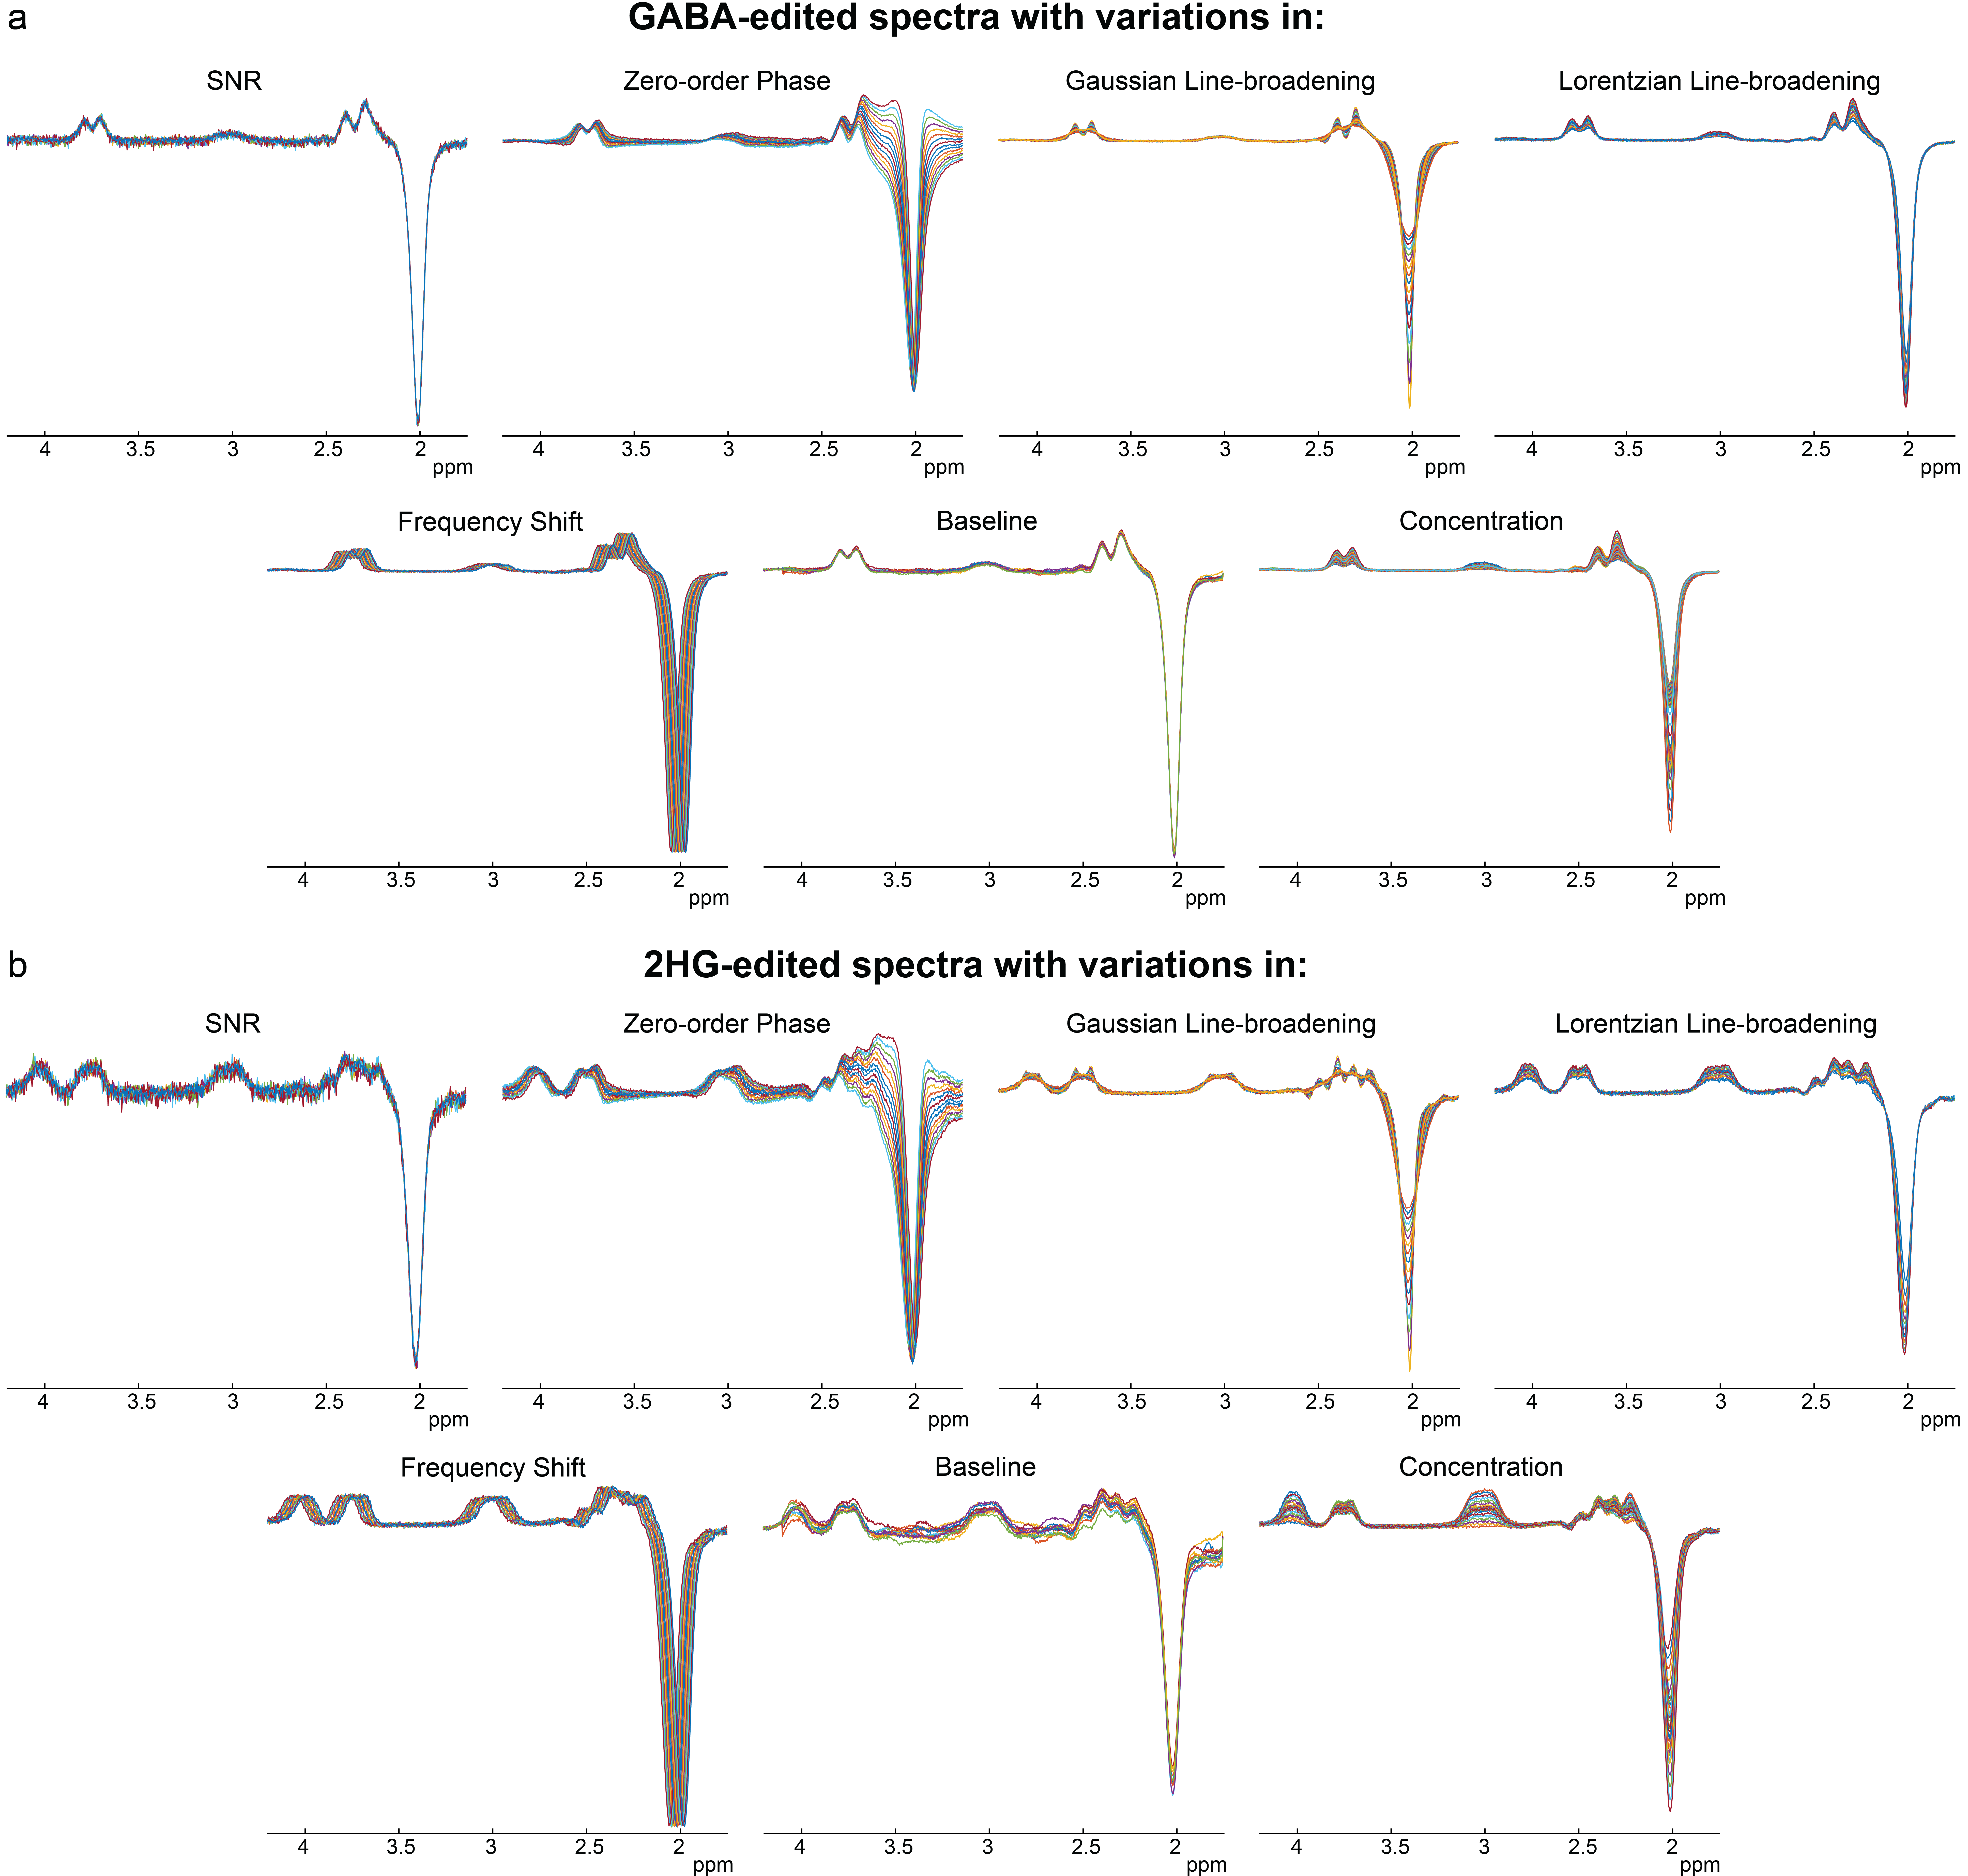

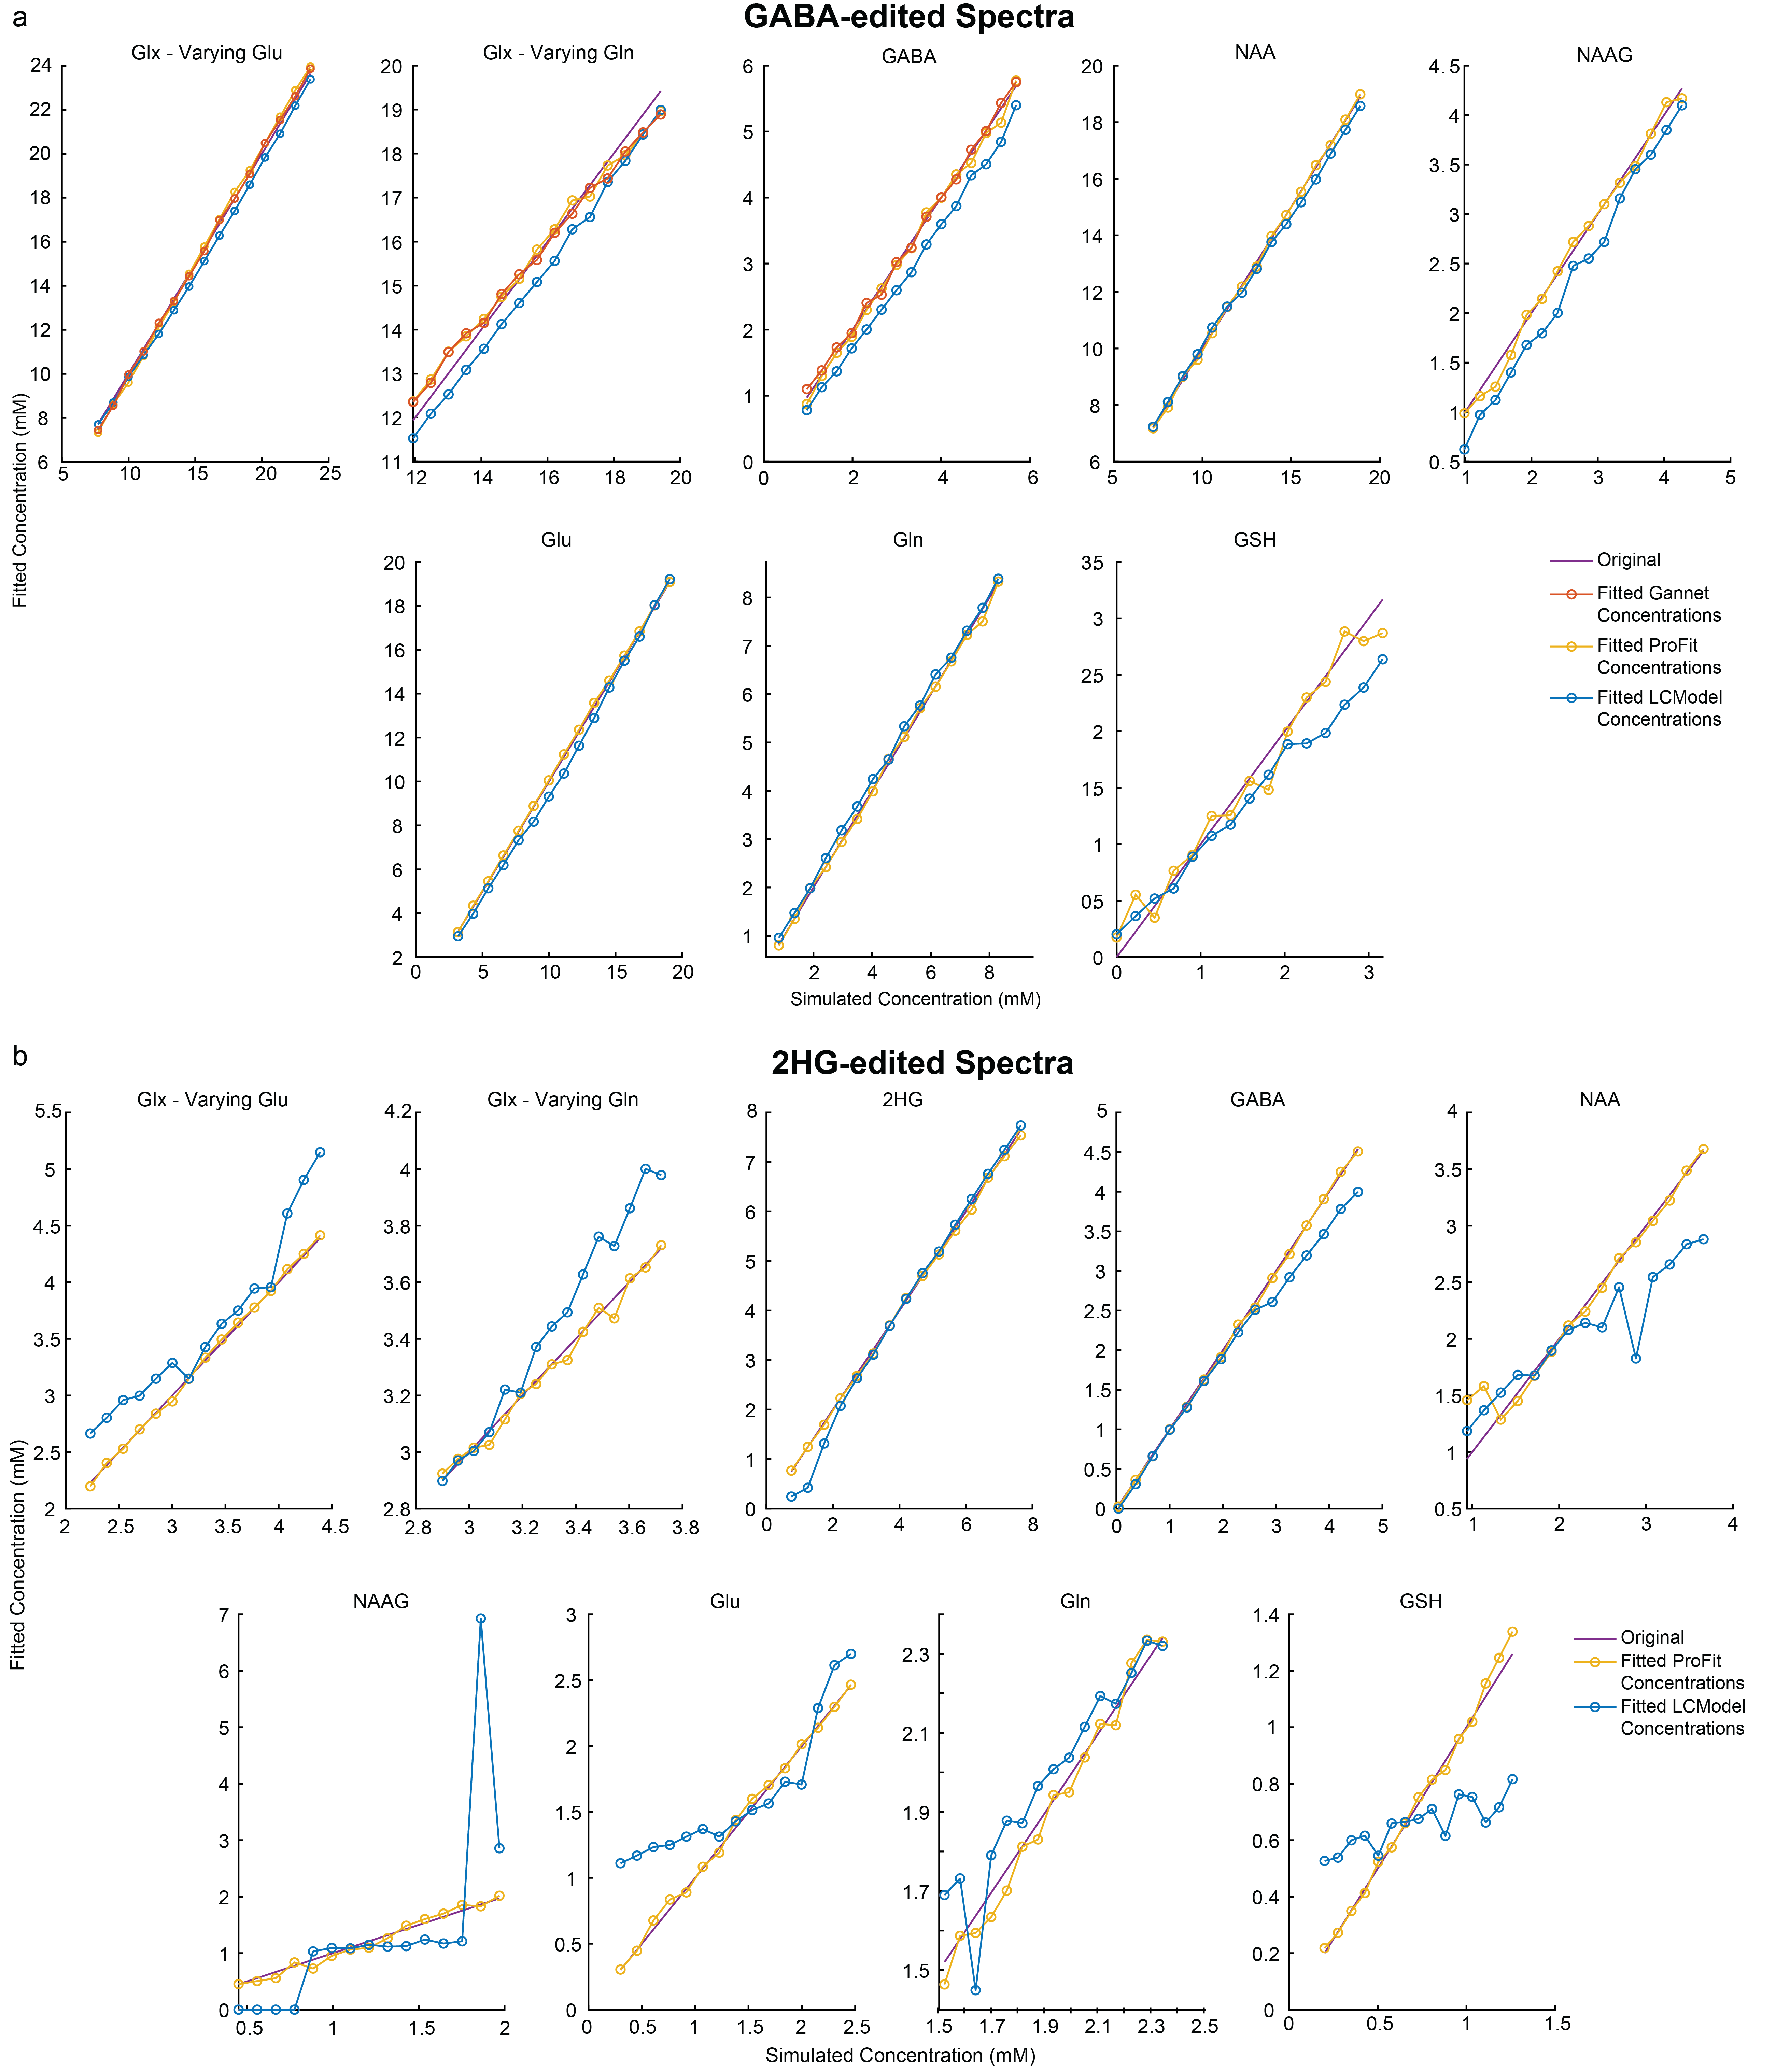
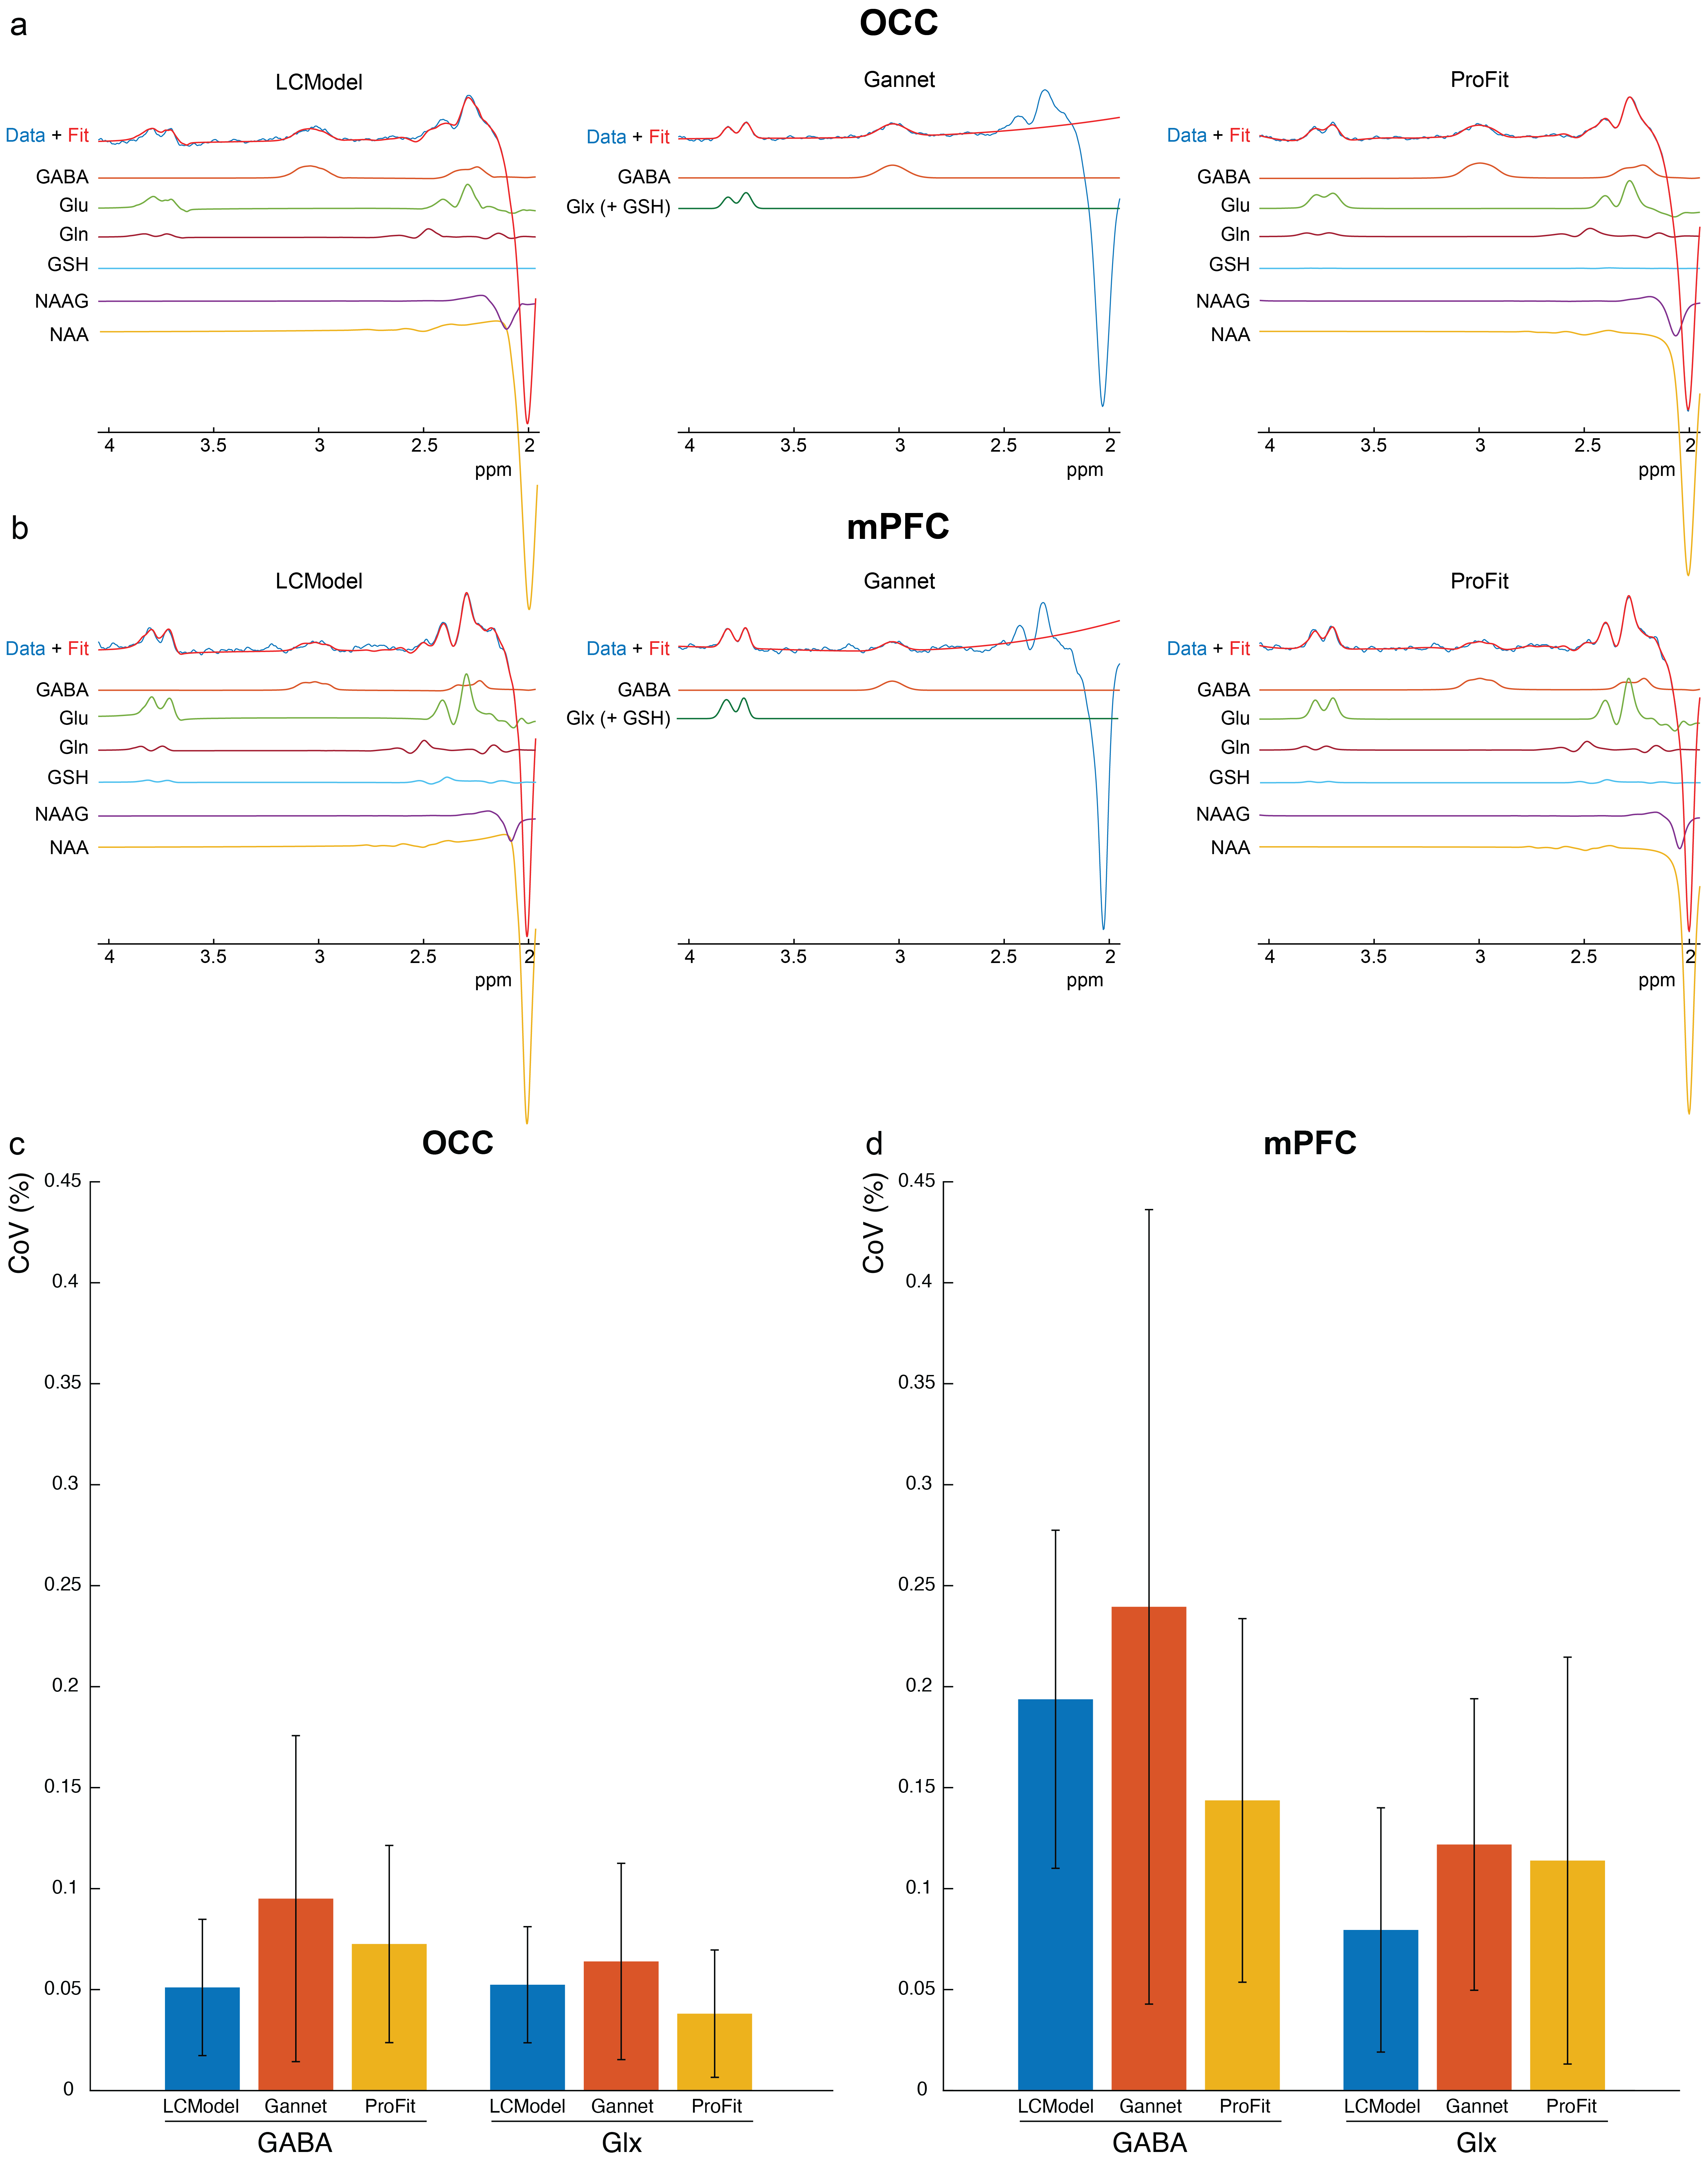
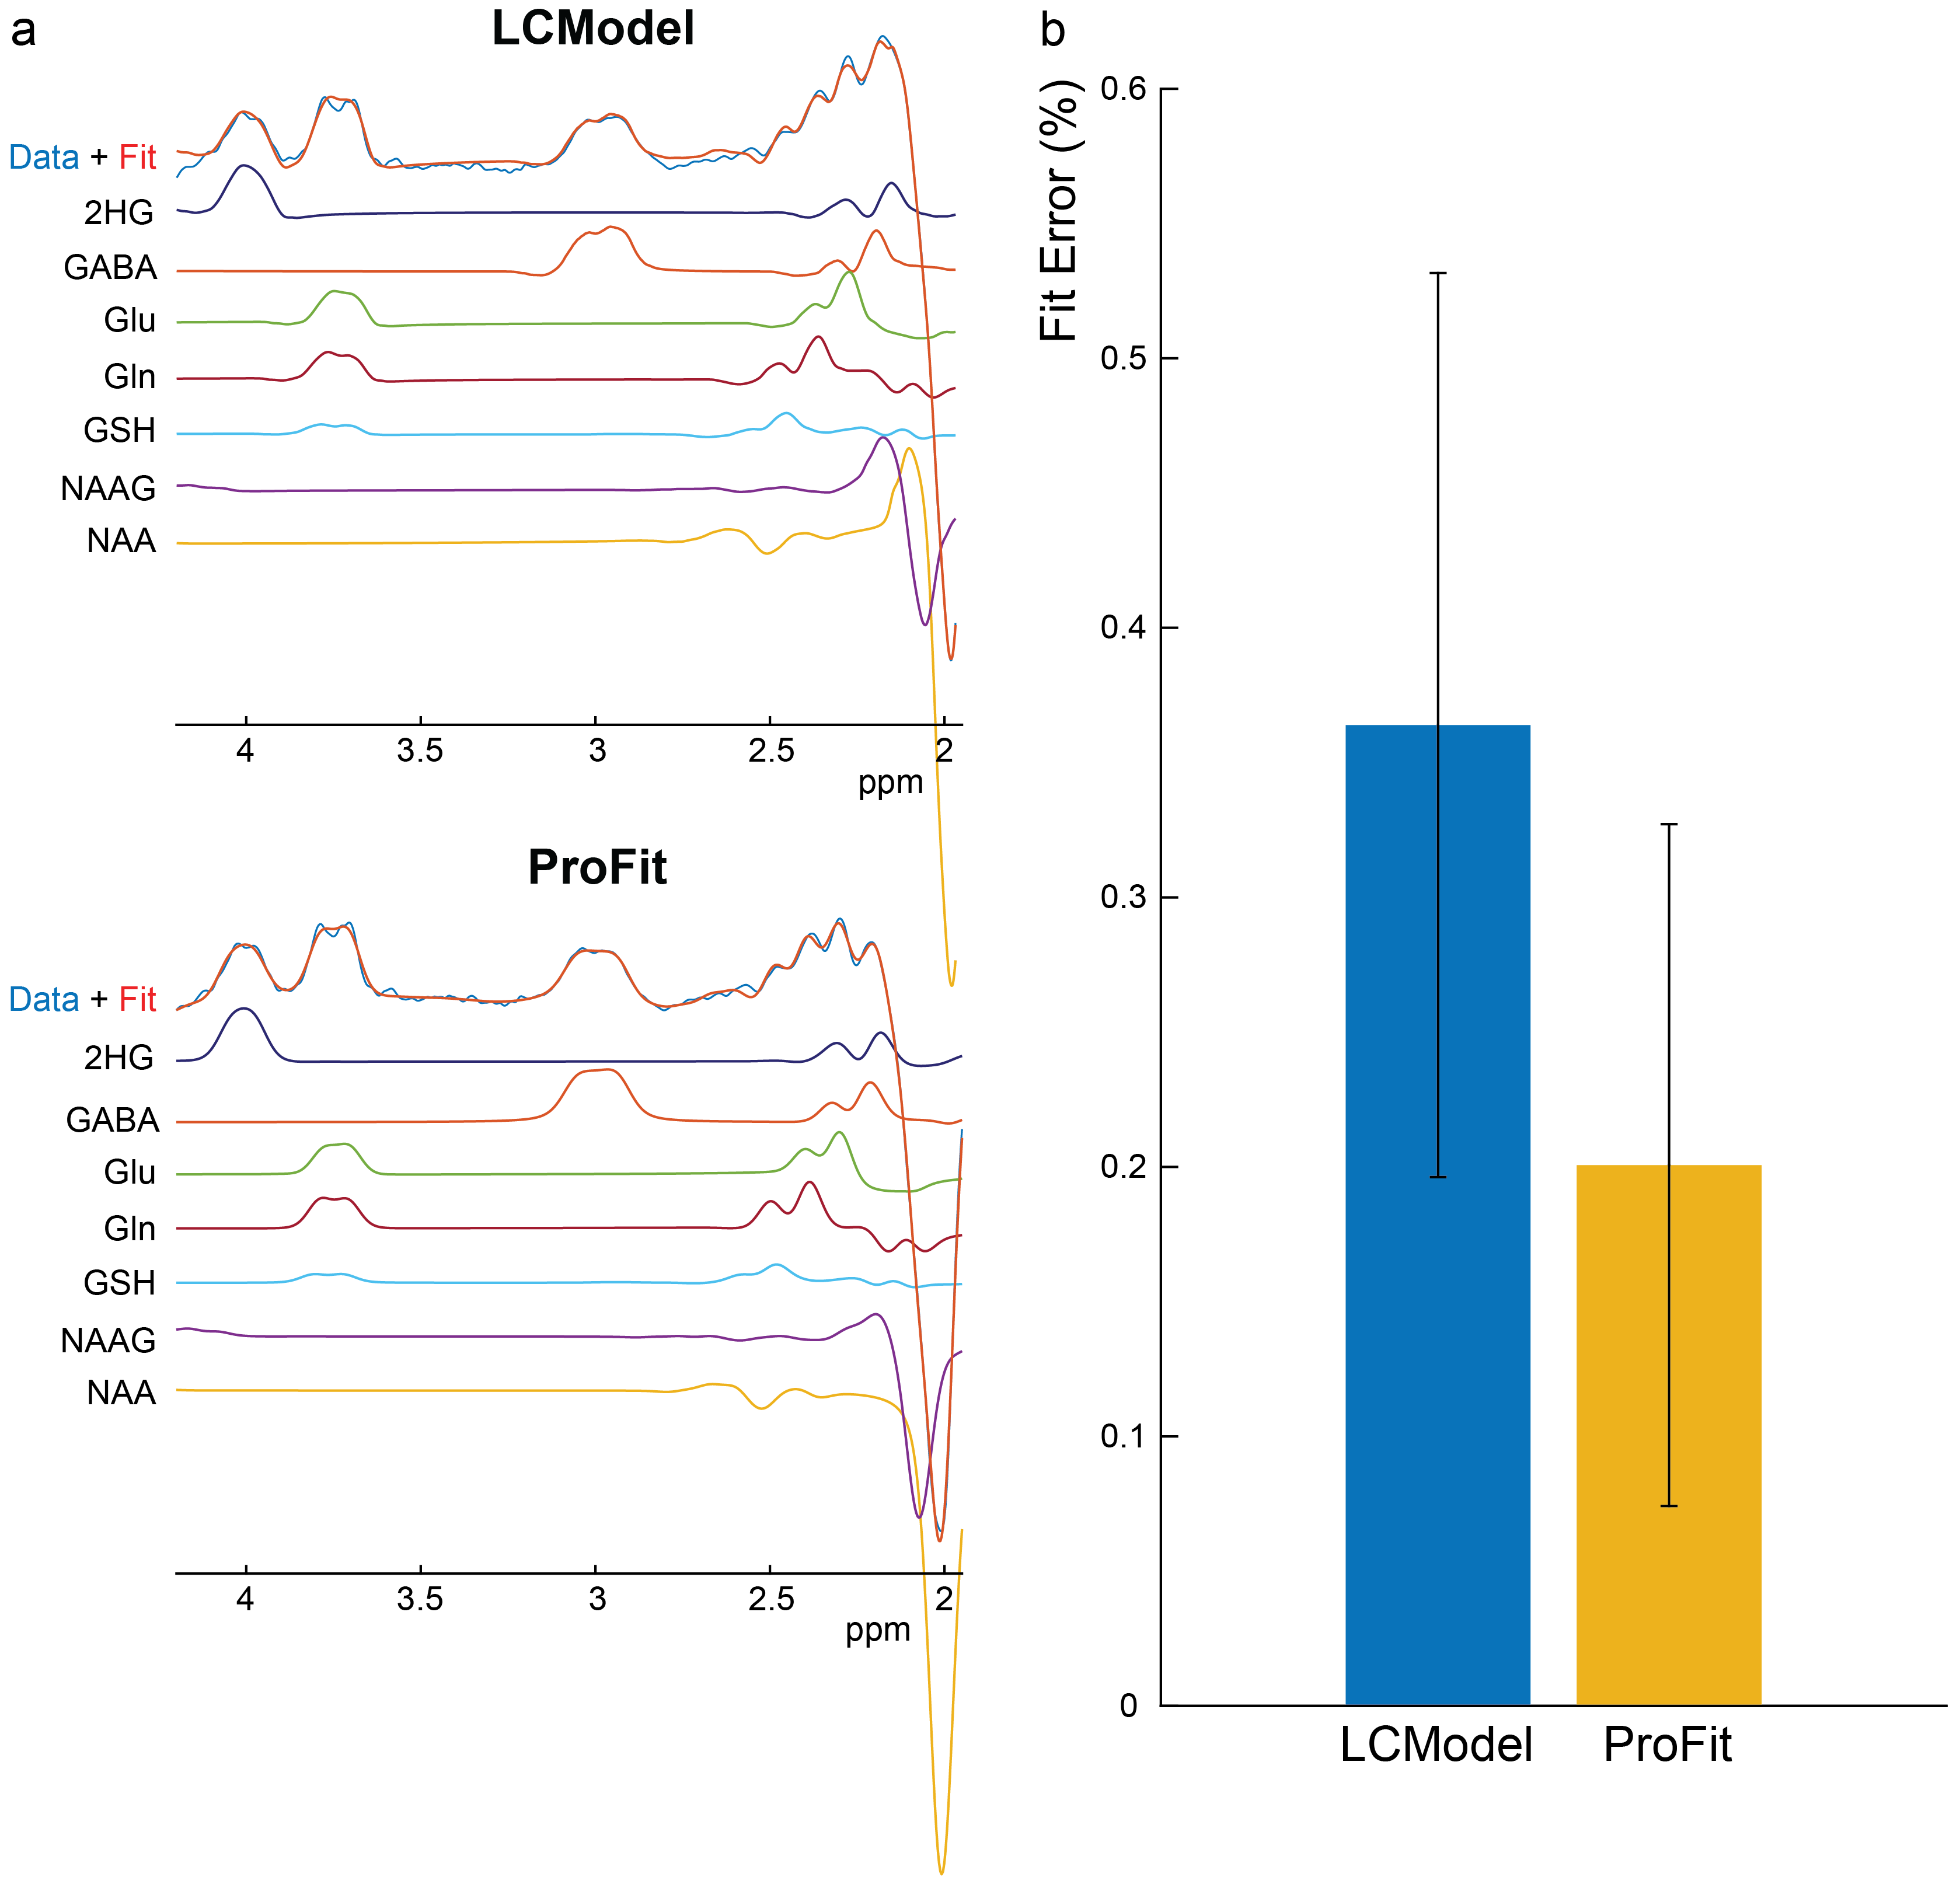
Figure 1 shows the simulated spectra with parameter variations. Percent changes in fitted metabolite concentrations for each simulated parameter variation (Figure 2) show that ProFit-1D generally measures GABA and Glx more accurately from the GABA-edited spectra than LCModel and GABA more accurately and precisely than Gannet. For the 2HG-edited spectra, ProFit-1D is slightly more accurate than LCModel when measuring GABA and Glx and slightly more precise than LCModel when measuring 2HG. Fitted versus simulated concentrations are shown in Figure 3. ProFit and Gannet fit Glx and GABA from the GABA-edited spectra more accurately than LCModel. For the 2HG-edited spectra, ProFit-1D measures all metabolites more accurately than LCModel. Figure 4ab show high-quality fits to the in vivo GABA-edited spectra. Figure 4c show the in vivo CoVs for the GABA-edited spectra showing more precise GABA and Glx measurements with ProFit-1D and LCModel than with Gannet. Figure 5a shows high-quality fits to the in vivo 2HG-edited spectra. Figure 5b shows that the 2HG fit error is 45% higher with LCModel than with ProFit-1D.Discussion
Here, we show that ProFit-1D produces more accurate measurements than LCModel and more precise measurements than Gannet in simulated and in vivo spectra from tumors and healthy participants. To date, most fitting pipelines have been optimized and validated on healthy control data2,4,10 and in regions with favorable measurement conditions11 (e.g. high signal-to-noise, low linewidths). Optimization and validation of spectral fitting software in challenging regions and in patient populations is important for clinical applicability. The mPFC evaluated here is a difficult region due to the nearby air-tissue interface which results in larger linewidths. Brain tumor patients are also more challenging to scan due to the inherently lower signal-to-noise and challenging shimming conditions and baseline distortions caused by adjacent metal implants from prior surgical resections. Despite these challenges, ProFit-1D was able to produce high-quality fits to the 2HG-edited and GABA-edited data.Acknowledgements
This work was funded by the Cancer Prevention and Research Institute of Texas (CPRIT) (Grant Number: RR180056, Principal Investigator: Anke Henning, PhD).References
1. Horska and Barker, Neuroimaging Clin N Am. 2010
2. Borbath et al., Magn Reson Med. 2021
3. Wilson, Magn Reson Med. 2020
4. Edden et al., J Magn Reson. Imaging. 2014
5. Provencher, NMR Biomed. 2001
6. Near et al., Magn Reson Med. 2015
7. Simpson et al., Magn Reson Med. 2015
8. Chan et al., Magn. Reson. Med. 2021
9. Wijtenburg et al., J Magn Reson Imaging. 2013
10. Oeltzschner et al., J Neurosci Methods. 2020
11. Zollner et al., NMR Biomed. 2022
Figures