0243
Brain Asymmetry Suite: a framework for the comprehensive examination of the brain’s asymmetry1QMENTA, Boston, MA, United States
Synopsis
Keywords: Software Tools, Software Tools, brain asymmetry, rs-fMRI, DTI, connectome
Motivation: Hemispheric asymmetries have shown a great potential for early detection of a variety of neurological disorders such as traumatic brain injury. However, the lack of consistency in study outcomes is a common issue, largely stemming from the restricted sample sizes and methodological variations.
Goal(s): To develop a unified framework for the processing of multimodal imaging data for a comprehensive evaluation of brain asymmetry.
Approach: Combination of state-of-the-art algorithms for multimodal imaging data to estimate different metrics of brain asymmetry.
Results: By providing comprehensive measurements of brain asymmetry, this framework has the potential for early detection and monitoring of neurological disease.
Impact: The study aims to address inconsistencies in hemispheric asymmetry research by developing a unified framework for the estimation of brain asymmetry and offers a promising avenue for early detection and monitoring of neurological diseases.
Introduction
Hemispheric asymmetries are an accepted aspect of human brain organization1 that have long captured the interest of neuroscientists. Despite evidenced notions such as hemispheric language dominance, as well as the observation that asymmetry patterns are initialized in utero, brain laterality is a complex trait that varies greatly amongst individuals. To further this complexity, altered hemispheric asymmetry may be associated with several neurological and neurodegenerative disorders, including traumatic brain injury2 among others. This has led to the investigation of asymmetry indices as potential biomarkers in clinical research. Thus far, indices have been based on volumetric3, cortical thickness4, white matter integrity5, and functional imaging measures6. Unfortunately, results across studies are often inconsistent due to limited sample sizes and methodological heterogeneities7.In this work, in order to facilitate fully automatic and tailored preprocessing, and the extraction of imaging-related asymmetry biomarkers, we propose the Brain ASymmetry Suite (BASS). BASS is a consolidated framework that facilitates computation of volumetric/cortical thickness, functional and structural network asymmetry indices.
Methods
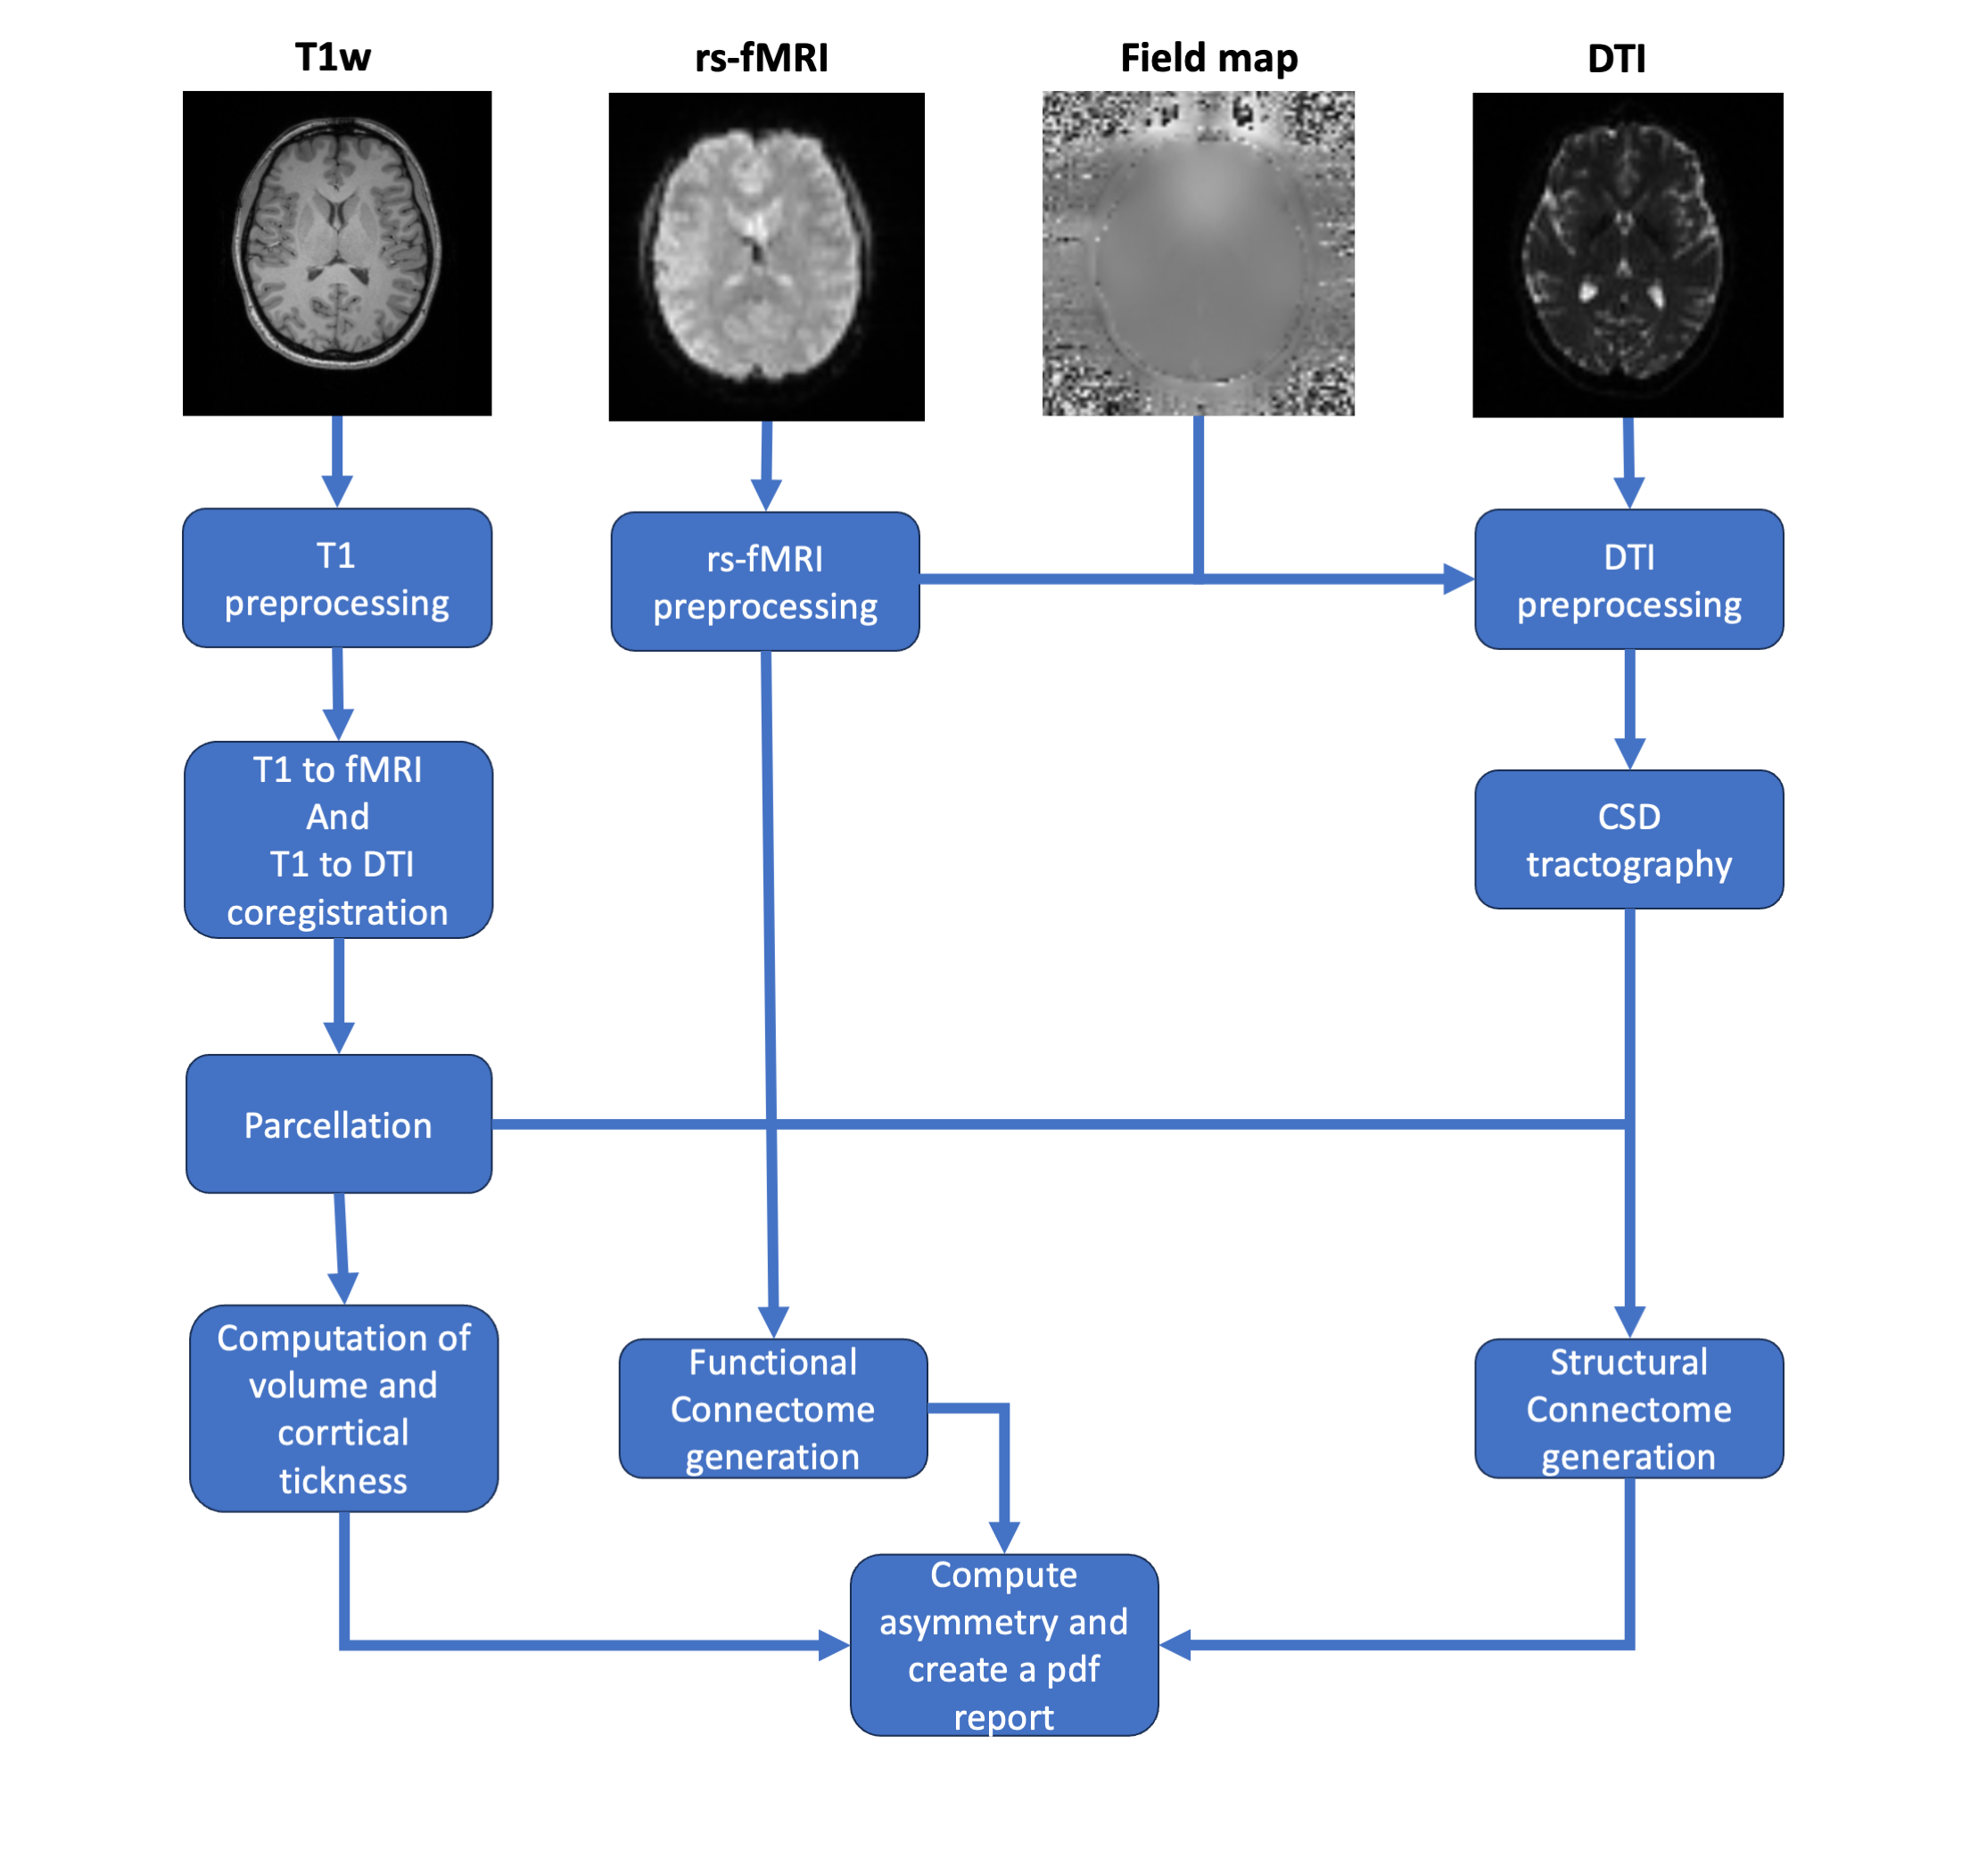
BASS is a comprehensive fully automatic framework that simplifies the procedure for extraction of asymmetry-related biomarkers. To extract them, BASS requires T1w, fMRI and DTI images. Additionally, a field map is required to correct for any susceptibility-induced artifacts affecting the fMRI and DTI images.The BASS framework begins by applying a tailored preprocessing of the input images using state-of-the-art image processing algorithms. The T1w images are denoised and bias-field corrected. Then, the T1w image is parcellated into 80 distinct brain regions of interest drawn from the Desikan-Killiany atlas (40 regions of interest per hemisphere). Furthermore, BASS performs a tailored preprocessing of the fMRI and DTI images. For the fMRI image, the workflow performs well-known fMRI preprocessing steps including slice timing correction, motion correction, and correction for susceptibility-induced distortions, as well as estimation and removal of the potential confounds. The preprocessing of DTI image includes denoising, correction for Gibbs artifacts, eddy-current and motion correction as well as correction for susceptibility-induced distortions.
After preprocessing, BASS computes the cortical volume and thickness from the T1w. In parallel, BASS also corregisters the T1w image to the functional and diffusion space and the functional and structural connectomes are reconstructed respectively. Additionally, for both structural and functional connectome it computes the graph-based measures - node degree and local efficiency. Finally, for each side of the homologous ROIs (and nodes in the connectomes) it calculates two key asymmetry metrics:
- Asymmetry Index (AI), calculated as $$$AI = 100 * (\frac{| right − left |}{right+left})$$$, quantifies the difference between the left and right portion of the homologous region
- Asymmetry Percentage (AP), calculated as $$$AP=100 − (100 * \frac{left}{right})$$$, represents the degree of asymmetry as a percentage
Results
We validated the framework by running BASS on 600 subjects from the Human Connectome Project dataset. We performed a comprehensive quality control to ensure that the images were adequately preprocessed. In general, we found the volumetric asymmetries to be in line with the literature: volumetric asymmetry follows a fronto-occipital pattern, i.e. many of the frontal regions show leftward lateralization, while many of the temporal-occipital regions exhibit rightward lateralization8. On the other hand, we found leftward functional network asymmetries in the orbitofrontal gyrus, as well leftward structural network asymmetry in the amygdala, cingulate, and middle occipital gyrus which is also in line with the literature9.Discussion/Conclusion
By facilitating the quantification of brain asymmetry, this framework holds the potential to open new avenues for research in fields ranging from developmental neuroscience to neuropsychology. Moreover, it may broaden our understanding of the relationships between brain asymmetry and various neurological and psychiatric conditions, with a view to earlier, more accurate diagnoses and interventions.Acknowledgements
No acknowledgement found.References
1. Toga, A. W., & Thompson, P. M. (2003). Mapping brain asymmetry. Nature reviews. Neuroscience, 4(1), 37–48.
2. Ross, D. E. et al. (2023). Journey to the other side of the brain: asymmetry in patients with chronic mild or moderate traumatic brain injury. Concussion (London, England), 8(1), CNC101.
3. Takao, H. et al. (2011). Gray and white matter asymmetries in healthy individuals aged 21-29 years: a voxel-based morphometry and diffusion tensor imaging study. Human brain mapping, 32(10)
4. Zhou, D. et al. (2013). Cortical thickness asymmetry from childhood to older adulthood. NeuroImage, 83, 66–74.
5. Song, J. W. et al. (2015). Asymmetry of White Matter Pathways in Developing Human Brains. Cerebral cortex (New York, N.Y. : 1991), 25(9), 2883–2893.
6. Ahmad, Z. et al. (2003). Auditory comprehension of language in young children: neural networks identified with fMRI. Neurology, 60(10), 1598–1605.
7. Kong, X. Z. et al. (2022). Mapping brain asymmetry in health and disease through the ENIGMA consortium. Human brain mapping, 43(1), 167–181.
8. Kong, X. Z. et al. (2018). Mapping cortical brain asymmetry in 17,141 healthy individuals worldwide via the ENIGMA Consortium. Proceedings of the National Academy of Sciences of the United States of America, 115(22), E5154–E5163.
9. Sun, Yu, et al. "Asymmetry of hemispheric network topology reveals dissociable processes between functional and structural brain connectome in community-living elders." Frontiers in aging neuroscience 9 (2017): 361.
Figures