0242
A Repository-Integrated Quantitative Imaging Data Analysis Pipeline for Enabling Multi-Centre Clinical Biomarker Studies1Department of Radiology, University of Cambridge, Cambridge, United Kingdom, 2Department of Health Sciences, University of Manchester, Manchester, United Kingdom, 3Royal Marsden NHS Foundation Trust, Sutton, United Kingdom, 4Department of Radiotherapy and Imaging, Institute for Cancer Research, London, United Kingdom, 5Department of Oncology, University of Oxford, Oxford, United Kingdom, 6Department of Medicine, University College London, London, United Kingdom, 7Christie Medical Physics and Engineering, The Christie NHS Foundation Trust, Manchester, United Kingdom, 8Department of Radiology, The Christie NHS Foundation Trust, Manchester, United Kingdom
Synopsis
Keywords: Software Tools, Data Processing, Data Analysis
Motivation: Robust evaluation of novel quantitative imaging biomarkers in multi-centre imaging trials requires harmonised workflow for storage, quality control and analysis of imaging data to facilitate clinical translation.
Goal(s): To establish a standardised, repository-integrated framework for quantitative MR data analysis to aid reproducibility.
Approach: A software container for quantitative MR data analysis was created using Docker, integrated with the XNAT imaging repository and demonstrated using example data.
Results: Repository-integrated software was used to generate quantitative maps of T1, ADC and hypoxia, as well as DCE and IVIM modelling parameters in primary and nodal tumours from a patient with head-and-neck cancer.
Impact: Quantitative MR biomarker translation can be accelerated by standardisation of analysis protocols across multi-centre trials. Integration of containerised, user-configurable data analysis software within imaging repositories will improve repeatability and lower the barrier for entry to clinical trial involvement.
INTRODUCTION
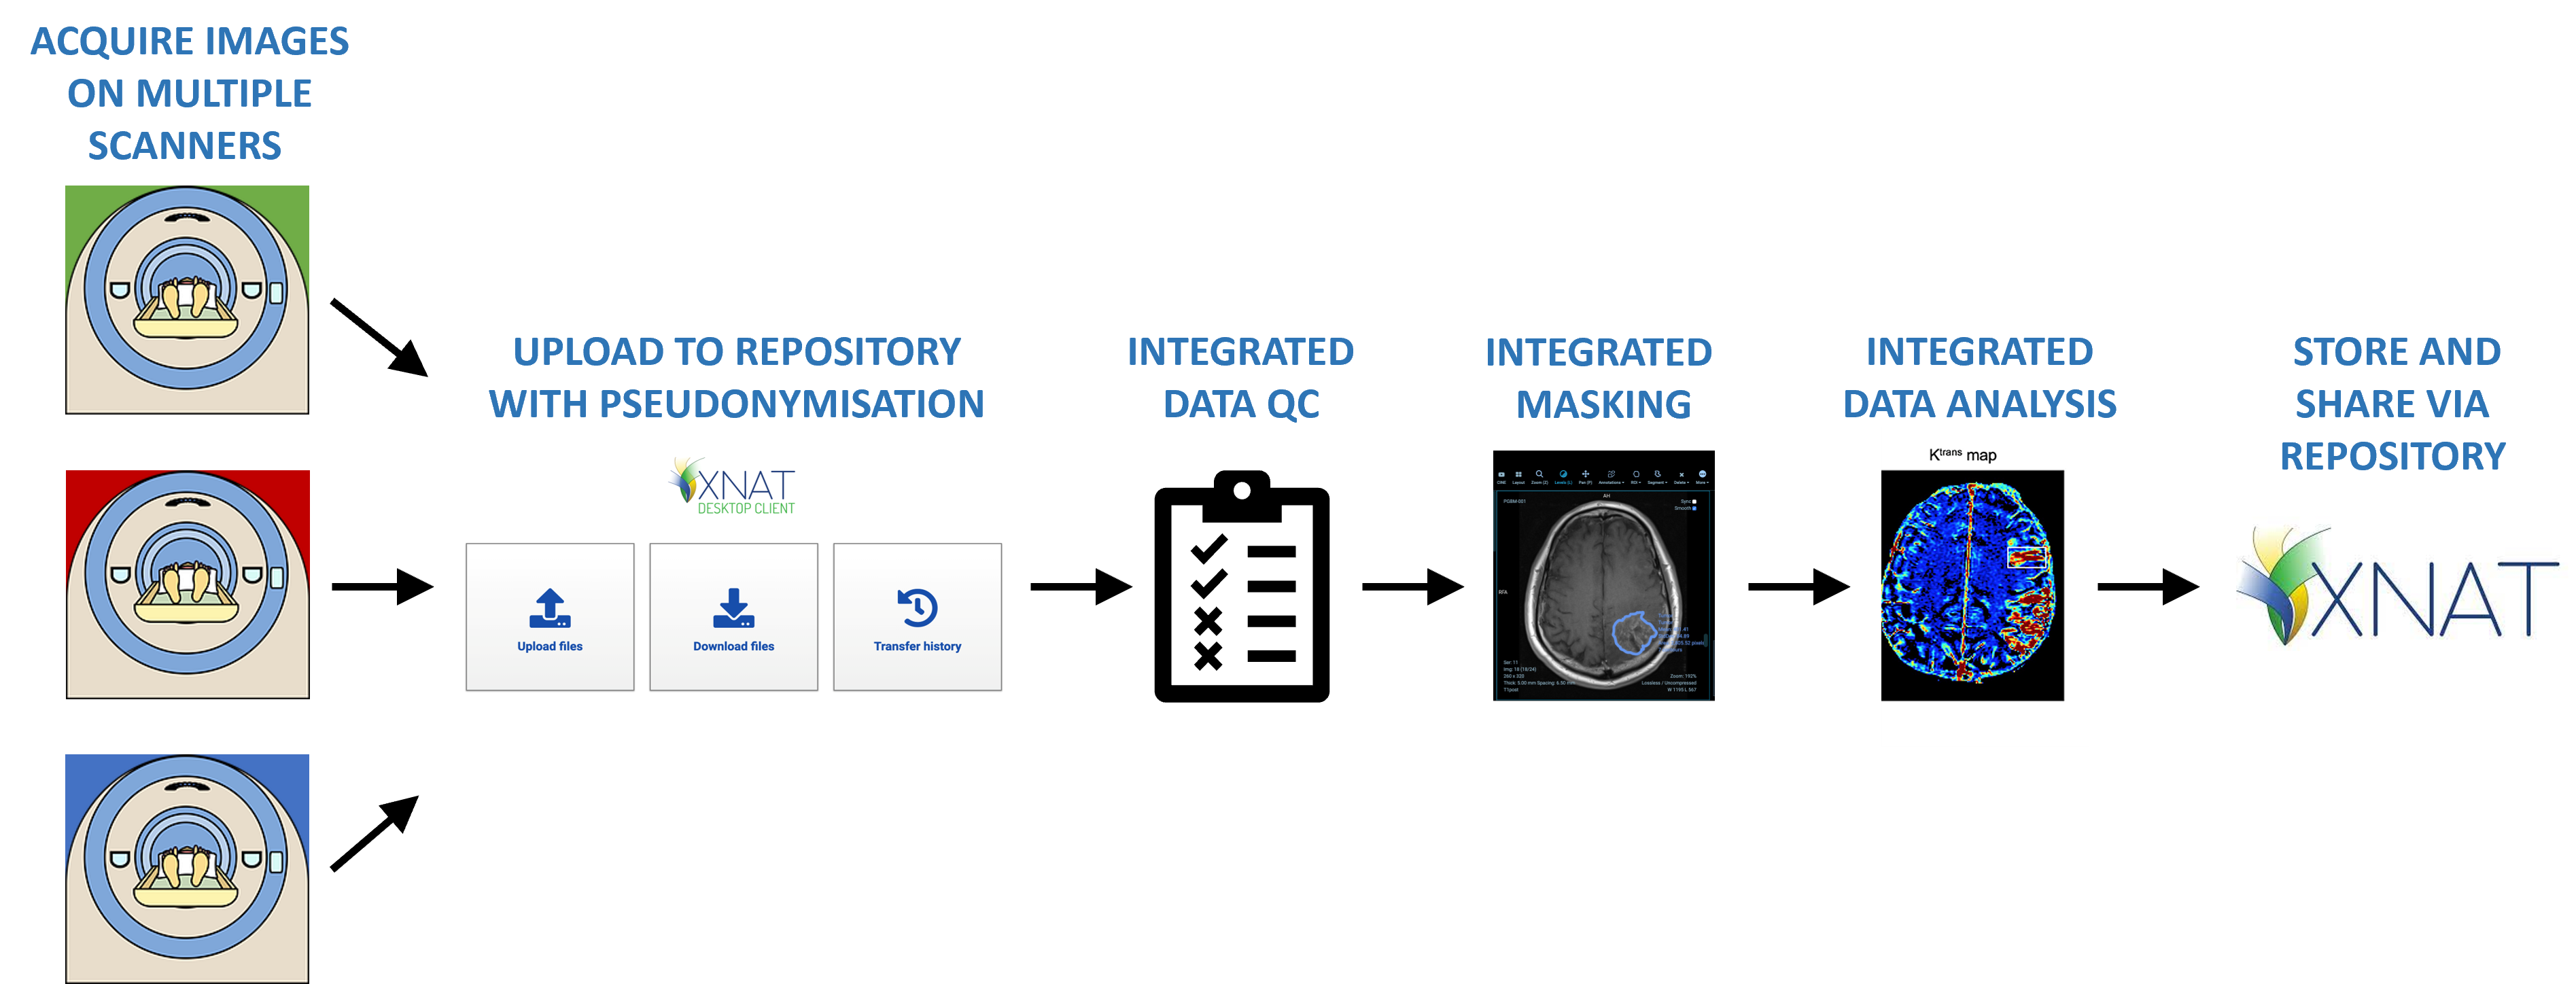
Translation of quantitative MR (qMR) imaging biomarkers from single-centre metrics to reproducible, vendor-agnostic clinical benchmarks requires extensive assessment of sensitivity, specificity and repeatability in multi-centre trials[1]. Data transfer, pseudonymisation, ROI masking, image registration, data QC and parameter mapping are often performed inconsistently across multiple centres, reducing biomarker reproducibility. To maximise the potential for clinical translation, we propose a harmonised workflow for storage, QC and analysis of imaging data—see Figure 1.The NCITA MR Core Lab (ncita.org.uk/ncita-mr-core-lab/) has been formed to help address the current gap in standardisation, repeatability and QC of clinical MRI data analysis in oncology within the United Kingdom[4]. We have developed a customisable, auditable and repository-integrated data analysis pipeline. Here, we implement the pipeline for a range of qMR methods and discuss how it could improve repeatability and simplify entry conditions for new sites becoming involved in multi-centre trials, thus helping to scale up qMR imaging biomarker translation.
METHODS
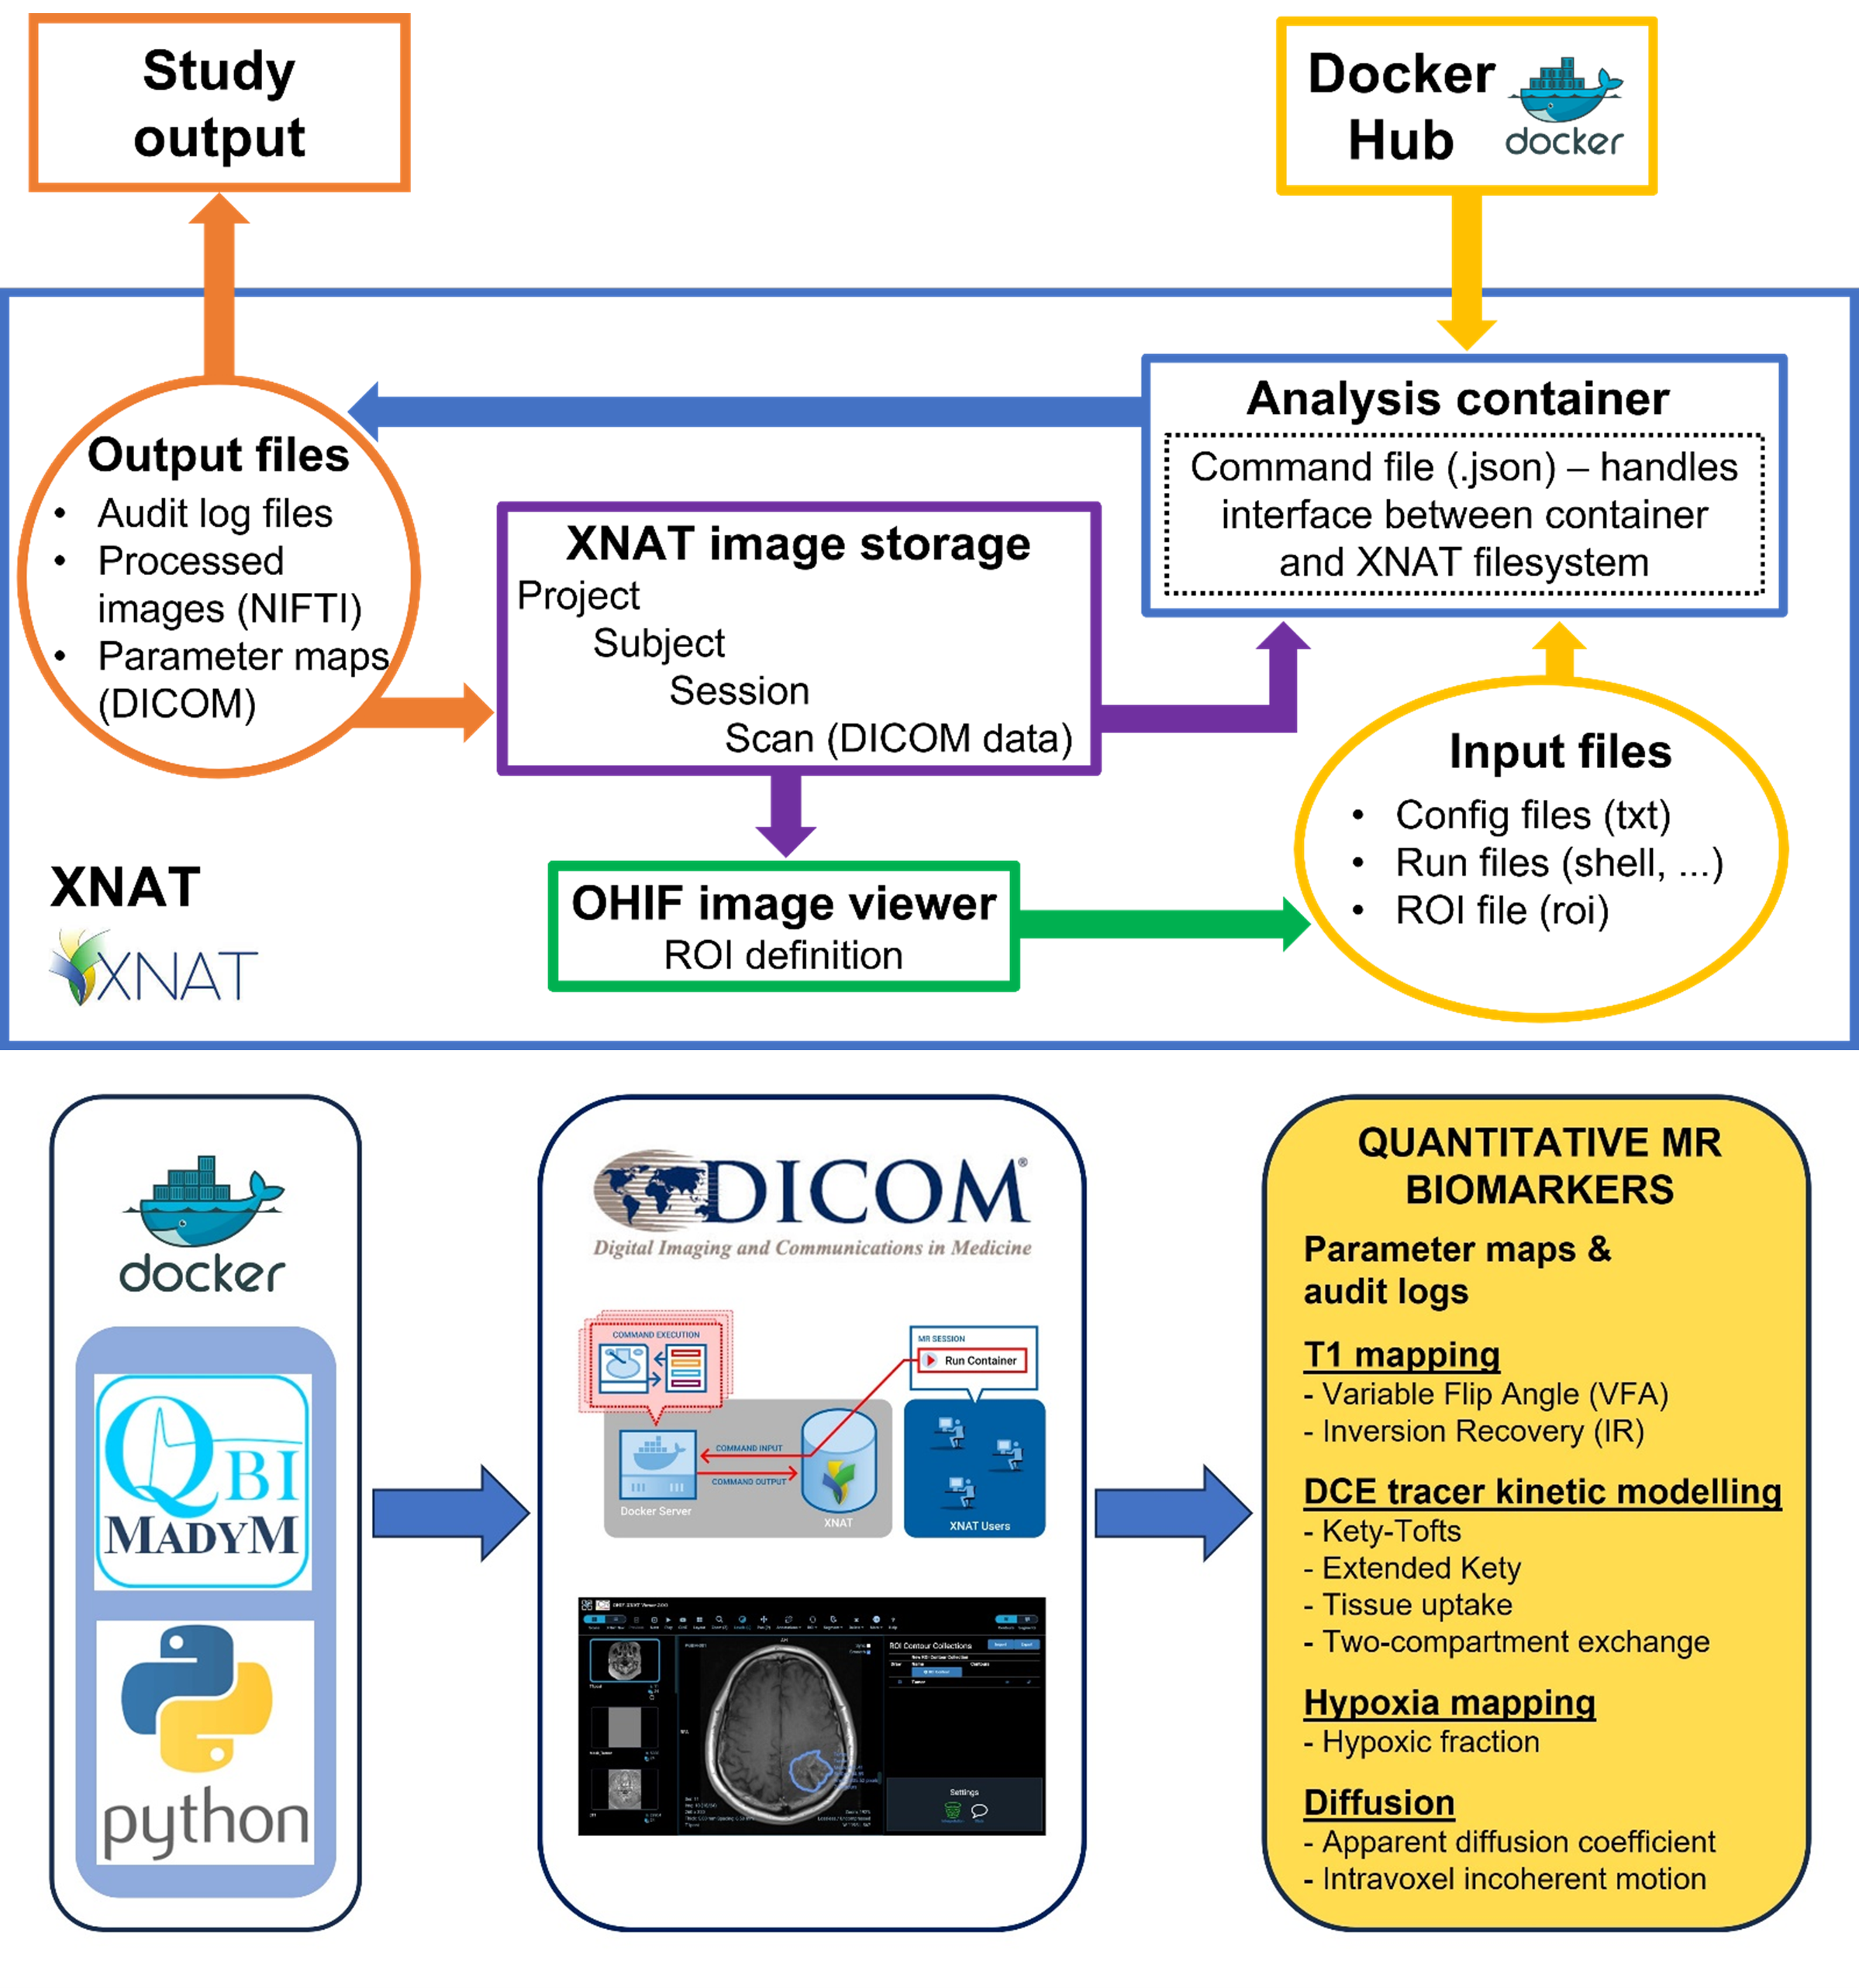
Multi-parametric imaging data from a patient with head-and-neck squamous cell cancer (HNSCC) were acquired on a clinical Ingenia 1.5 T system (Philips Medical Systems, Amsterdam, Netherlands) and were uploaded to an XNAT image repository[2] in DICOM format (ClinicalTrials.gov Identifier: NCT03646747; Ethics: REC 18/NW/0563). The imaging protocol included T1 inversion recovery (TI) data, dynamic T1-weighted series with change from air-to-100% oxygen, variable flip angle (VFA) T1 data, dynamic T1-weighted series with Gd injection, and multiple b-value DWI data.Data analysis was performed using Python shell scripts and the Madym C++ toolkit (version 4.22.0)[3]. The software was containerised using the Docker platform, and integrated into the XNAT image repository (version 1.8.9) using the Container Service (version 3.3.0, wiki.xnat.org/container-service/). A JSON-format command file provided an interface between the container and the XNAT filesystem, determining how the container was used. User-modifiable configuration text files uploaded to XNAT separately supplied the necessary parameters for data processing, such as input/output directories, file formats and analysis models–see Figure 2.
Data were sorted, converted to NIFTI format and processed within the XNAT platform to generate anatomically registered and ROI-masked quantitative maps for T1, DCE parameters (Ktrans, ve, vp)[4], ADC, IVIM parameters (f, D, D*)[5] and tumour hypoxia from oxygen-enhanced methods[6].
Audit logs listing all user-configurable parameters supplied and container operations performed were generated to aid reproducibility. Anatomical image overlaying and calculation of regional median, standard deviation and interquartile range for each parameter can be performed in the XNAT-integrated Open Health Imaging Foundation (OHIF) Viewer[7, 8], but have been replicated in MATLAB (MathWorks, Natick MA) for this example.
RESULTS
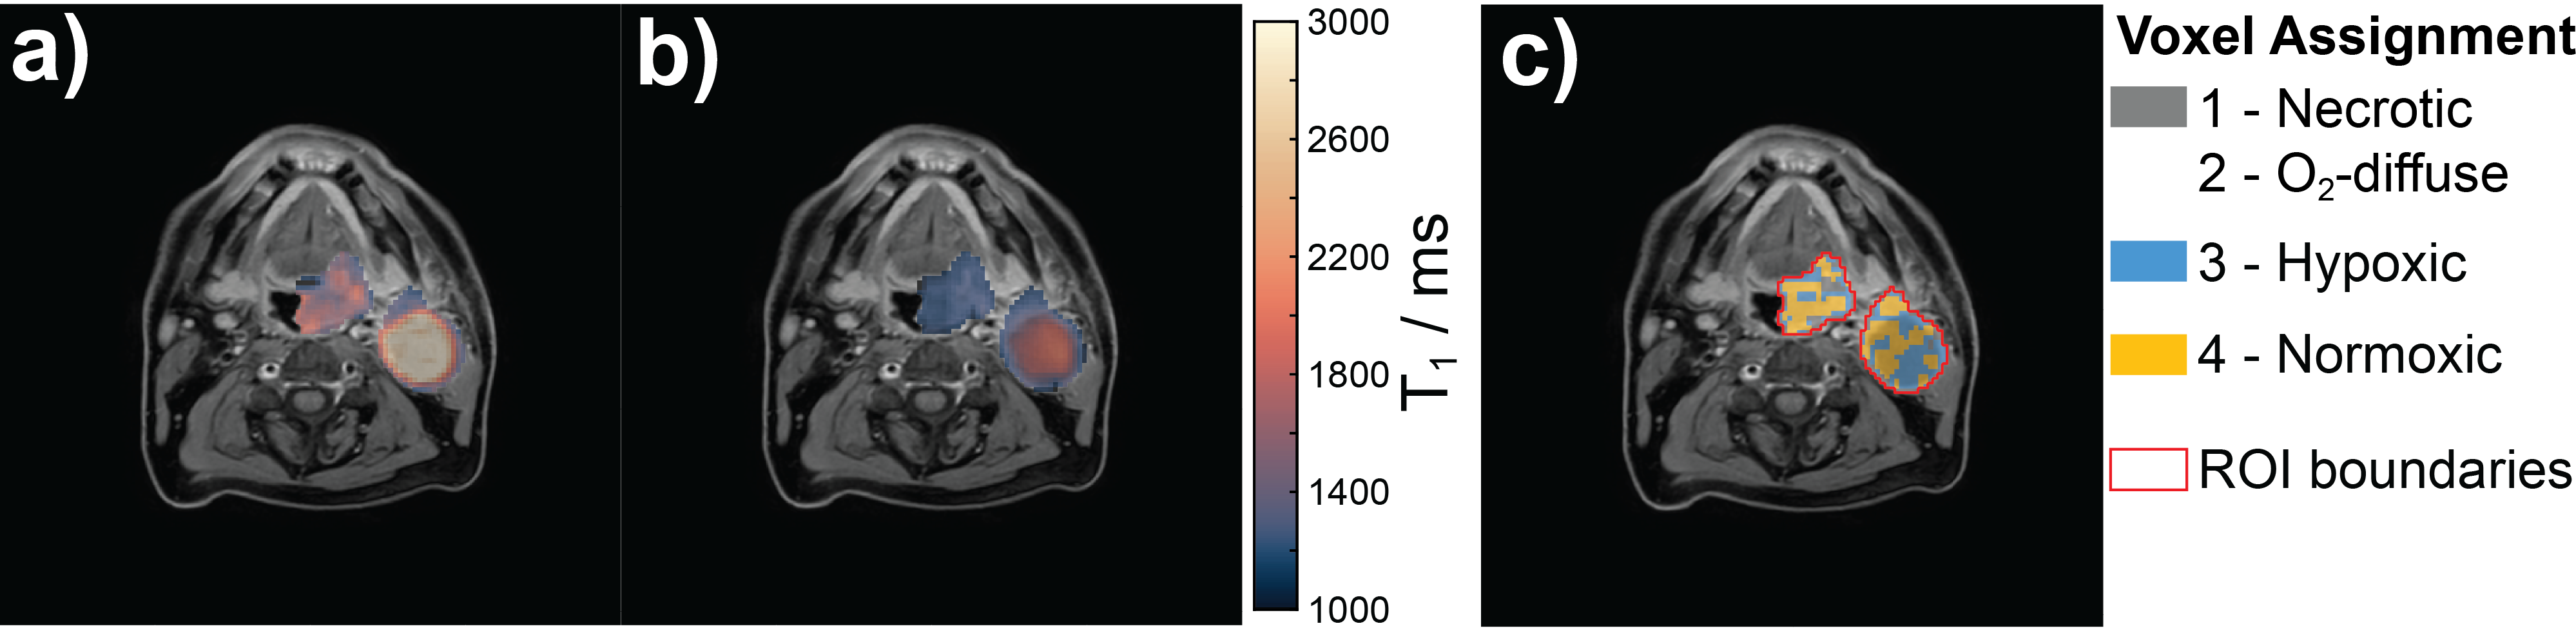
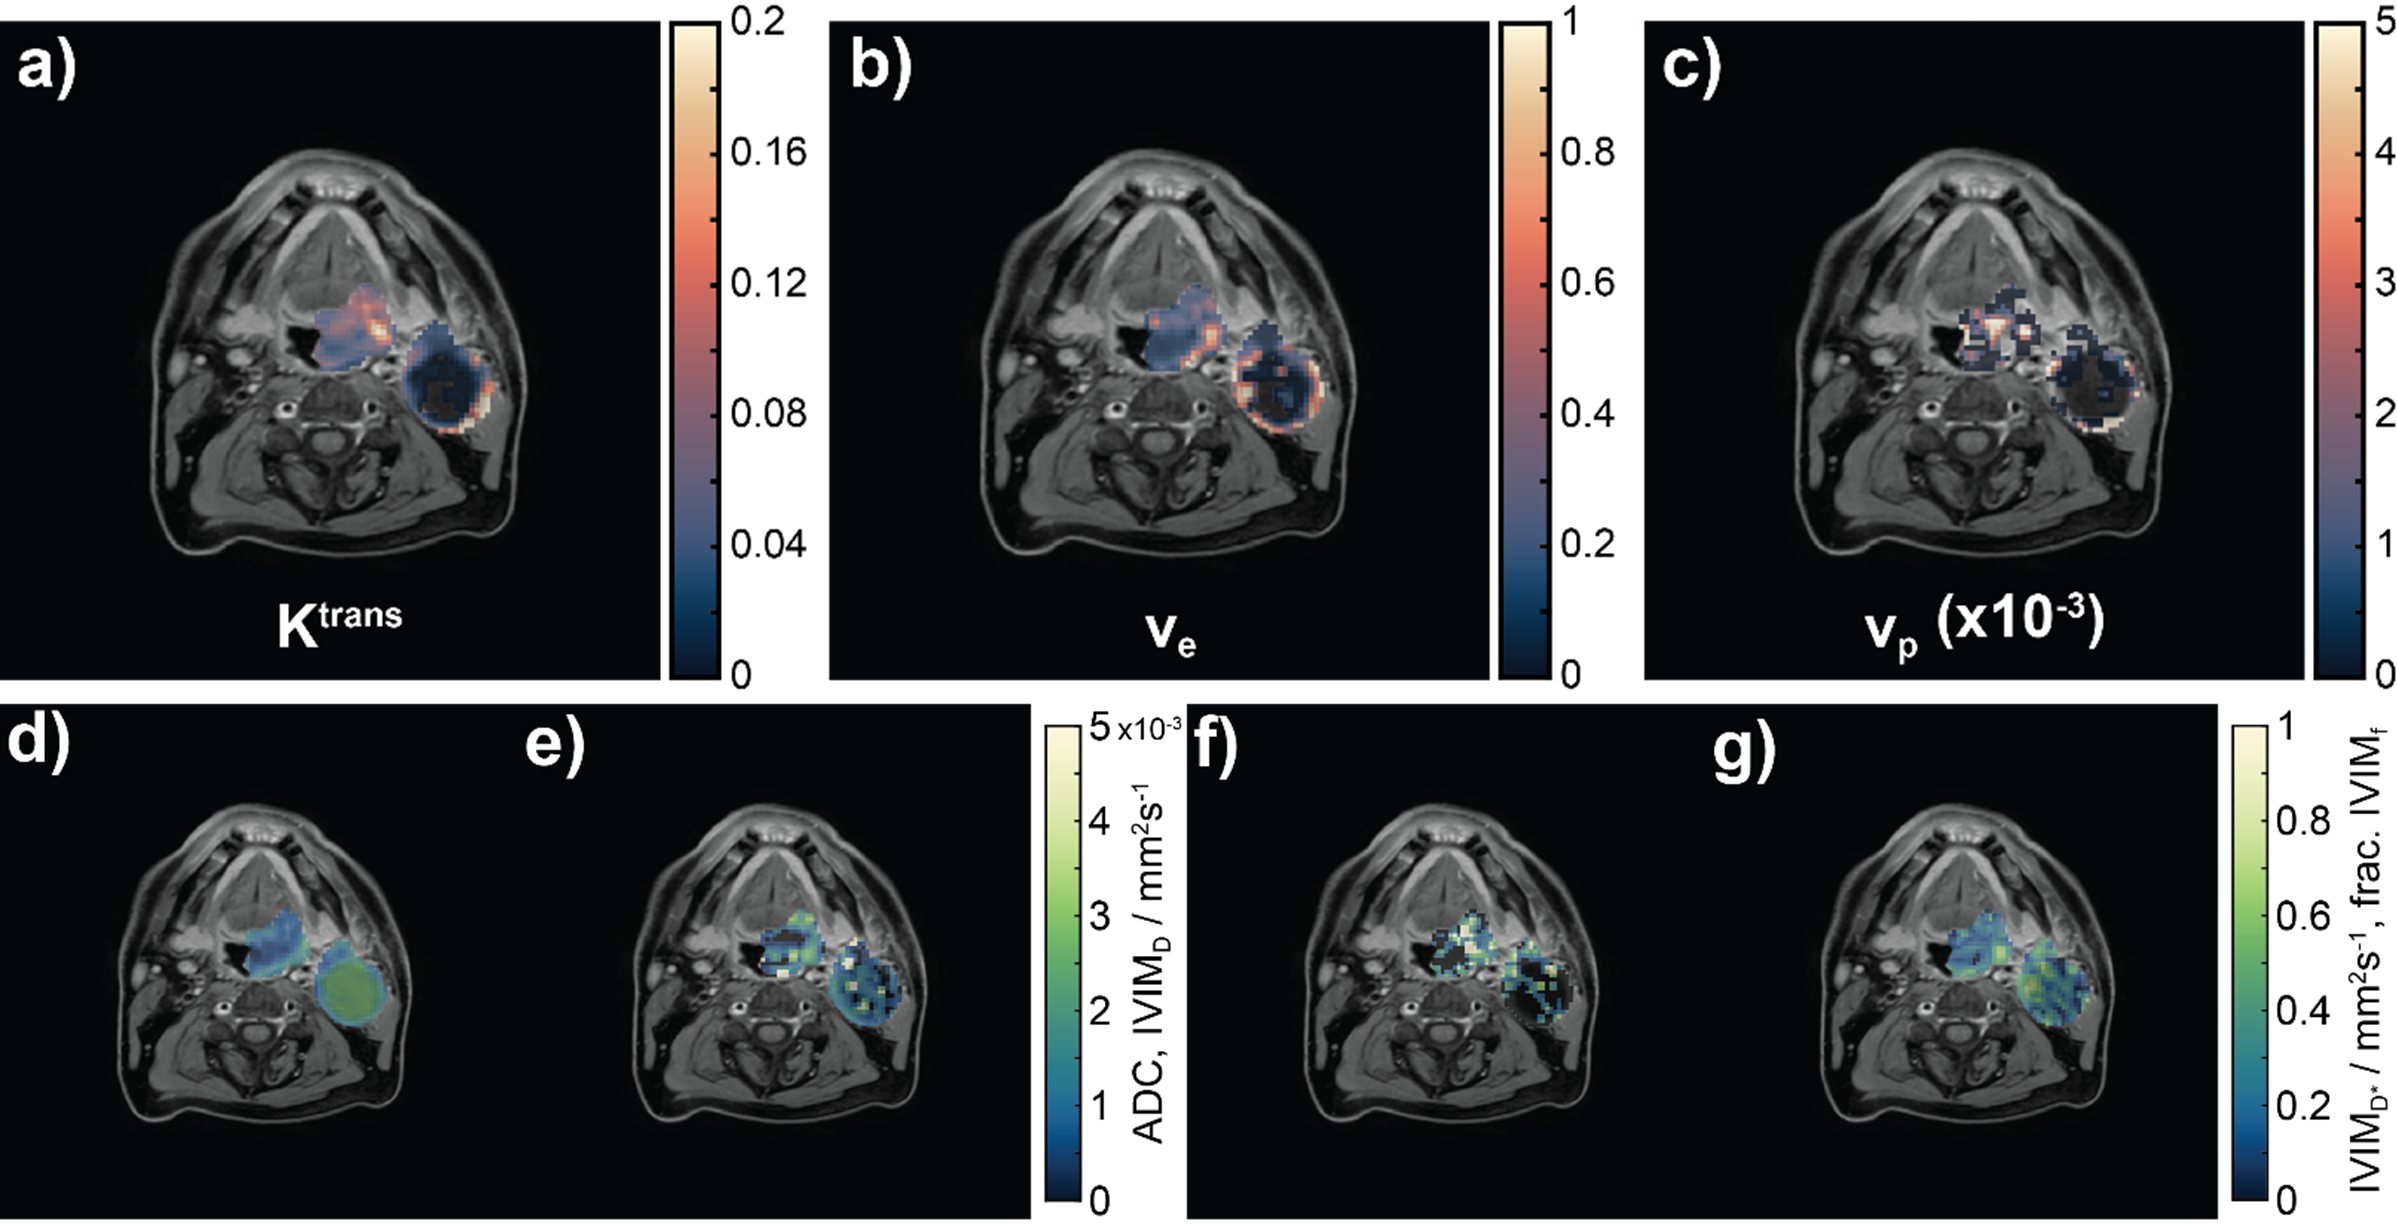
Example parameter maps for T1, DCE parameters (Ktrans, ve, vp), ADC, IVIM parameters (f, D, D*) and hypoxia in a patient with HNSCC are shown in Figures 3-4. Statistics for each parameter in the two nodes investigated are presented in Table 1. A container image is available to download from https://hub.docker.com/repository/docker/mrcorelab/madym/general.DISCUSSION
Integration of the analysis container into the repository allows standardised, end-to-end processing of a range of clinically-relevant MR imaging biomarkers with a single initial upload of imaging data to the imaging repository at the site of acquisition. This workflow has potential to simplify the logistical challenges of running multi-centre trials, creating a single, reproducible standard operating procedure for data analysis and QC. More rapid turnaround of data QC and analysis, as well as minimisation of potential error introduction during data download and transfer are also of benefit.In a representative example of lesions in a patient with HNSCC, the container allowed quantification of T1 relaxation via VFA and multi-TI methods, DCE kinetic modelling parameters using the extended Kety-Tofts model, IVIM modelling parameters, ADC and hypoxia mapping. Values observed were generally in agreement with those reported in previous studies of primary HNSCC [9-13].
Although not demonstrated here, functionality exists to utilise alternative analysis models (e.g. tissue uptake or two-compartment exchange models for DCE kinetic modelling). Additionally, there is scope to extend the capabilities of the container to include other qMR imaging biomarkers such as T2 and T2*, magnetisation transfer and arterial spin labelling. In the future, we intend to use this framework to containerise and integrate other quantitative MR analysis toolkits, such as those shared by the community on the ISMRM MR Hub (https://ismrm.github.io/mrhub/).
CONCLUSIONS
An imaging repository-integrated pipeline for analysis of qMR data has been demonstrated. The modular nature of the container and configurable options available at the command line allow customisation to suit the needs of the study. The containerised data analysis pipeline demonstrated here provides a framework for standardised, repeatable and auditable analysis of qMR data, reducing the barriers to accelerated novel biomarker translation into widespread clinical use.Acknowledgements
This research was supported by the NIHR Cambridge Biomedical Research Centre (BRC-1215-20014). The views expressed are those of the authors and not necessarily those of the NIHR or the Department of Health and Social Care. The authors acknowledge support from the National Cancer Imaging Translational Accelerator (NCITA).References
1. O'Connor, J.P., et al., Imaging biomarker roadmap for cancer studies. Nat Rev Clin Oncol, 2017. 14(3): p. 169-186.
2. Marcus, D.S., et al., The extensible neuroimaging archive toolkit. Neuroinformatics, 2007. 5(1): p. 11-33.
3. Berks, M., et al., Madym: A C++ toolkit for quantitative DCE-MRI analysis. J. Open Source Softw., 2021. 6(66): p. 3523-3526.
4. Tofts, P.S., et al., Estimating kinetic parameters from dynamic contrast-enhanced T1-weighted MRI of a diffusable tracer: Standardized quantities and symbols. Journal of Magnetic Resonance Imaging, 1999. 10(3): p. 223-232.
5. Bihan, D.L., et al., Separation of diffusion and perfusion in intravoxel incoherent motion MR imaging. Radiology, 1988. 168(2): p. 497-505.
6. Little, R.A., et al., Mapping Hypoxia in Renal Carcinoma with Oxygen-enhanced MRI: Comparison with Intrinsic Susceptibility MRI and Pathology. Radiology, 2018. 288(3): p. 739-747.
7. Doran, S.J., et al., Integrating the OHIF Viewer into XNAT: Achievements, Challenges and Prospects for Quantitative Imaging Studies. Tomography, 2022. 8(1): p. 497-512.
8. Urban, T., et al., LesionTracker: Extensible Open-Source Zero-Footprint Web Viewer for Cancer Imaging Research and Clinical Trials. Cancer Res., 2017. 77(21): p. 119-122.
9. Ishiyama, M., et al., Dynamic contrast-enhanced magnetic resonance imaging in Head and Neck Cancer: differentiation of new H&N cancer, recurrent disease, and benign post-treatment changes. Clinical Imaging, 2015. 39(4): p. 566-570.
10. Lai, V., et al., Intravoxel incoherent motion MR imaging: comparison of diffusion and perfusion characteristics between nasopharyngeal carcinoma and post-chemoradiation fibrosis. European Radiology, 2013. 23(10): p. 2793-2801.
11. Lu, Y., et al., Comparing primary tumors and metastatic nodes in head and neck cancer using intravoxel incoherent motion imaging: a preliminary experience. J Comput Assist Tomogr, 2013. 37(3): p. 346-52.
12. Stikov, N., et al., On the accuracy of T1 mapping: Searching for common ground. Magnetic Resonance in Medicine, 2015. 73(2): p. 514-522.
13. Dubec, M.J., et al., First-in-human technique translation of oxygen-enhanced MRI to an MR Linac system in patients with head and neck cancer. Radiother Oncol, 2023. 183: p. 109592.
Figures