0237
SIPAS: A Comprehensive Susceptibility Imaging Process and Analysis Studio1Department of Electronic Science, Xiamen University, Xiamen, China
Synopsis
Keywords: Software Tools, Software Tools, Quantitative Suceptibility Mapping
Motivation: Quantitative susceptibility mapping (QSM) presents great potential to monitor of neurodegenerative diseases.
Goal(s): Our goal is to provide comprehensive pipelines for QSM research including reconstruction and analysis.
Approach: This work elaborates on the Susceptibility Imaging Process and Analysis Studio (SIPAS) which offers multi-method options for each step with an abundant parameter tuning user-interface. Subsequent analysis of QSM maps is based on the statistical indicators of region-of-interest (ROI) which are delineated on SIPAS.
Results: SIPAS can achieve complete QSM procedures and precise results. Several hospitals have tested SIPAS for QSM research on different organs such as the brain, kidney, and liver.
Impact: Quantitative susceptibility mapping is a key means of neurodegenerative diagnosis. SIPAS may serve as a platform for obtaining and evaluating high-quality susceptibility maps, which can be an effective tool for doctors and institutions to conduct QSM studies.
Introduction
Quantitative susceptibility mapping (QSM) finds application in the diagnosis of intracerebral bleeding and calcification and for monitoring Although quite a few toolkits1-3 are available for reconstructing QSM maps from MRI phase images, there exist some drawbacks such as limited algorithms, incomplete procedures, and relying on scripts. Here, we have developed the Susceptibility Imaging Process and Analysis Studio (SIPAS) for QSM reconstruction and subsequent processing. SIPAS, which adopts a graphical-user-interface design and exhibits images in real-time, simplifies the workflow for selecting processing methods, adjusting parameters, and evaluating results. Furthermore, it provides interfaces for region-of-interest (ROI) delineation with rich edit and image display functions, including axial, coronal, and sagittal slice views, 3D volume rendering, and statistical graphics figures.Methods
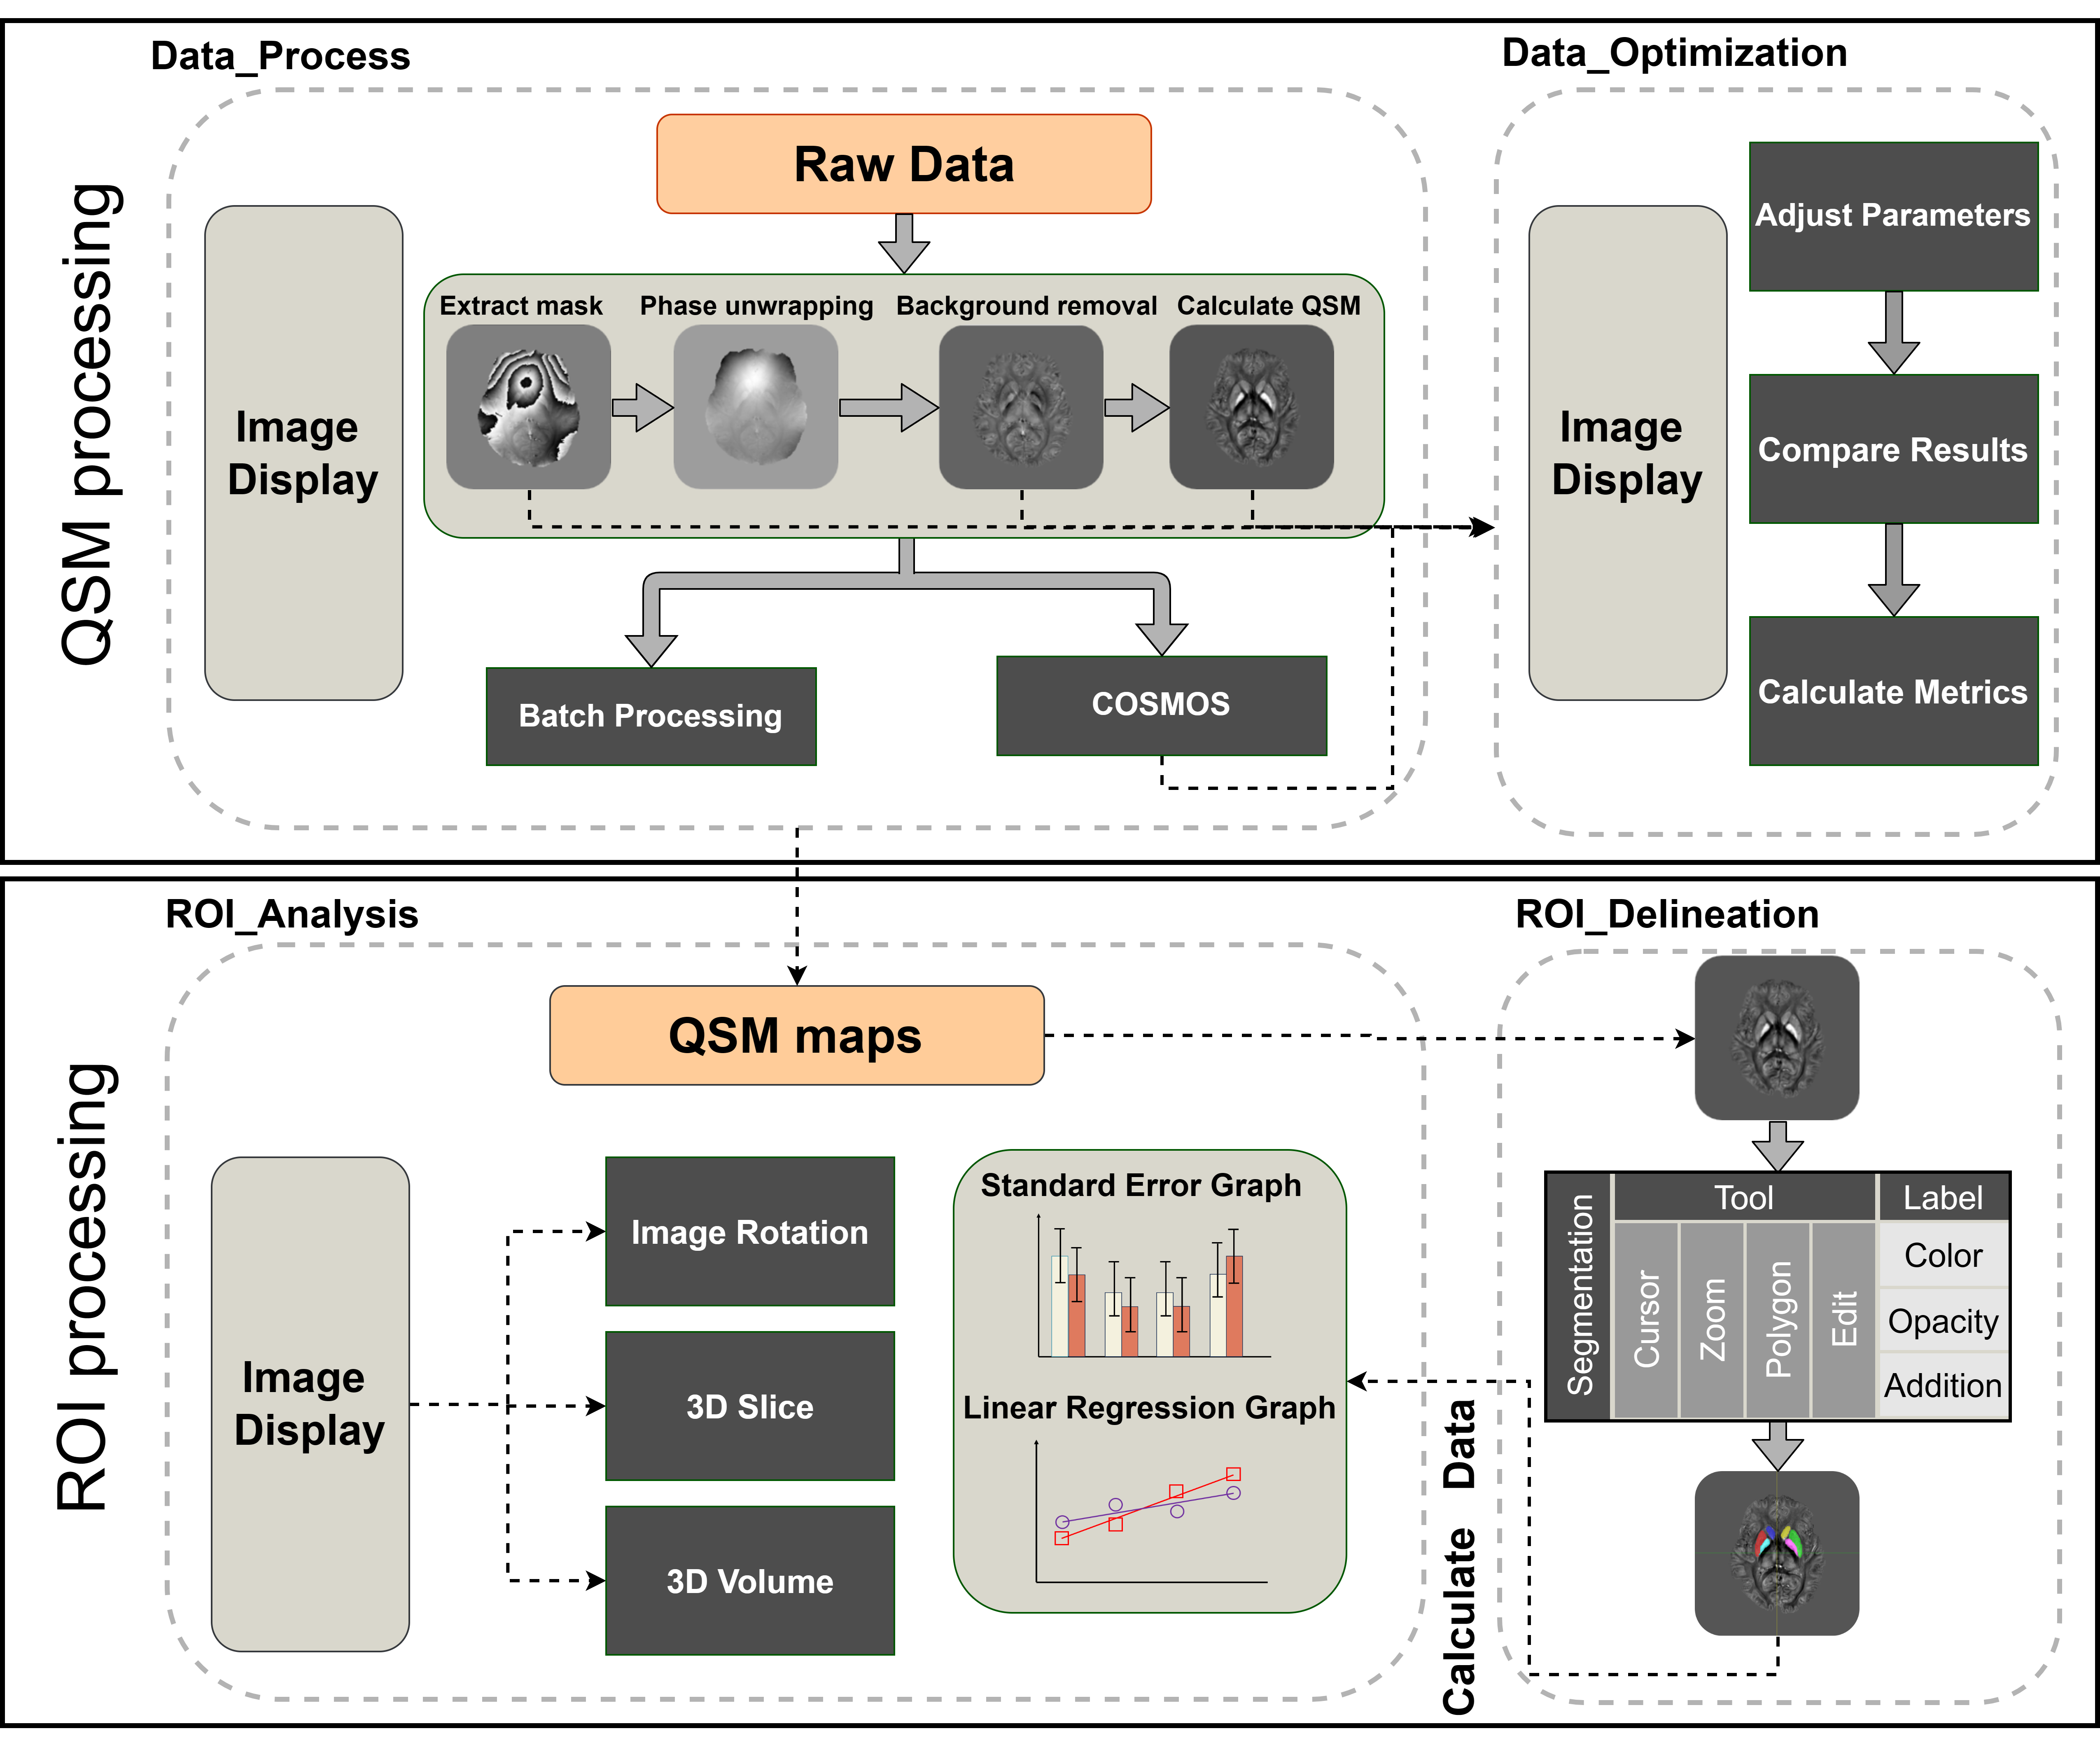
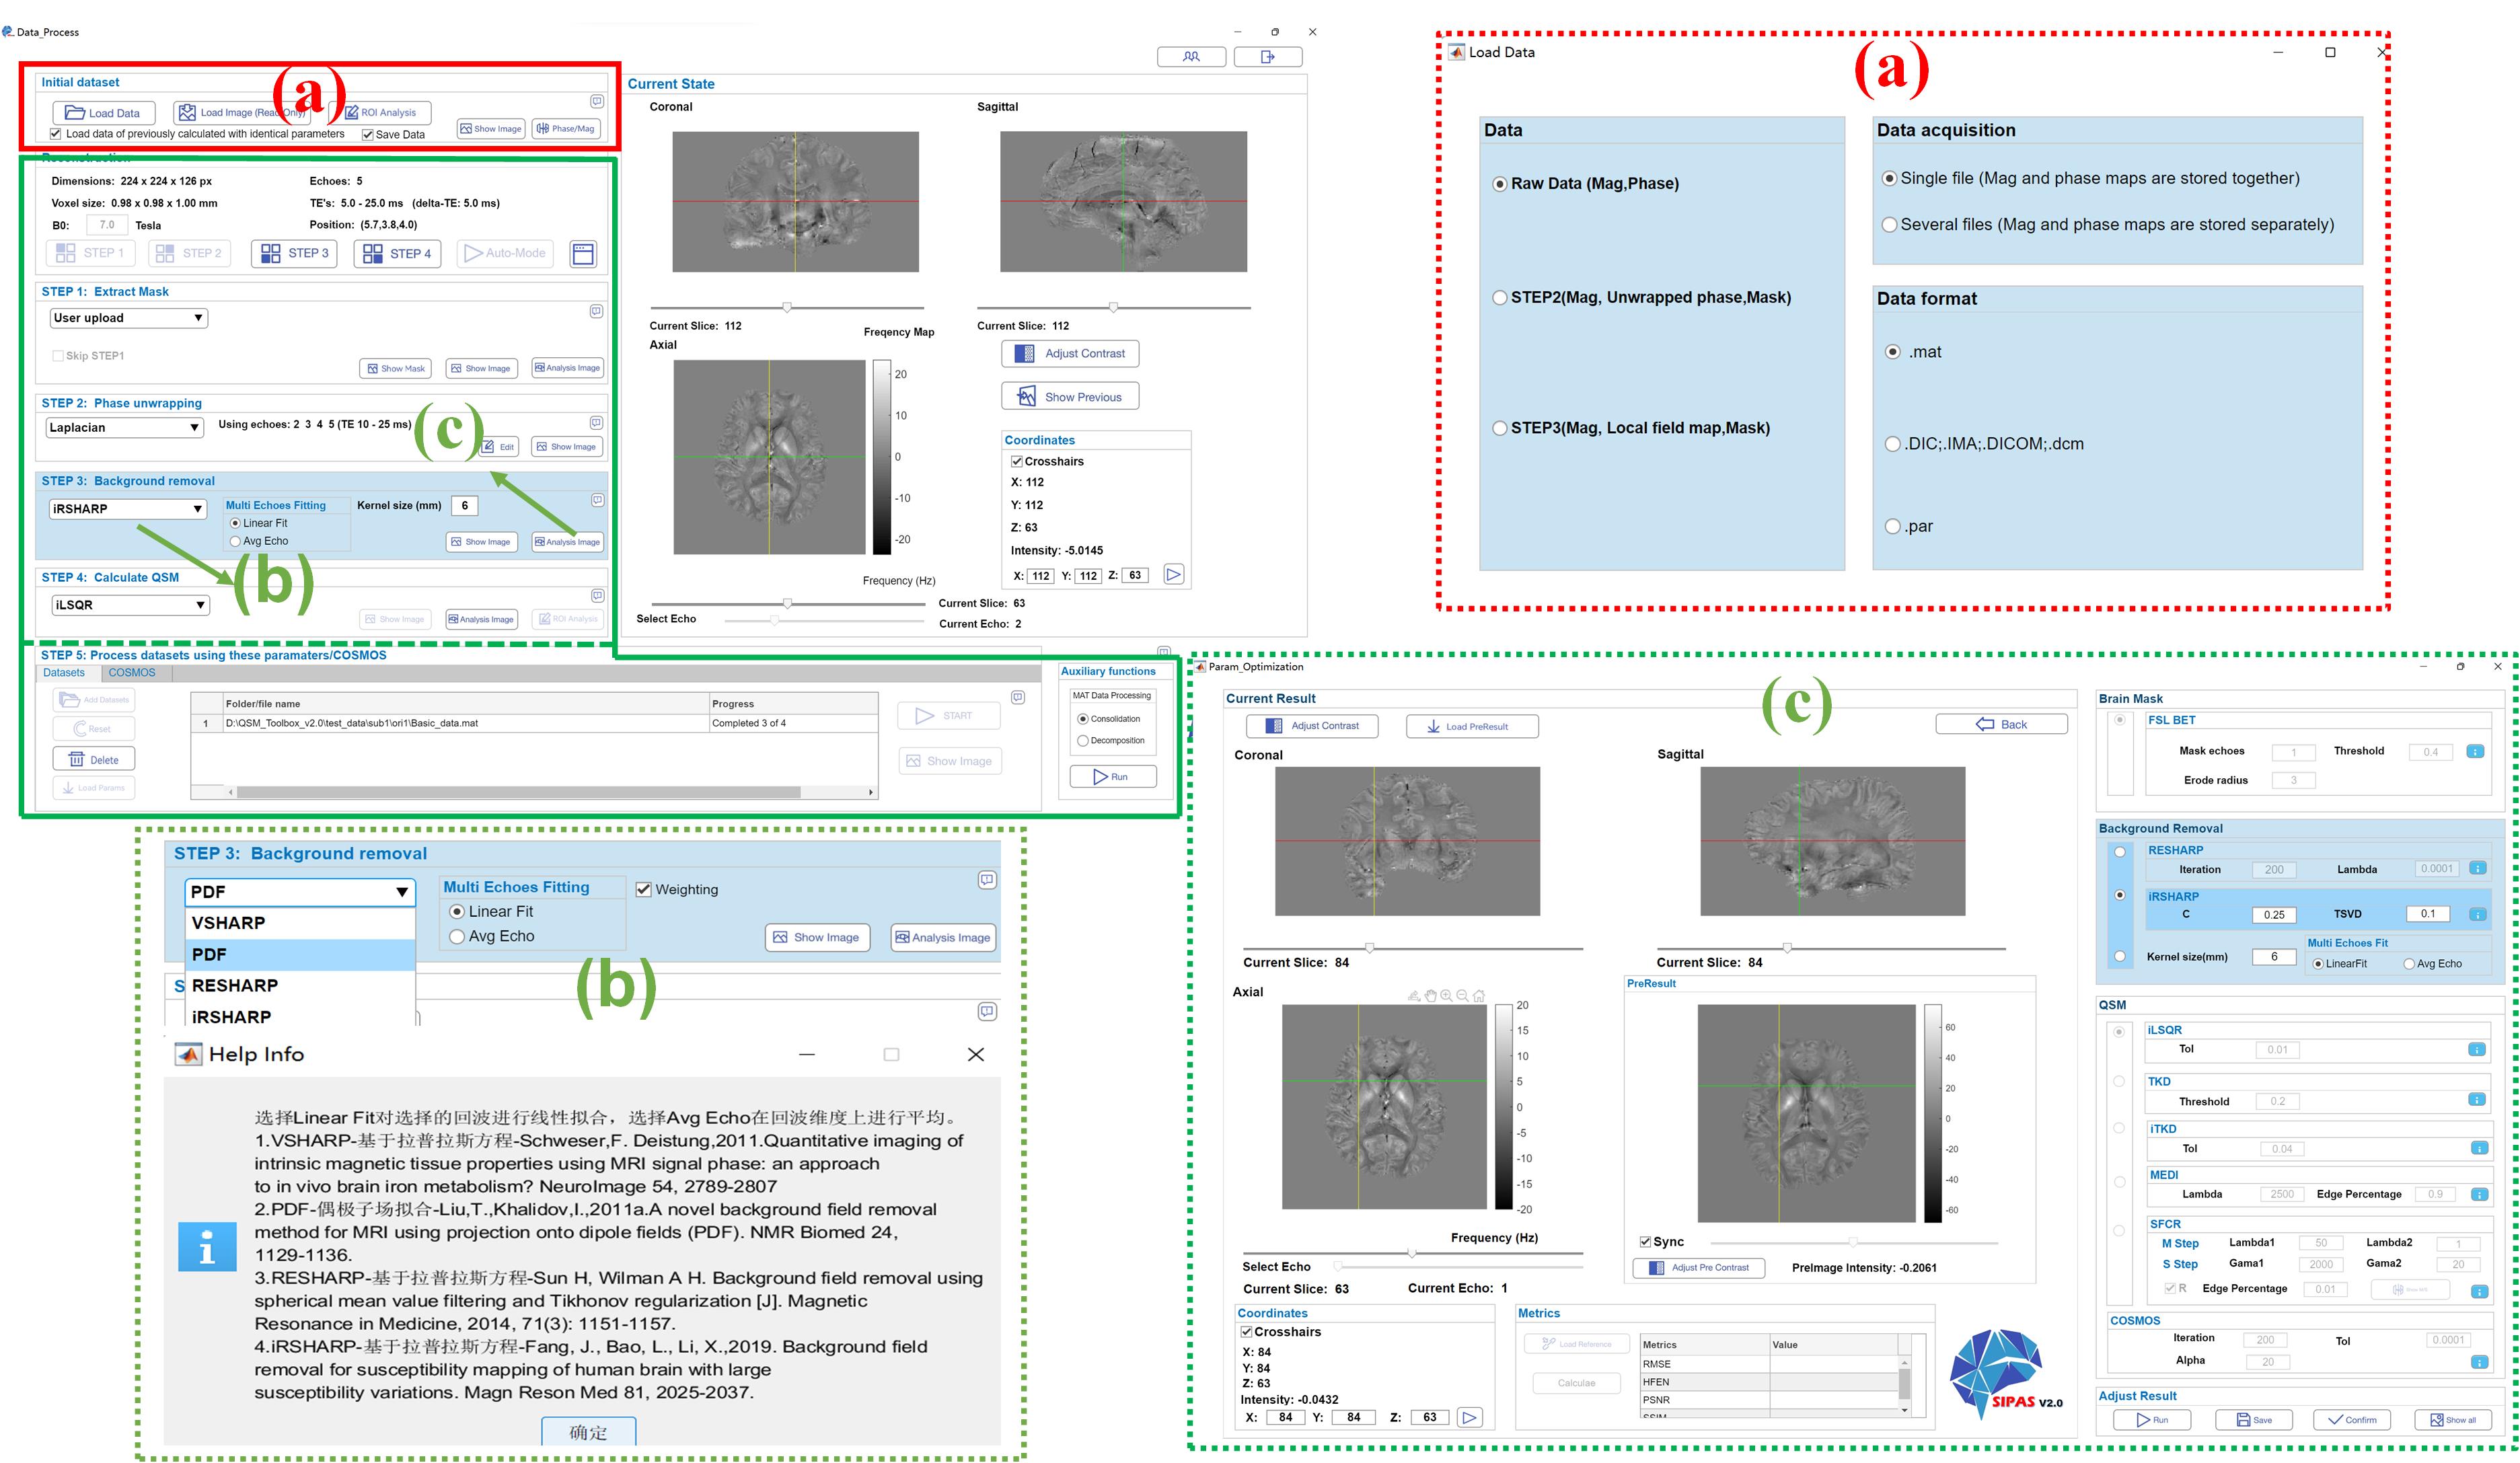
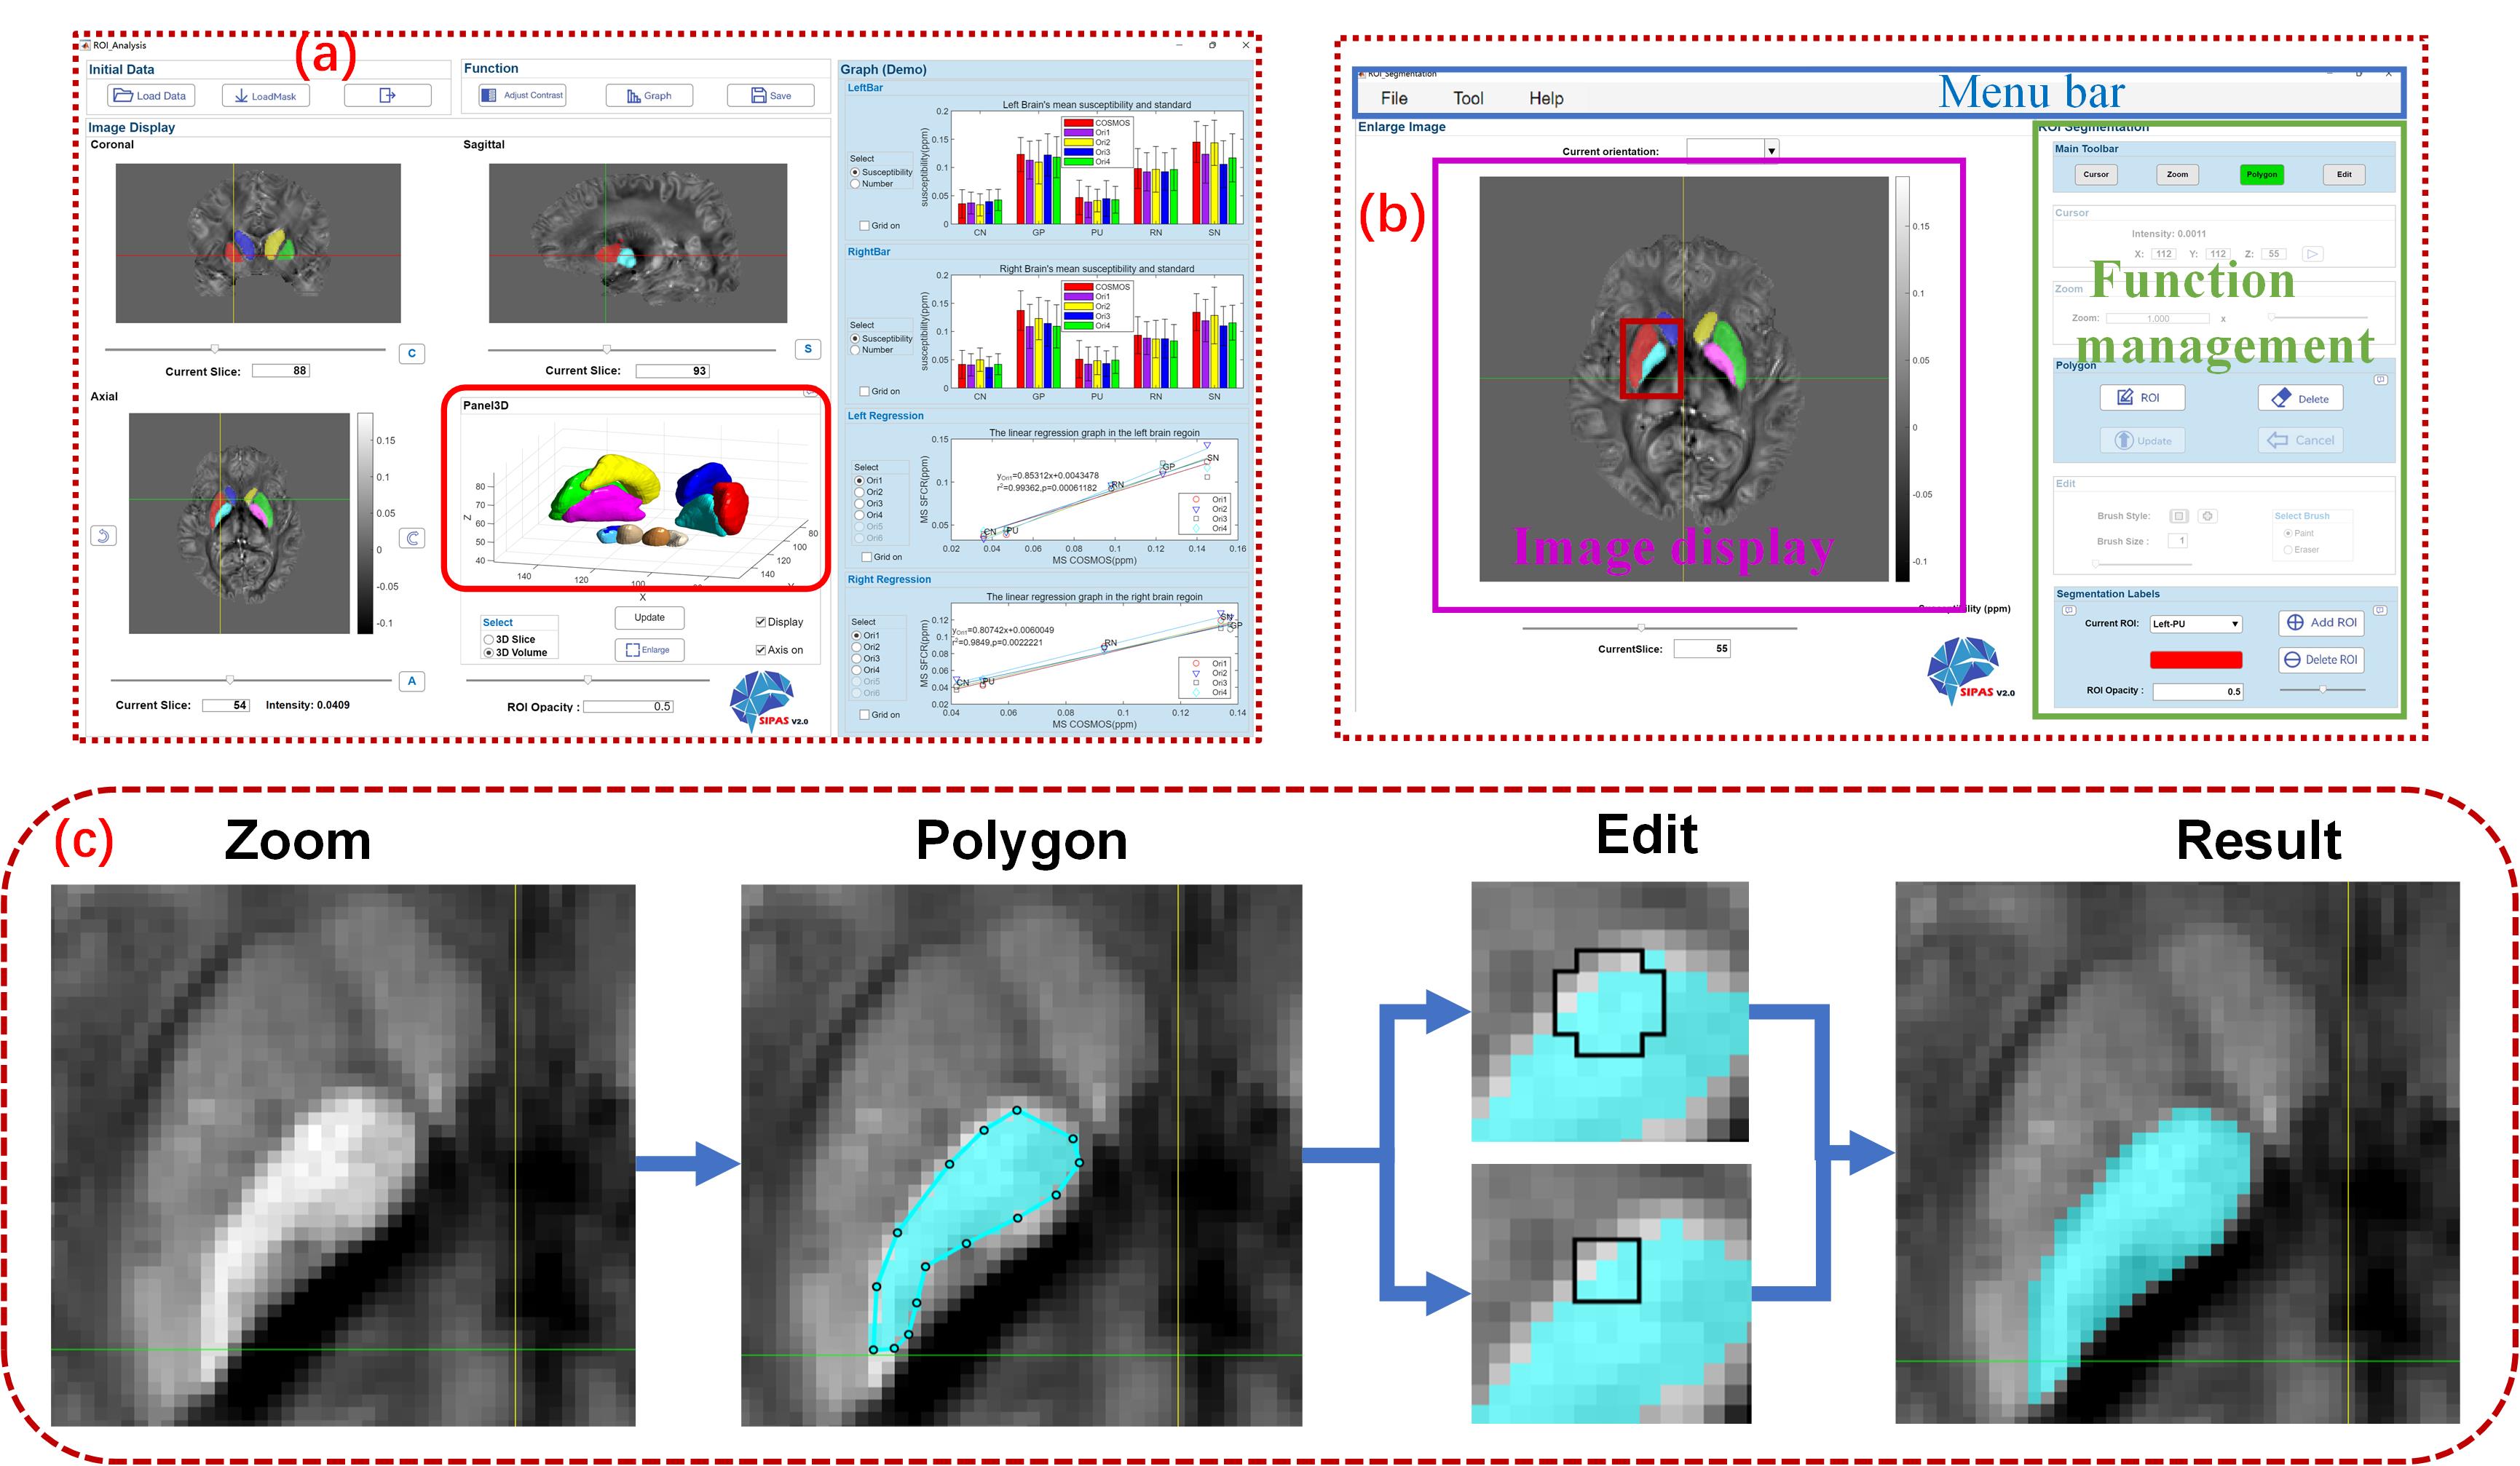
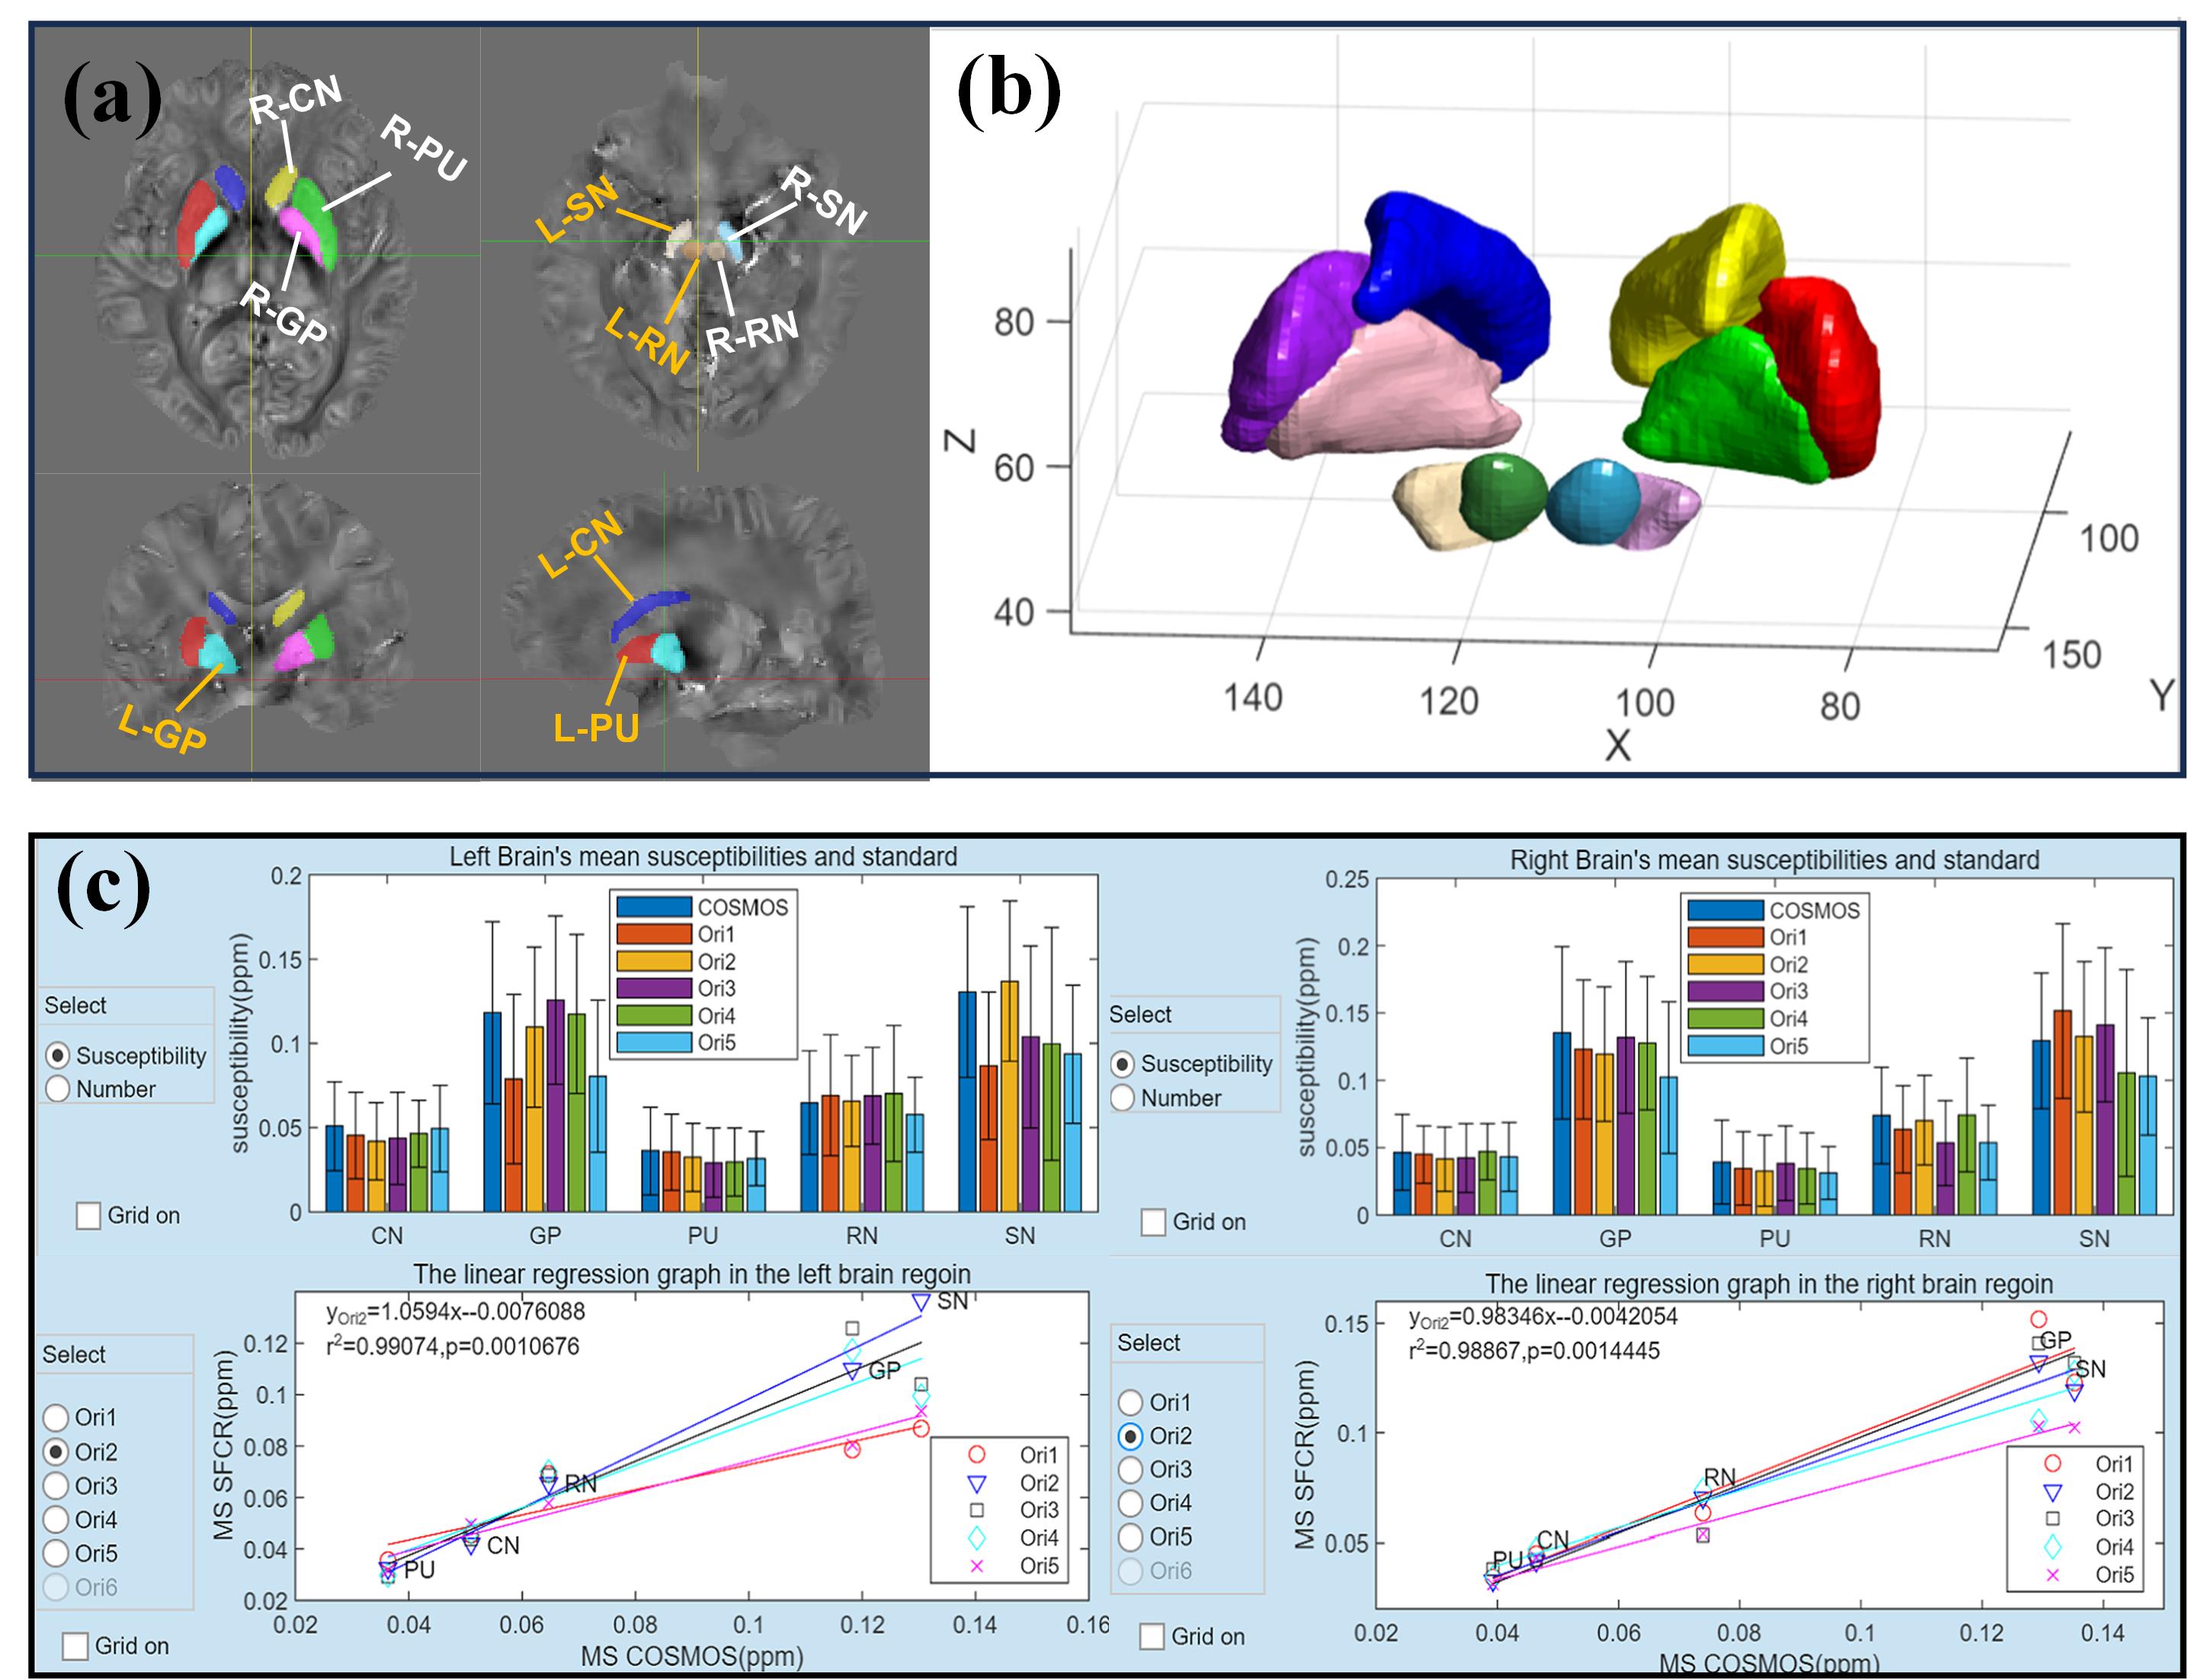
Fig. 1 shows the framework of SIPAS, while Fig.2 and Fig.3 illustrate four interfaces. SIPAS contains QSM and ROI processing, wherein QSM processing encompasses Data_Process and Data_Optimization while ROI processing involves ROI_Analysis and ROI_Delineation. Data_Process serves as the core component of SIPAS for reconstructing QSM maps. Multiple methods4-9 could be optioned for each step. Besides, functions containing batch-processing and COSMOS calculation are added to SIPAS. Data_Optimization acts as a supplementary for Data_Process, which enables users to fine-tune the parameters. ROI_Analysis is specifically designed for data analysis of ROIs and 3D visualization. ROI_Delineation facilitates the delineation and indicator calculation of ROIs with rich and flexible functions.Several sets of data on 3T, 5T, and 7T are applied to demonstrate the generality of SIPAS. The 7T data is scanned at five orientations noted from Ori1 to Ori5. Laplacian, SEGUE, and Path are optional for phase unwrapping with the default method being Laplacian. Two methods including linear fitting and avg-echo are provided for phase combination. Users can select from four algorithms for background field removal: RESHARP, VSHARP, iRSHARP, and PDF. SIPAS offers five approaches for QSM calculation, including iLSQR, TKD, iTKD, MEDI, and SFCR. For 7T data with five orientations, the gold standard map is computed by COSMOS, and ROIs are delineated manually on the COSMOS map. Here five deep gray matter nuclei (DGMN) are delineated, including the caudate nucleus (CN), globus pallidus (GP), putamen (PU), red nucleus (RN), and substantia nigra (SN). The ROI mask acquired from COSMOS is applied to the susceptibility maps of all the other orientations for ROI analysis.
Results
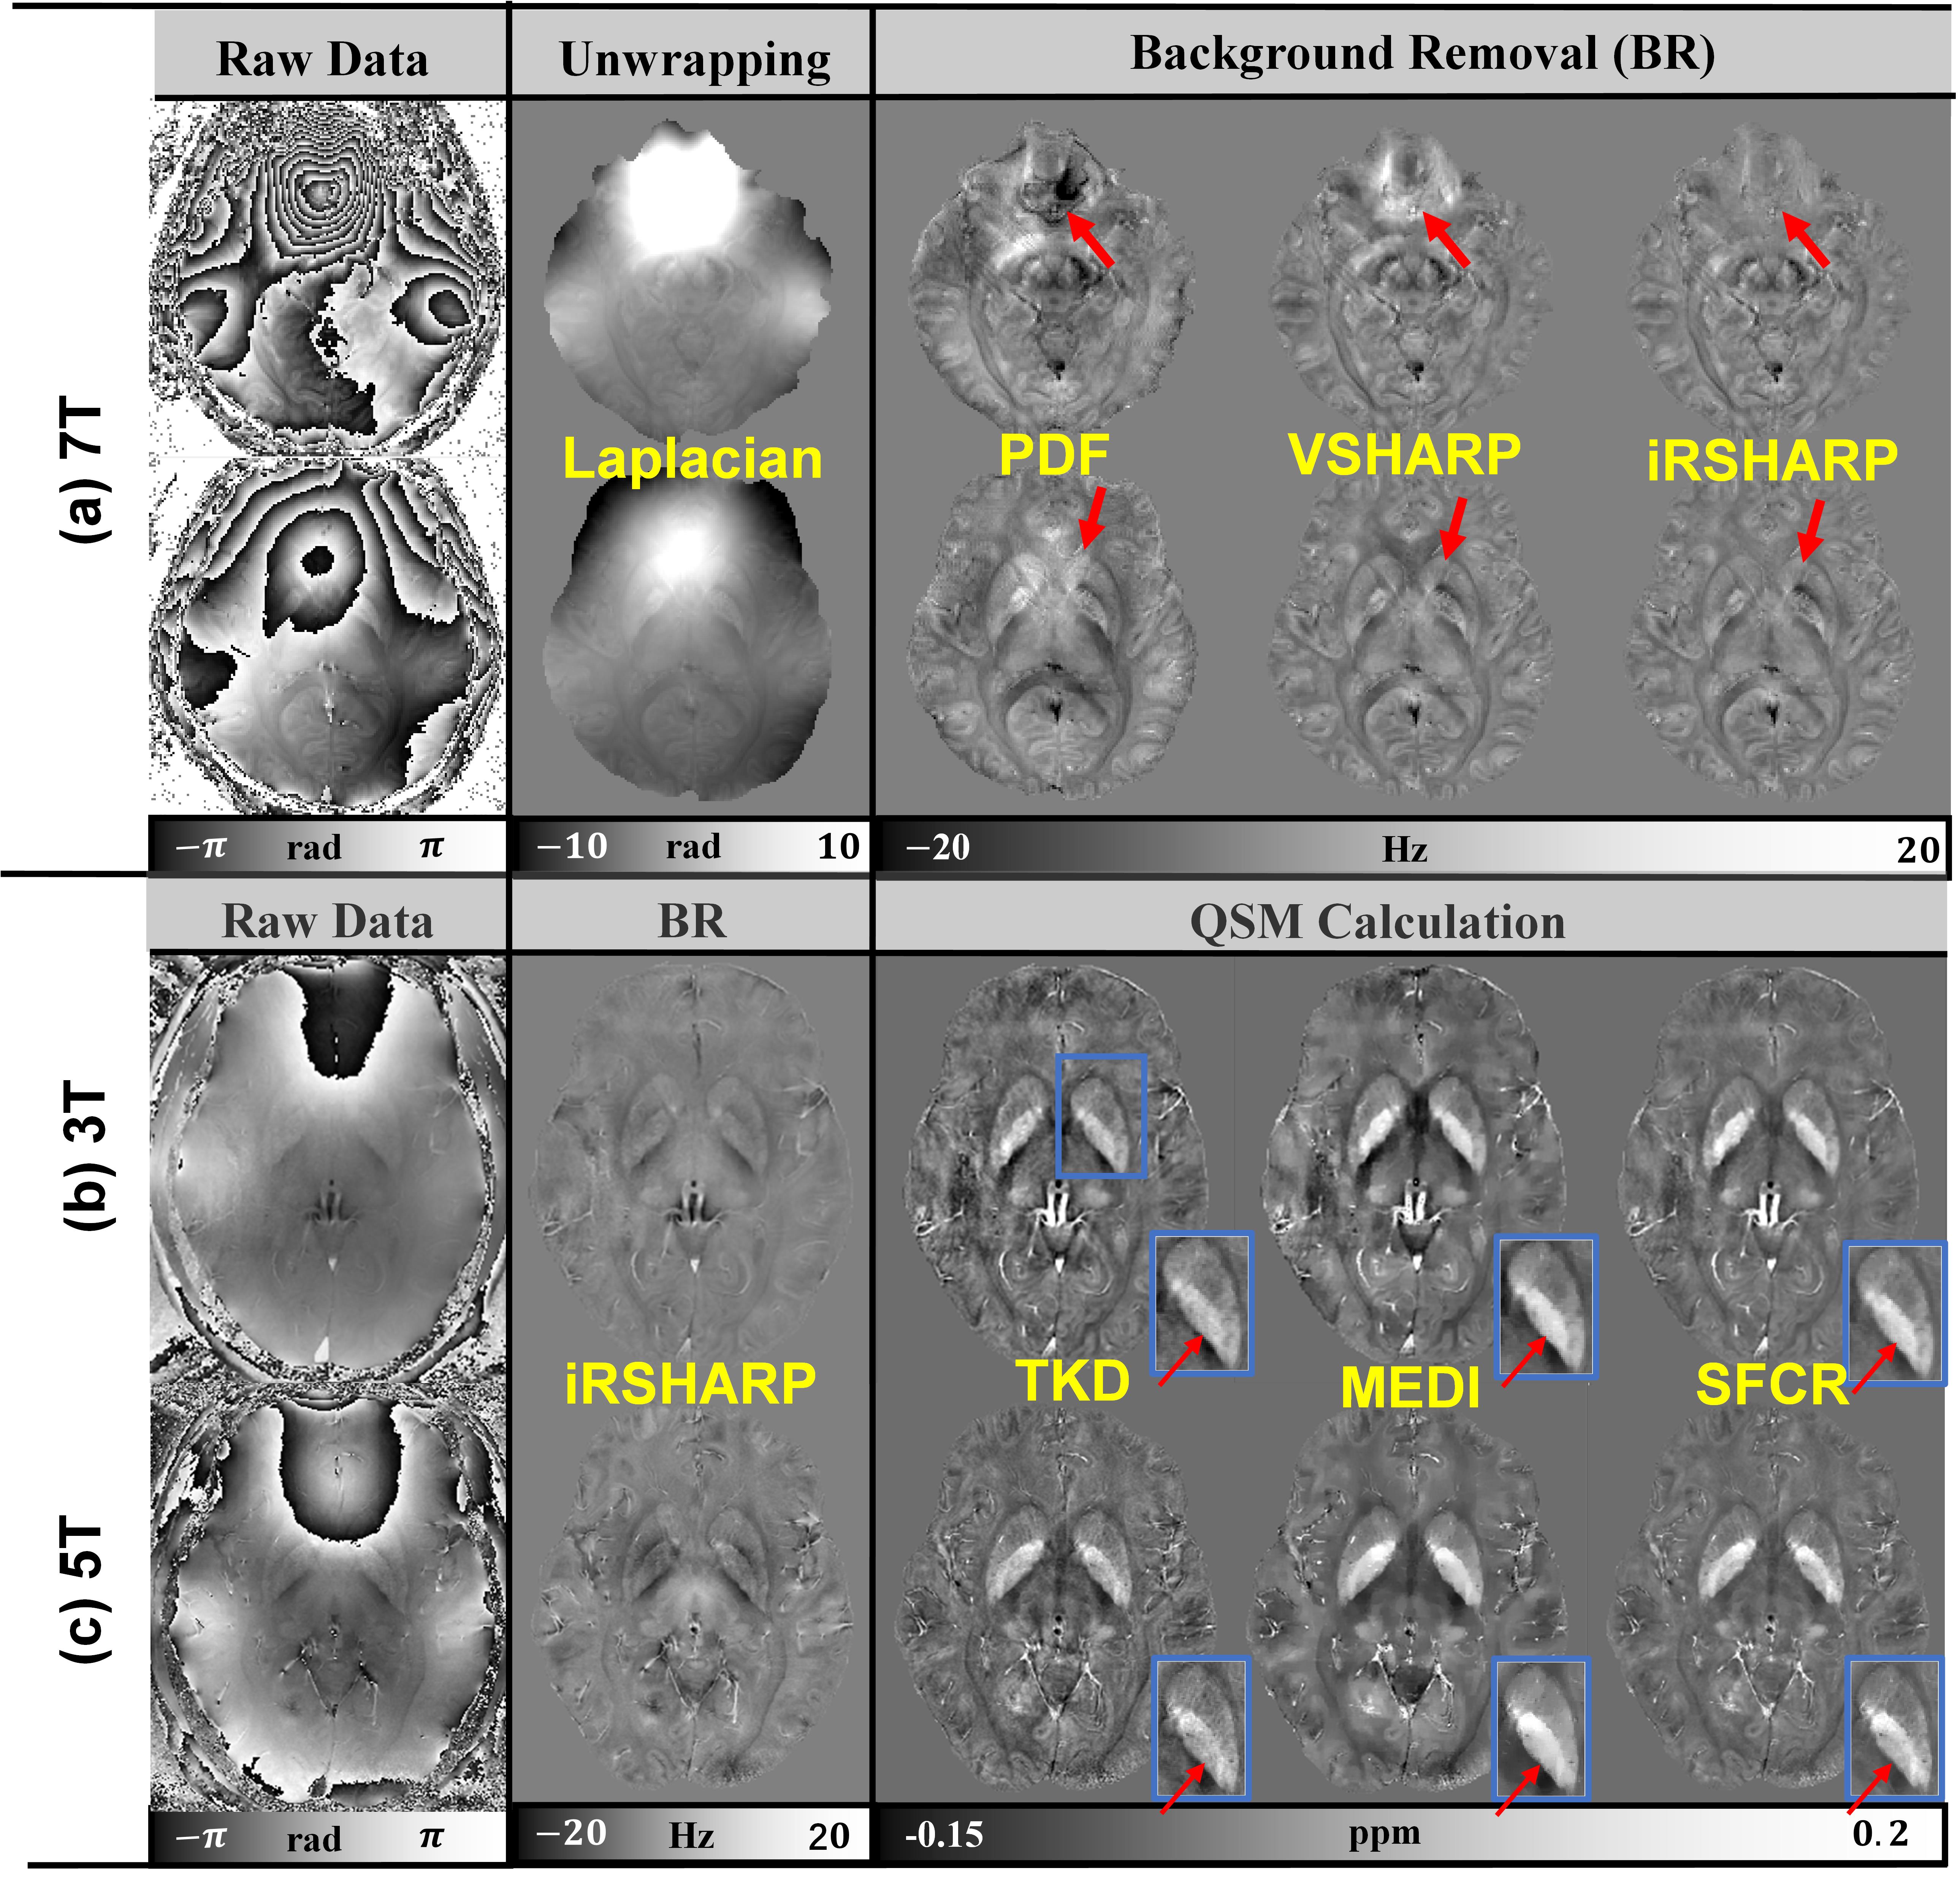
Fig. 4 shows the results of QSM reconstruction. For 7T data, the local field map using PDF retains noises at the air-tissue interface while VSHARP is not effective at the sinus region. In contrast, iRSHARP processes well for these strong interference regions. QSM maps on 3T and 5T seem to be similar in tissue structure, however, TKD results the streaking artifacts and the susceptibility values are generally lower in GP. A thin internal medullary lamina (indicated by the red arrow) between globus pallidus internus (GPi) and globus pallidus externus (GPe) is shown clearly on the map using SFCR of 5T, which is not evident on the map of MEDI and the 3T results. Fig.5 illustrates the results of ROI processing on 7T data. From the statistical bar graphs, we can conclude the susceptibility of DGMN in Ori2 is most similar to that in COSMOS. Its slopes both in the left and right brain are closer to 1. The correlation coefficients r in all orientations are above 0.9, while Ori2 reaches 0.98 in the right brain and 0.99 in the left brain with the lowest p values.Conclusion
SIPAS is a tool to process QSM reconstruction and delineate ROIs for analysis. It contains high-performance algorithms such as iRSHARP and SFCR, which are generally not included in other toolboxes. Under the multi-echo and high-field conditions, the combination of iRSHARP and SFCR presents the most reasonable results. The ROI processing which plays a great role in QSM study is rare in present toolboxes. By providing multiple methods for each step, users can attempt different combinations. Further, the delineation operation is easy to follow and SIPAS fulfills the analysis of ROIs. With a complete processing and analysis procedure, accurate results, and a friendly user interaction mode, SIPAS may promote the application of QSM in scientific research and clinical practice.Acknowledgements
This work was supported in part by the National Natural Science Foundation of China under Grant 62071405.References
[1]. Stewart, A. W., et al. QSMxT: Robust masking and artifact reduction for quantitative susceptibility mapping. Magn Reson Med. 2022; 87(3), 1289-1300.
[2]. Chan, K. S., & Marques, J. P. . SEPIA-Susceptibility mapping pipeline tool for phase images. Neuroimage. 2021; 227, 117611.
[3]. Zachariou, V., Bauer, et al. Ironsmith: An automated pipeline for QSM-based data analyses. Neuroimage. 2022; 249, 118835.
[4]. Fang, J., Bao, L., Li, X., et al. Background field removal for susceptibility mapping of human brain with large susceptibility variations. Magn Reson Med. 2019; 81(3), 2025-2037.
[5]. Bao, L., Li, X., Cai, C., et al. Quantitative Susceptibility Mapping Using Structural Feature Based Collaborative Reconstruction (SFCR) in the Human Brain. IEEE Transactions on Medical Imaging. 2016; 35(9), 2040-2050.
[6]. Karsa, A., & Shmueli, K. . SEGUE: A Speedy rEgion-Growing Algorithm for Unwrapping Estimated Phase. IEEE Trans Med Imaging. 2019; 38(6), 1347-1357.
[7]. Liu, T., Liu, J., de Rochefort, L., et al. . Morphology enabled dipole inversion (MEDI) from a single-angle acquisition: comparison with COSMOS in human brain imaging. Magn Reson Med. 2011; 66(3), 777-783.
[8]. Liu, T., Khalidov, et al. A novel background field removal method for MRI using projection onto dipole fields (PDF). NMR Biomed. 2011; 24(9), 1129-1136.
[9]. Schweser, F., Deistung, et al.. Toward online reconstruction of quantitative susceptibility maps: superfast dipole inversion. Magn Reson Med. 2013; 69(6), 1582-1594.
Figures